You are not logged in.
This means you
CAN ONLY VIEW reports that were published prior to Monday, April 14, 2025.
You
MUST UPGRADE YOUR MEMBERSHIP if you want to see any current reports.
AFTER MARKET UPDATE - TUESDAY, JANUARY 8TH, 2013
Previous After Market Report Next After Market Report >>>
|
|
|
|
DOW |
-55.44 |
13,328.85 |
-0.41% |
|
Volume |
691,615,490 |
+11% |
|
Volume |
1,665,932,540 |
+1% |
|
NASDAQ |
-7.00 |
3,091.81 |
-0.23% |
|
Advancers |
1,483 |
48% |
|
Advancers |
1,161 |
45% |
|
S&P 500 |
-4.74 |
1,457.15 |
-0.32% |
|
Decliners |
1,500 |
48% |
|
Decliners |
1,307 |
51% |
|
Russell 2000 |
-1.10 |
874.70 |
-0.13% |
|
52 Wk Highs |
188 |
|
|
52 Wk Highs |
89 |
|
|
S&P 600 |
-1.31 |
488.98 |
-0.27% |
|
52 Wk Lows |
4 |
|
|
52 Wk Lows |
8 |
|
|
 |
Major Averages Edged Lower on Evenly Mixed Session
Kenneth J. Gruneisen - Passed the CAN SLIM® Master's Exam
The major averages again finished with modest losses but ended off of their worst levels on Tuesday. The volume totals were reported slightly higher on the NYSE and on the Nasdaq exchange. Decliners led advancers by a narrow margin on the Nasdaq exchange and the action on the NYSE was very evenly mixed. The total number of stocks hitting new 52-week highs still easily outnumbered new 52-week lows on the NYSE and on the Nasdaq exchange, and new lows remained in the single digits on both the NYSE and on the Nasdaq exchange. There were 73 high-ranked companies from the CANSLIM.net Leaders List making new 52-week highs and appearing on the CANSLIM.net BreakOuts Page, up from the prior session total of 61 stocks. Any sustainable rally requires a healthy crop of companies hitting new 52-week highs, so it was encouraging last week to see a great expansion in new leadership. There were gains for 9 of the 10 high-ranked companies currently included on the Featured Stocks Page.
Stocks declined throughout the session as investors exercised caution ahead of fourth-quarter earnings season. All 10 sectors on the S&P ended lower, led by declines in telecom stocks. Verizon Communications (VZ -2.43%) AT&T Inc (T -1.69%) gave up ground. In other news, shares of Boeing Co (BA -2.63%) ended lower following two safety incidents with their 737 dreamliner aircrafts that raised concerns over potential design flaws. Also on the downside, Yum! Brands (YUM -4.20%) fell after the company warned that full year earnings would be less than projected due to weak sales in China.
Turning to fixed income market, Treasuries were higher along the curve. The benchmark 10-year note was up 5/16 of a point to yield 1.87% and the 30-year bond advanced 5/8 of a point to yield 3.07%.
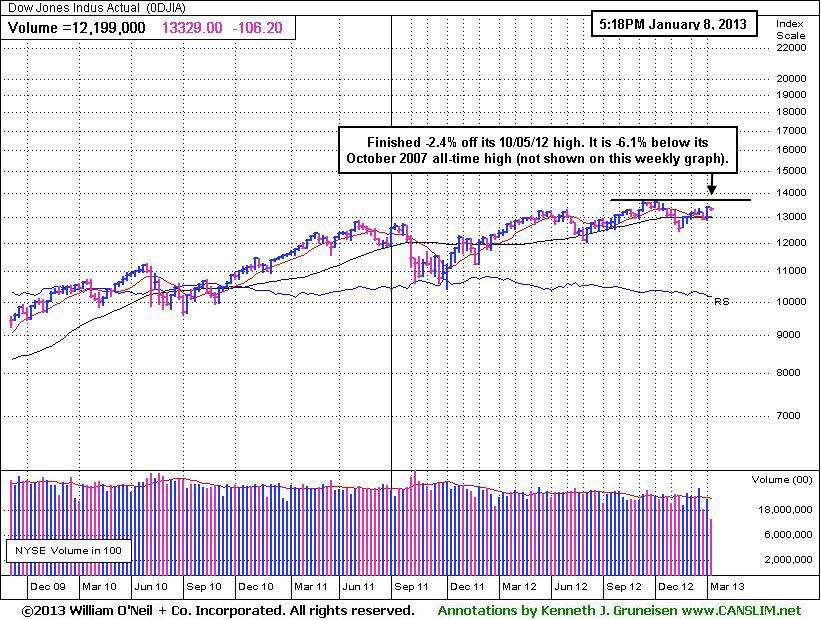
Investors may consider new buying efforts in stocks meeting all key criteria, as the market's (M criteria) confirmed uptrend showed a great expansion in leadership (stocks hitting new 52-week highs) after overcoming recent pressure. Solid gains helped the benchmark S&P 500 Index promptly rebound above its 50-day moving average (DMA) line, and Nasdaq Composite Index and Dow Jones Industrial Average both promptly rebounded above their respective 50 DMA and 200 DMA lines. All of the major averages then blasted above their December highs with additional volume-driven gains.
Watch for an announcement via email concerning the next WEBCAST. The webcast will also be available via an updated link highlighted at the top of the Premium Member Homepage.
PICTURED: The Dow Jones Industrial Average finished -2.4% off its 10/05/12 high with a small loss on the session. Keep in mind that it is -6.1% below its October 2007 all-time high (not shown on the weekly graph above).
|
 Kenneth J. Gruneisen started out as a licensed stockbroker in August 1987, a couple of months prior to the historic stock market crash that took the Dow Jones Industrial Average down -22.6% in a single day. He has published daily fact-based fundamental and technical analysis on high-ranked stocks online for two decades. Through FACTBASEDINVESTING.COM, Kenneth provides educational articles, news, market commentary, and other information regarding proven investment systems that work in good times and bad.
Comments contained in the body of this report are technical opinions only and are not necessarily those of Gruneisen Growth Corp. The material herein has been obtained from sources believed to be reliable and accurate, however, its accuracy and completeness cannot be guaranteed. Our firm, employees, and customers may effect transactions, including transactions contrary to any recommendation herein, or have positions in the securities mentioned herein or options with respect thereto. Any recommendation contained in this report may not be suitable for all investors and it is not to be deemed an offer or solicitation on our part with respect to the purchase or sale of any securities. |
|
 |
Tech, Financial, Healthcare, and Oil Services Indexes Fell
Kenneth J. Gruneisen - Passed the CAN SLIM® Master's Exam
The Networking Index ($NWX -2.67%) led the tech sector lower while the Semiconductor Index ($SOX -1.12%) and Internet Index ($IIX -0.41%) ended with smaller losses. The Broker/Dealer Index ($XBD -0.93%) and the Bank Index ($BKX -0.54%) lost ground and weighed on the major averages. Weak action in the Healthcare Index ($HMO -1.93%) and the Oil Services Index ($OSX -1.23%) also created a drag on the market. The Gold & Silver Index ($XAU +0.22%), Retail Index ($RLX +0.27%), and the Integrated Oil Index ($XOI +0.08%) managed to put up small gains.
Charts courtesy www.stockcharts.com
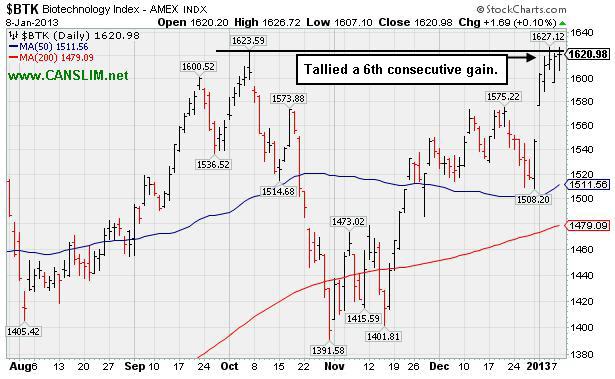
PICTURED: The Biotechnology Index ($BTK +0.10%) inched higher for a 6th consecutive gain, recently trading above its highs.
| Oil Services |
$OSX |
228.84 |
-2.85 |
-1.23% |
+3.94% |
| Healthcare |
$HMO |
2,470.76 |
-48.52 |
-1.93% |
-1.73% |
| Integrated Oil |
$XOI |
1,269.35 |
+1.02 |
+0.08% |
+2.22% |
| Semiconductor |
$SOX |
391.36 |
-4.42 |
-1.12% |
+1.90% |
| Networking |
$NWX |
234.31 |
-6.43 |
-2.67% |
+3.42% |
| Internet |
$IIX |
334.86 |
-1.37 |
-0.41% |
+2.40% |
| Broker/Dealer |
$XBD |
97.14 |
-0.91 |
-0.93% |
+2.98% |
| Retail |
$RLX |
665.47 |
-3.50 |
+0.52% |
+2.44% |
| Gold & Silver |
$XAU |
160.55 |
+0.35 |
+0.22% |
-3.05% |
| Bank |
$BKX |
53.26 |
-0.29 |
-0.54% |
+3.86% |
| Biotech |
$BTK |
1,620.98 |
+1.69 |
+0.10% |
+4.78% |
|
|
|
 |
Unhindered by Overhead Supply, But Extended From Prior Base
Kenneth J. Gruneisen - Passed the CAN SLIM® Master's Exam
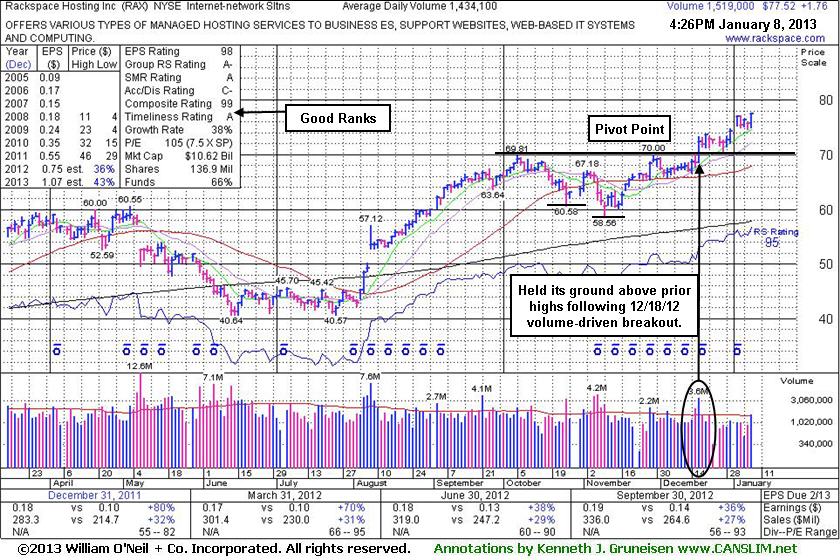
Rackspace Hosting Inc (RAX +$3.89 or +5.67% to $72.44) finished at the session high and an all-time high with today's gain on average volume. It is extended from its prior base, meanwhile prior highs in the $70 area define initial support to watch. Disciplined investors avoid chasing extended stocks more than +5% above their pivot point. Making sloppy buy decisions by chasing extended stocks invites a much greater chance that an ordinary consolidation might prompt investors to invoke the investment system's strict loss-limiting sell rule after a pullback of -7% or more from their purchase price.
It reported earnings +36% on +27% sales revenues for the quarter ended September 30, 2012 versus the year ago period and its fundamentals remain strong. The past 11 quarterly earnings comparisons have shown better than +25% increases (C criteria). Its annual earnings history (A criteria) since trading began in 2008 has been good. Increasing institutional ownership (I criteria) is a reassuring sign, as the number of top-rated funds owning its shares rose from 408 in Dec '10 to 651 in Dec '12.
RAX has rallied unhindered by resistance due to overhead supply since last shown in this FSU section on 12/18/12 with an annotated graph under the headline, "Volume-Driven Gain Above New Pivot Point Triggered Technical Buy Signal". It had hit a new 52-week high with a solid gain backed by +142% above average volume. Its strong close above the new pivot point cited based on its 11/29/12 high plus 10 cents clinched a new (or add-on) technical buy signal as we observed - "There is no assurance that it will go on to produce great gains now, but the volume-driven gain above the latest pivot is a convincing sign that it may be capable of a more substantial rally in the weeks and months ahead."
|
|
|
Color Codes Explained :
Y - Better candidates highlighted by our
staff of experts.
G - Previously featured
in past reports as yellow but may no longer be buyable under the
guidelines.
***Last / Change / Volume data in this table is the closing quote data***
Symbol/Exchange
Company Name
Industry Group |
PRICE |
CHANGE
(%Change) |
Day High |
Volume
(% DAV)
(% 50 day avg vol) |
52 Wk Hi
% From Hi |
Featured
Date |
Price
Featured |
Pivot Featured |
|
Max Buy |
CELG
-
NASDAQ
Celgene Corp
DRUGS - Drug Manufacturers - Major
|
$91.41
|
+5.68
6.63% |
$91.52
|
11,442,727
382.75% of 50 DAV
50 DAV is 2,989,600
|
$85.94
6.36%
|
12/11/2012
|
$82.24
|
PP = $81.34
|
|
MB = $85.41
|
 Most Recent Note - 1/8/2013 12:03:59 PM
G - After a strong finish on the prior session it gapped up today, getting more extended from its prior base. Raised its guidance and rallied well above its "max buy" level with heavy volume while adding to its streak of consecutive gains. Prior highs near $81-82 define initial support to watch on pullbacks.
>>> The latest Featured Stock Update with an annotated graph appeared on 1/3/2013. Click here.
View all notes |
Alert me of new notes |
CANSLIM.net Company Profile |
SEC |
Zacks Reports |
StockTalk |
News |
Chart |
Request a new note
C
A N
S L
I M


|
CFNL
-
NASDAQ
Cardinal Financial Corp
BANKING - Regional - Southeast Banks
|
$16.67
|
+0.15
0.91% |
$16.82
|
379,568
173.64% of 50 DAV
50 DAV is 218,600
|
$16.90
-1.36%
|
12/3/2012
|
$15.20
|
PP = $16.31
|
|
MB = $17.13
|
Most Recent Note - 1/8/2013 2:33:49 PM
Y - Poised for a best-ever close with above average volume behind today's gain, yet still trading below its "max buy" level. Hit a new 52-week high and cleared its pivot point on 1/02/13 with sufficient volume to trigger a proper new (or add-on) technical buy signal.
>>> The latest Featured Stock Update with an annotated graph appeared on 12/31/2012. Click here.
View all notes |
Alert me of new notes |
CANSLIM.net Company Profile |
SEC |
Zacks Reports |
StockTalk |
News |
Chart |
Request a new note
C
A N
S L
I M
|
CMCSA
-
NASDAQ
Comcast Corp Cl A
MEDIA - CATV Systems
|
$38.16
|
+0.26
0.69% |
$38.16
|
16,755,022
140.57% of 50 DAV
50 DAV is 11,919,500
|
$38.58
-1.09%
|
12/3/2012
|
$37.08
|
PP = $38.06
|
|
MB = $39.96
|
Most Recent Note - 1/8/2013 2:36:18 PM
Y - It stalled and has been hovering near its 52-week high since its gain above its pivot point on 1/02/12 had sufficient volume to trigger a technical buy signal. No resistance remains due to overhead supply.
>>> The latest Featured Stock Update with an annotated graph appeared on 12/27/2012. Click here.
View all notes |
Alert me of new notes |
CANSLIM.net Company Profile |
SEC |
Zacks Reports |
StockTalk |
News |
Chart |
Request a new note
C
A N
S L
I M
|
LULU
-
NASDAQ
Lululemon Athletica
MANUFACTURING - Textile Manufacturing
|
$71.63
|
+0.53
0.75% |
$71.67
|
2,225,630
111.96% of 50 DAV
50 DAV is 1,987,900
|
$81.09
-11.67%
|
12/26/2012
|
$73.81
|
PP = $77.95
|
|
MB = $81.85
|
Most Recent Note - 1/8/2013 2:41:18 PM
G - Holding its ground today near its 50 DMA line and trading -12.1% off its 52-week high. Distributional losses on above average volume raised concerns following a "negative reversal" on 1/02/13. Disciplined investors waited to take any action after it was recently noted - "Subsequent volume-driven gains above its pivot point are still needed to trigger a new technical buy signal."
>>> The latest Featured Stock Update with an annotated graph appeared on 12/28/2012. Click here.
View all notes |
Alert me of new notes |
CANSLIM.net Company Profile |
SEC |
Zacks Reports |
StockTalk |
News |
Chart |
Request a new note
C
A N
S L
I M
|
MIDD
-
NASDAQ
Middleby Corp
MANUFACTURING - Diversified Machinery
|
$131.79
|
+0.13
0.10% |
$132.99
|
88,011
100.13% of 50 DAV
50 DAV is 87,900
|
$134.51
-2.02%
|
10/8/2012
|
$118.46
|
PP = $122.67
|
|
MB = $128.80
|
Most Recent Note - 1/8/2013 2:43:21 PM
G - Holding its ground stubbornly near its 52-week and all-time highs with recent volume totals below average. Earnings +23% on +18% sales for the Sep '12 quarter, below the +25% minimum earnings guideline (C criteria), raised concerns.
>>> The latest Featured Stock Update with an annotated graph appeared on 12/26/2012. Click here.
View all notes |
Alert me of new notes |
CANSLIM.net Company Profile |
SEC |
Zacks Reports |
StockTalk |
News |
Chart |
Request a new note
C
A N
S L
I M
|
Symbol/Exchange
Company Name
Industry Group |
PRICE |
CHANGE
(%Change) |
Day High |
Volume
(% DAV)
(% 50 day avg vol) |
52 Wk Hi
% From Hi |
Featured
Date |
Price
Featured |
Pivot Featured |
|
Max Buy |
N
-
NYSE
Netsuite Inc
DIVERSIFIED SERVICES - Business/Management Services
|
$68.03
|
+0.25
0.37% |
$68.71
|
195,923
45.22% of 50 DAV
50 DAV is 433,300
|
$70.06
-2.90%
|
12/12/2012
|
$64.75
|
PP = $67.12
|
|
MB = $70.48
|
Most Recent Note - 1/4/2013 5:25:16 PM
Y - Tallied another gain above its pivot point marked by light volume. Disciplined investors know that volume must be at least +40% above average behind gains above the pivot point to trigger a proper technical buy signal. See the latest FSU analysis for more details and a new annotated graph.
>>> The latest Featured Stock Update with an annotated graph appeared on 1/4/2013. Click here.
View all notes |
Alert me of new notes |
CANSLIM.net Company Profile |
SEC |
Zacks Reports |
StockTalk |
News |
Chart |
Request a new note
C
A N
S L
I M
|
NSR
-
NYSE
Neustar Inc
TELECOMMUNICATIONS - Diversified Communication Serv
|
$42.66
|
-0.29
-0.68% |
$43.37
|
411,225
101.94% of 50 DAV
50 DAV is 403,400
|
$43.90
-2.82%
|
12/11/2012
|
$41.85
|
PP = $41.41
|
|
MB = $43.48
|
Most Recent Note - 1/8/2013 2:45:22 PM
Y - Quietly consolidating just below its "max buy" level and its color code is changed to yellow. Subsequent deterioration below its old high close ($41.05 on 10/05/12) could negate its recent breakout, a worrisome sign.
>>> The latest Featured Stock Update with an annotated graph appeared on 1/2/2013. Click here.
View all notes |
Alert me of new notes |
CANSLIM.net Company Profile |
SEC |
Zacks Reports |
StockTalk |
News |
Chart |
Request a new note
C
A N
S L
I M
|
RAX
-
NYSE
Rackspace Hosting Inc
INTERNET - Internet Software and; Services
|
$77.52
|
+1.76
2.32% |
$77.52
|
1,594,844
111.21% of 50 DAV
50 DAV is 1,434,100
|
$77.13
0.51%
|
12/18/2012
|
$71.88
|
PP = $70.10
|
|
MB = $73.61
|
Most Recent Note - 1/8/2013 2:46:54 PM
G - Inching to another new all-time high with today's gain lacking great volume conviction. Getting extended from its prior base, meanwhile prior highs in the $70 area define initial support to watch.
>>> The latest Featured Stock Update with an annotated graph appeared on 1/8/2013. Click here.
View all notes |
Alert me of new notes |
CANSLIM.net Company Profile |
SEC |
Zacks Reports |
StockTalk |
News |
Chart |
Request a new note
C
A N
S L
I M
|
RNF
-
NYSE
Rentech Nitrogen Ptnr Lp
CHEMICALS - Agricultural Chemicals
|
$43.35
|
+0.78
1.83% |
$43.59
|
442,334
146.08% of 50 DAV
50 DAV is 302,800
|
$43.24
0.26%
|
11/1/2012
|
$39.11
|
PP = $40.15
|
|
MB = $42.16
|
Most Recent Note - 1/8/2013 12:48:26 PM
G - Touched another new 52-week high today while on track for a 7th consecutive gain, getting extended from its prior base. Prior highs in the $40 area define initial support to watch on pullbacks
>>> The latest Featured Stock Update with an annotated graph appeared on 12/19/2012. Click here.
View all notes |
Alert me of new notes |
CANSLIM.net Company Profile |
SEC |
Zacks Reports |
StockTalk |
News |
Chart |
Request a new note
C
A N
S L
I M
|
VRX
-
NYSE
Valeant Pharmaceuticals
DRUGS - Drug Manufacturers - Other
|
$62.29
|
+0.98
1.60% |
$62.46
|
1,610,968
105.52% of 50 DAV
50 DAV is 1,526,700
|
$61.61
1.10%
|
12/20/2012
|
$60.24
|
PP = $61.21
|
|
MB = $64.27
|
Most Recent Note - 1/8/2013 2:50:17 PM
Y - Today's gain has it rallying above its pivot point to a new 52-week high, however volume thus far is below the +40% above average volume guideline which is the bare minimum threshold needed to trigger a proper technical buy signal. Disciplined investors may use a tactic called "pyramiding" to allow market action to dictate their positioning.
>>> The latest Featured Stock Update with an annotated graph appeared on 12/20/2012. Click here.
View all notes |
Alert me of new notes |
CANSLIM.net Company Profile |
SEC |
Zacks Reports |
StockTalk |
News |
Chart |
Request a new note
C
A N
S L
I M
|
Symbol/Exchange
Company Name
Industry Group |
PRICE |
CHANGE
(%Change) |
Day High |
Volume
(% DAV)
(% 50 day avg vol) |
52 Wk Hi
% From Hi |
Featured
Date |
Price
Featured |
Pivot Featured |
|
Max Buy |
|
|
|
THESE ARE NOT BUY RECOMMENDATIONS!
Comments contained in the body of this report are technical
opinions only. The material herein has been obtained
from sources believed to be reliable and accurate, however,
its accuracy and completeness cannot be guaranteed.
This site is not an investment advisor, hence it does
not endorse or recommend any securities or other investments.
Any recommendation contained in this report may not
be suitable for all investors and it is not to be deemed
an offer or solicitation on our part with respect to
the purchase or sale of any securities. All trademarks,
service marks and trade names appearing in this report
are the property of their respective owners, and are
likewise used for identification purposes only.
This report is a service available
only to active Paid Premium Members.
You may opt-out of receiving report notifications
at any time. Questions or comments may be submitted
by writing to Premium Membership Services 665 S.E. 10 Street, Suite 201 Deerfield Beach, FL 33441-5634 or by calling 1-800-965-8307
or 954-785-1121.
|
|
|

