You are not logged in.
This means you
CAN ONLY VIEW reports that were published prior to Monday, April 14, 2025.
You
MUST UPGRADE YOUR MEMBERSHIP if you want to see any current reports.
AFTER MARKET UPDATE - FRIDAY, JANUARY 8TH, 2010
Previous After Market Report Next After Market Report >>>
|
|
|
|
DOW |
+11.33 |
10,618.19 |
+0.11% |
|
Volume |
994,186,260 |
-17% |
|
Volume |
2,194,375,580 |
-9% |
|
NASDAQ |
+17.12 |
2,317.17 |
+0.74% |
|
Advancers |
1,841 |
59% |
|
Advancers |
1,697 |
60% |
|
S&P 500 |
+3.29 |
1,144.98 |
+0.29% |
|
Decliners |
1,172 |
37% |
|
Decliners |
1,001 |
35% |
|
Russell 2000 |
+2.59 |
644.56 |
+0.40% |
|
52 Wk Highs |
380 |
|
|
52 Wk Highs |
160 |
|
|
S&P 600 |
+1.08 |
341.47 |
+0.32% |
|
52 Wk Lows |
4 |
|
|
52 Wk Lows |
4 |
|
|
 |
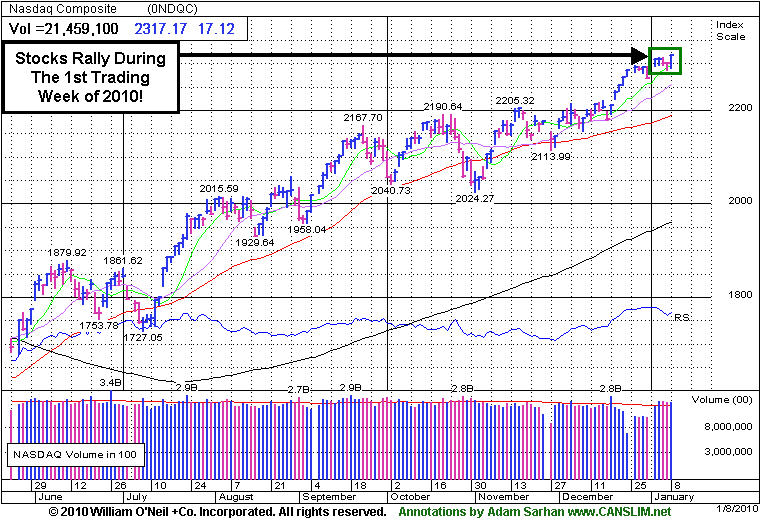
Indices' Rally to Recovery Highs in First Week of 2010 Bodes Well
Adam Sarhan, Contributing Writer,
Investors digested a slew of economic data and sent stocks higher during the first trading week of 2010. Volume, an important indicator of institutional sponsorship, was reported slightly lower than Thursday's totals which indicated large institutions were not aggressively buying or selling stocks. Advancers led decliners by a 3-to-2 ratio on the NYSE and on the Nasdaq exchange. There were 30 high-ranked companies from the CANSLIM.net Leaders List that made a new 52-week high and appeared on the CANSLIM.net BreakOuts Page, lower than the total of 32 issues that appeared on the prior session. New 52-week highs solidly outnumbered new 52-week lows on the NYSE and on the Nasdaq exchange, and new lows on the Nasdaq were again in the single digits which is a healthy sign.
Monday was the first trading day of 2010 and stocks opened with a bang as the US dollar fell and healthy manufacturing data was released from the US and China. Before Monday's opening bell, China announced stronger than expected manufacturing data which sparked a broad based rally in overseas markets. Manufacturing in China grew by the strongest level since April 2004 and helped allay concerns that the global economic recovery was waning. It is important to note that China was one of the first countries to recover from the first global recession since World War II. The buying continued in the US when the Institute for Supply Management’s (ISM) factory gauge rose to 55.9. The report topped estimates and was the highest level in more than three years, which suggests the US manufacturing sector is definitely in recovery mode.
On Tuesday, stocks ended mixed as investors digested two important economic data points: factory orders and pending home sales. First, the good news, the Commerce Department said that factory orders in November rose +1.1% which more than doubled the Street's estimate for a +0.4% increase. Then, the National Association of Realtors said pending home sales plunged -16% in November, which was the lowest reading since June and fell short of the Street's lowest estimate.
Stocks ended mixed on Wednesday after a private report from ADP showed employers cut more jobs than expected last month and some Federal Reserve officials said they are willing to entertain the notion of more stimulus measures in 2010. Before Wednesday's opening bell, ADP Employer Services Inc., the country's largest private payrolls firm, said US employers slashed -84,000 jobs in December which fell short of the Street's estimate of -75,000. Elsewhere, the Institute for Supply Management (ISM) released a weaker than expected report on the service sector. Its non-manufacturing business index rose to 50.1, from 48.7 in the prior month. The reading topped the boom/bust level of 50 which shows growth but fell short of the 50.5 consensus. At 2:00PM EST, the Federal Open Market Committee (FOMC) released the minutes of its last meeting in 2009. The minutes for the December 15-16 FOMC meeting showed that several Fed officials are open to the notion of further stimulus measures, if needed, in 2010.
For a third consecutive session, stocks ended mixed on Thursday as investors digested mixed economic data: positive retail sales data and a modestly negative weekly jobless claims report. Finally, at 8:30AM EST on Friday, the Labor Department released December's much anticipated jobs report. US employers slashed -85,000 jobs last month which fell short of the Street's unchanged estimate. Meanwhile, the unemployment rate held steady at -10% which is near a 26-year high. However, November's reading was revised to show a gain of 4,000 which was the first time US employers added jobs in nearly two years. Since the recession began, the US has lost 7.2 million jobs which is the largest on a percentage basis of all jobs since World War II ended in 1944-45.
However, after all was said and done, stocks remain strong as investors digested the latest round of economic data. The benchmark S&P 500, Dow Jones Industrial Average, NYSE Composite, Nasdaq Composite, mid-cap S&P 400, small-cap Russell 2000 and small-cap S&P 600 indices all enjoyed fresh recovery closing highs in the first week of 2010. The current rally just ended its 44th week (since the March 12, 2009 follow-through day) and on all accounts still looks very strong. In addition, most bull markets last for approximately 36 months, so the fact that we are beginning our 10th month suggests we have more room to go. Until support is broken (50 DMA lines for the major averages) this rally deserves the bullish benefit of the doubt.
Professional Money Management Services - A Winning System - Inquire today!
Our skilled team of portfolio managers knows how to follow the rules of this fact-based investment system. We do not follow opinion or the "conviction list" of some large Wall Street institution which would have us fully invested even during horrific bear markets. Instead, we remain fluid and only buy the best stocks when they are triggering proper technical buy signals. If you are not completely satisfied with the way your portfolio is being managed, Click here to submit your inquiry. *Accounts over $250,000 please. ** Serious inquires only, please.
PICTURED: The Nasdaq Composite Index rallied to new recovery highs during the first week of 2010.
|
|
|
 |
Oil Services Index Blasts to New Recovery Highs
Kenneth J. Gruneisen - Passed the CAN SLIM® Master's Exam
The Oil Services Index ($OSX +2.07%) was a standout gainer on Friday as it posted a 5th consecutive gain and charged to a new recovery high, clearing prior highs discussed in Thursday's Industry Group Watch section (read here). The Semiconductor Index ($SOX +1.48%) led the tech sector, followed by smaller gains from the Internet Index ($IIX +0.61%) and Biotechnology Index ($BTK +0.25%), with the Networking Index ($NWX -0.00%) ending unchanged. Meanwhile, the Healthcare Index ($HMO -0.83%) slumped, and there were small losses from the Broker/Dealer Index ($XBD -0.31%), Bank Index ($BKX -0.19%), and Retail Index ($RLX -0.09%).
Charts courtesy www.stockcharts.com

PICTURED: The Gold & Silver Index ($XAU +1.41%) rallied back above 50-day moving average (DMA) after finding support at an upward trendline.
| Oil Services |
$OSX |
216.61 |
+4.39 |
+2.07% |
+11.13% |
| Healthcare |
$HMO |
1,564.40 |
-13.16 |
-0.83% |
+6.21% |
| Integrated Oil |
$XOI |
1,116.19 |
+3.66 |
+0.33% |
+4.49% |
| Semiconductor |
$SOX |
367.68 |
+5.38 |
+1.48% |
+2.16% |
| Networking |
$NWX |
238.36 |
-0.01 |
-0.00% |
+3.16% |
| Internet |
$IIX |
235.92 |
+1.44 |
+0.61% |
+0.88% |
| Broker/Dealer |
$XBD |
119.89 |
-0.37 |
-0.31% |
+4.21% |
| Retail |
$RLX |
416.89 |
-0.36 |
-0.09% |
+1.40% |
| Gold & Silver |
$XAU |
181.74 |
+2.53 |
+1.41% |
+8.02% |
| Bank |
$BKX |
47.00 |
-0.09 |
-0.19% |
+10.04% |
| Biotech |
$BTK |
973.10 |
+2.47 |
+0.25% |
+3.29% |
|
|
|
 |
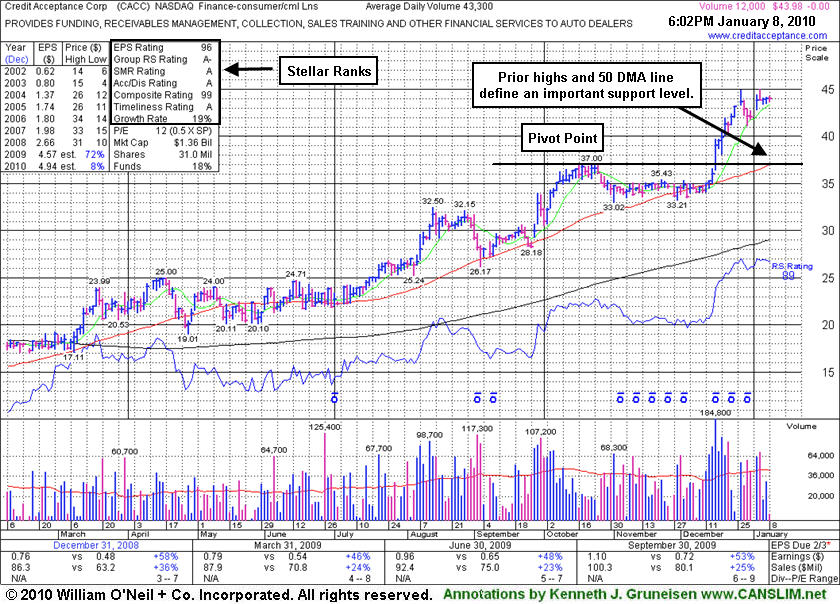
Leader Holding Its Ground Extended From Prior Base
Kenneth J. Gruneisen - Passed the CAN SLIM® Master's Exam
Credit Acceptance Corp (CACC -$0.00 or -0.00% to $43.98) is stubbornly holding its ground perched at all-time highs, extended from its prior base. Previous chart highs and its 50-day moving average line now coincide at $37, defining an important support level to watch. The Finance - Consumer/Commercial Loans firm has maintained a great track record of annual and quarterly sales revenues and earnings increases that satisfy the C and A criteria of the investment system.
Disciplined investors avoid chasing extended stocks that have risen more than +5% above their prior chart high or pivot point. If they miss the ideal window of opportunity, patience may allow investors to accumulate shares on light volume pullbacks, or when another new base forms and a new buy signal is triggered. Investors can then "force feed" their winners by adding to already profitable positions whenever additional buys can be made within the proper parameters. According to the investment system rules, averaging down should never be done. CACC was featured in yellow in the 9/29/09 mid-day report (read here) as a breakout gain was backed by more than 2 times average volume. Since first featured it has also risen above its 2006-2007 highs ($33-34) to new all-time highs, which is a very reassuring sign of strength.
|
|
|
Color Codes Explained :
Y - Better candidates highlighted by our
staff of experts.
G - Previously featured
in past reports as yellow but may no longer be buyable under the
guidelines.
***Last / Change / Volume quote data in this table corresponds with the timestamp on the note***
Symbol/Exchange
Company Name
Industry Group |
Last |
Chg. |
Vol
% DAV |
Date Featured |
Price Featured |
Latest Pivot Point
Featured |
Status |
| Latest Max Buy Price |
ARST
-
|
$28.91
|
+0.69
|
504,778
101% DAV
500,200
|
9/1/2009
(Date
Featured) |
$19.91
(Price
Featured) |
PP = $27.20 |
G |
| MB = $28.56 |
Most Recent Note - 1/8/2010 5:41:35 PM
G - Gain today on average volume for a new high close. Finished the week above its "max buy" level, and its color code is changed to green. A considerable gain on 1/04/10 triggered a technical buy signal as it blasted above its pivot point with volume more than 3 times average. ARST was first featured in yellow at $19.91 in the 9/01/09 mid-day report with an annotated daily graph (read here).
>>> The latest Featured Stock Update with an annotated graph appeared on 1/4/2010. click here.
|
|
C
A
S
I |
News |
Chart |
SEC
View all notes Alert
me of new notes
Company
Profile
|
ASIA
-
|
$29.78
|
+1.86
|
1,619,040
123% DAV
1,312,100
|
12/24/2009
(Date
Featured) |
$31.05
(Price
Featured) |
PP = $32.40 |
G |
| MB = $34.02 |
Most Recent Note - 1/8/2010 5:42:43 PM
G - Considerable gain today with slightly higher volume, rallying up from near its 50 DMA line after recent losses raised concerns. Its 50 DMA line (now $27.22) is the next important support level to watch. A technical buy signal did not occur since its advanced "3 weeks tight" pattern was recently noted. Traded up as much as +68.13% since first featured in the August 2009 CANSLIM.net News (read here).
>>> The latest Featured Stock Update with an annotated graph appeared on 12/23/2009. click here.
|
|
C
A
S
I |
News |
Chart |
SEC
View all notes Alert
me of new notes
Company
Profile
|
BIDU
- NASDAQ
Baidu Inc Ads
INTERNET - Internet Information Providers
|
$404.27
|
-0.36
|
1,669,829
98% DAV
1,696,800
|
9/8/2009
(Date
Featured) |
$351.80
(Price
Featured) |
PP = $440.00 |
G |
| MB = $462.00 |
Most Recent Note - 1/8/2010 5:45:33 PM
G - Lost ground for 7 of the past 8 sessions, and it encountered resistance at its 50 DMA line this week. Gains back above its 50 DMA line are needed for its outlook to improve. Technically, it has built a sloppy base over the past 11 weeks, and gains above its previously cited pivot point with at least +50% above average volume could trigger a new buy signal. BIDU traded up as much as +23% from its price when featured in yellow in the 9/08/09 Mid-Day BreakOuts Report (read here).
>>> The latest Featured Stock Update with an annotated graph appeared on 1/7/2010. click here.
|
|
C
A
S
I |
News |
Chart |
SEC
View all notes Alert
me of new notes
Company
Profile
|
CAAS
- NASDAQ
China Automotive Systems
AUTOMOTIVE - Auto Parts
|
$24.48
|
+1.63
|
1,367,954
152% DAV
897,700
|
11/30/2009
(Date
Featured) |
$18.84
(Price
Featured) |
PP = $17.62 |
G |
| MB = $18.50 |
Most Recent Note - 1/8/2010 5:47:19 PM
G - Hit a new all-time high today with a considerable gain with above average volume. Volume was more than 4 times average behind its considerable 1/05/10 gain for a new high. The choppy consolidation over the prior 5 weeks involved a -28% pullback, so this was not a sound "flat base" of the minimum length. However, no overhead supply remains and it could go on to produce a "climax run", especially considering its small float of only 4.86 million shares (S criteria). It found prompt support following a sharp pullback to its short-term average line. The Chinese maker of power steering systems had negated most of its bullish action since featured in the 11/30/09 mid-day report (read here).
>>> The latest Featured Stock Update with an annotated graph appeared on 12/29/2009. click here.
|
|
C
A
S
I |
News |
Chart |
SEC
View all notes Alert
me of new notes
Company
Profile
|
CACC
- NASDAQ
Credit Acceptance Corp
FINANCIAL SERVICES - Credit Services
|
$43.98
|
+0.00
|
15,474
36% DAV
43,300
|
9/29/2009
(Date
Featured) |
$33.48
(Price
Featured) |
PP = $37.10 |
G |
| MB = $38.96 |
Most Recent Note - 1/8/2010 5:48:08 PM
G - Holding its ground perched at all-time highs, extended from its prior base. Previous chart highs near $35-37 are an important support level to watch. The Finance - Consumer/Commercial Loans firm has maintained a great track record of annual and quarterly sales revenues and earnings increases. It was featured on 9/29/09 in yellow in the mid-day report (read here).
>>> The latest Featured Stock Update with an annotated graph appeared on 1/8/2010. click here.
|
|
C
A
S
I |
News |
Chart |
SEC
View all notes Alert
me of new notes
Company
Profile
|
CRM
- NYSE
Salesforce.com Inc
INTERNET - Internet Software & Services
|
$74.15
|
+0.11
|
1,377,536
79% DAV
1,735,500
|
12/18/2009
(Date
Featured) |
$67.32
(Price
Featured) |
PP = $67.82 |
G |
| MB = $71.21 |
Most Recent Note - 1/8/2010 5:48:51 PM
G - Hovering in a tight range near its $75 all-time high, extended from its prior base. Prior chart highs in the $67 area are an important support level to watch on pullbacks.
>>> The latest Featured Stock Update with an annotated graph appeared on 1/6/2010. click here.
|
|
C
A
S
I |
News |
Chart |
SEC
View all notes Alert
me of new notes
Company
Profile
|
CTRP
- NASDAQ
Ctrip.com Intl Ltd Adr
LEISURE - Resorts & Casinos
|
$72.78
|
-0.33
|
909,340
83% DAV
1,095,500
|
12/1/2009
(Date
Featured) |
$75.38
(Price
Featured) |
PP = $73.91 |
Y |
| MB = $77.61 |
Most Recent Note - 1/8/2010 5:50:29 PM
Y - Consolidating just above its 50 DMA line in an orderly fashion for about 5 weeks. Gains above the pivot with at least +50% above average volume are needed to trigger a fresh technical buy signal. Featured on 12/01/09 in yellow in the mid-day report (read here). Fundamentally, its sales revenues and earnings increases have shown acceleration in the 3 most recent quarterly comparisons and rose above the +25% guideline. Based on weak technical action it was dropped from the Featured Stocks list on 6/10/08, when it closed at $49.84, yet it has rebounded very impressively from subsequent lows in the $16 area.
>>> The latest Featured Stock Update with an annotated graph appeared on 12/30/2009. click here.
|
|
C
A
S
I |
News |
Chart |
SEC
View all notes Alert
me of new notes
Company
Profile
|
GMCR
- NASDAQ
Green Mtn Coffee Roastrs
FOOD & BEVERAGE - Processed & Packaged Goods
|
$81.85
|
+0.27
|
1,244,092
78% DAV
1,588,800
|
12/28/2009
(Date
Featured) |
$77.49
(Price
Featured) |
PP = $76.50 |
G |
| MB = $80.33 |
Most Recent Note - 1/8/2010 5:51:30 PM
G - Consolidating near all-time highs above its "max buy" level. Prior chart highs in the $76-77 area are important support levels to watch now.
>>> The latest Featured Stock Update with an annotated graph appeared on 12/28/2009. click here.
|
|
C
A
S
I |
News |
Chart |
SEC
View all notes Alert
me of new notes
Company
Profile
|
HEAT
-
|
$17.15
|
+0.46
|
765,573
71% DAV
1,083,600
|
1/6/2010
(Date
Featured) |
$17.19
(Price
Featured) |
PP = $17.27 |
Y |
| MB = $18.13 |
Most Recent Note - 1/8/2010 5:53:13 PM
Y - Gain today on light volume for a new high close, closing just below its pivot point. Color code was changed to yellow and a new pivot point was cited after it formed a short "ascending base" type pattern. A gain above its new pivot point with heavy volume could confirm a new technical buy signal. Recent chart lows near $14 define an important support level now. HEAT traded as much as +45.9% higher since first featured in yellow in the 11/17/09 mid-day report (read here) when technically rising from a "double bottom" base, reaching a new all-time high.
>>> The latest Featured Stock Update with an annotated graph appeared on 12/31/2009. click here.
|
|
C
A
S
I |
News |
Chart |
SEC
View all notes Alert
me of new notes
Company
Profile
|
LFT
-
|
$40.17
|
+1.21
|
555,793
137% DAV
407,100
|
11/17/2009
(Date
Featured) |
$31.77
(Price
Featured) |
PP = $33.04 |
G |
| MB = $34.69 |
Most Recent Note - 1/8/2010 5:54:50 PM
G - Gain today with slightly above average volume for a new all-time high. Extended from a sound buy point after recently rising from a choppy 14-week base. Its 50 DMA line is an initial support level to watch. A proposed offering of additional shares on 11/16/09 seems well received by the market. Its fundamentals remain strong.
>>> The latest Featured Stock Update with an annotated graph appeared on 1/5/2010. click here.
|
|
C
A
S
I |
News |
Chart |
SEC
View all notes Alert
me of new notes
Company
Profile
|
PEGA
- NASDAQ
Pegasystems Inc
COMPUTER SOFTWARE & SERVICES - Business Software & Services
|
$33.21
|
-0.21
|
129,873
52% DAV
251,200
|
1/4/2010
(Date
Featured) |
$34.00
(Price
Featured) |
PP = $36.19 |
G |
| MB = $38.00 |
Most Recent Note - 1/8/2010 6:00:36 PM
G - Small loss today on light volume was its 7th loss in 8 sessions. Color code is changed to green based on weak action, as it may continue basing and go through a deeper consolidation. Gains above prior highs in the $35-36 area are needed to help its outlook. Returned to the Featured Stocks page again with its fresh appearance in the January 2010 issue of CANSLIM.net News (read here).
>>> The latest Featured Stock Update with an annotated graph appeared on 1/3/2010. click here.
|
|
C
A
S
I |
News |
Chart |
SEC
View all notes Alert
me of new notes
Company
Profile
|
VIT
-
|
$20.61
|
+0.54
|
387,765
70% DAV
556,400
|
12/24/2009
(Date
Featured) |
$20.07
(Price
Featured) |
PP = $21.17 |
Y |
| MB = $22.23 |
Most Recent Note - 1/8/2010 6:02:05 PM
Y - Gain today on light volume. It abruptly reversed and closed the prior session with a loss, which was a sign of distributional pressure as it tried to rally from a choppy 11-week base. Featured in yellow in the 12/24/09 mid-day report (read here). No overhead supply exists to act as resistance. Fundamentally, this high-ranked Computer - Tech Services firm's earnings and sales revenues increases have been above or at the +25% minimum guideline.
>>> The latest Featured Stock Update with an annotated graph appeared on 12/24/2009. click here.
|
|
C
A
S
I |
News |
Chart |
SEC
View all notes Alert
me of new notes
Company
Profile
|
|
|
|
THESE ARE NOT BUY RECOMMENDATIONS!
Comments contained in the body of this report are technical
opinions only. The material herein has been obtained
from sources believed to be reliable and accurate, however,
its accuracy and completeness cannot be guaranteed.
This site is not an investment advisor, hence it does
not endorse or recommend any securities or other investments.
Any recommendation contained in this report may not
be suitable for all investors and it is not to be deemed
an offer or solicitation on our part with respect to
the purchase or sale of any securities. All trademarks,
service marks and trade names appearing in this report
are the property of their respective owners, and are
likewise used for identification purposes only.
This report is a service available
only to active Paid Premium Members.
You may opt-out of receiving report notifications
at any time. Questions or comments may be submitted
by writing to Premium Membership Services 665 S.E. 10 Street, Suite 201 Deerfield Beach, FL 33441-5634 or by calling 1-800-965-8307
or 954-785-1121.
|
|
|


