You are not logged in.
This means you
CAN ONLY VIEW reports that were published prior to Monday, March 24, 2025.
You
MUST UPGRADE YOUR MEMBERSHIP if you want to see any current reports.
AFTER MARKET UPDATE - MONDAY, JANUARY 6TH, 2014
Previous After Market Report Next After Market Report >>>
|
|
|
|
DOW |
-44.89 |
16,425.10 |
-0.27% |
|
Volume |
656,200,530 |
+23% |
|
Volume |
2,139,266,240 |
+36% |
|
NASDAQ |
-18.23 |
4,113.68 |
-0.44% |
|
Advancers |
1,404 |
45% |
|
Advancers |
945 |
35% |
|
S&P 500 |
-4.60 |
1,826.77 |
-0.25% |
|
Decliners |
1,640 |
53% |
|
Decliners |
1,642 |
62% |
|
Russell 2000 |
-8.93 |
1,147.16 |
-0.77% |
|
52 Wk Highs |
135 |
|
|
52 Wk Highs |
131 |
|
|
S&P 600 |
-5.67 |
654.39 |
-0.86% |
|
52 Wk Lows |
13 |
|
|
52 Wk Lows |
15 |
|
|
 |
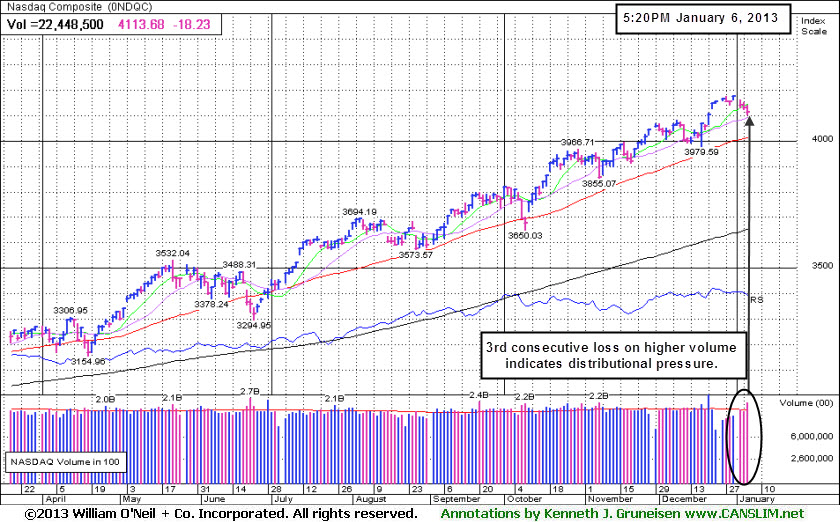
Major Averages Fell With High Volume Totals
Kenneth J. Gruneisen - Passed the CAN SLIM® Master's Exam
The major averages finished with losses on the session Monday. The volume totals were reported higher than the prior trading session's volume totals on the NYSE and on the Nasdaq exchange, indicating an increase in distributional pressure or selling coming from the institutional crowd. Breadth was negative as decliners led advancers by an 8-7 margin on the NYSE and a 3-2 margin on the Nasdaq exchange. There were 44 high-ranked companies from the CANSLIM.net Leaders List that made new 52-week highs and appeared on the CANSLIM.net BreakOuts Page, up from a total of 39 stocks on the prior session. The list of stocks hitting new 52-week highs outnumbered new lows on the Nasdaq exchange and on the NYSE. There were gains for 7 of the 20 high-ranked companies currently included on the Featured Stocks Page.
 Stocks were choppy throughout the session as investors digested a batch of mixed economic reports. Looking at the data, factory orders increased +1.8% in November, but the December reading on the ISM non-manufacturing index fell short of estimates.
Sector action on the S&P was mixed. Financial stocks showed some strength with Bank of America (BAC +1.52%) rising. Shares of JetBlue Airways (JBLU -4.31%) fell after the company halted flights to Boston and New York due to weather related interferences. In other news, Walgreen (WAG +0.55%) edged higher as the company reported better-than-expected December sales.
Turning to fixed income markets, Treasuries were higher along the curve. The benchmark 10-year note was up 1/4 of a point to yield 2.97% and the 30-year bond added 3/8 of a point to yield 3.90%.
The Market (M criteria) rally has continued producing sufficient leadership (stocks hitting new highs) and the ongoing uptrend remains intact. New buying efforts should always be selective. The CANSLIM.net Featured Stocks Page shows the most action-worthy candidates and their latest notes and a Headline Link directs members to the latest detailed analysis with data-packed graphs annotated by a Certified expert along with links to additional resources. The Premium Member Homepage includes "dynamic archives" to all prior pay reports published. Watch for an announcement via email concerning the next WEBCAST.
PICTURED: The Nasdaq Composite Index suffered its 3rd consecutive loss on Monday as it slumped on higher volume indicative of distributional pressure.
|
 Kenneth J. Gruneisen started out as a licensed stockbroker in August 1987, a couple of months prior to the historic stock market crash that took the Dow Jones Industrial Average down -22.6% in a single day. He has published daily fact-based fundamental and technical analysis on high-ranked stocks online for two decades. Through FACTBASEDINVESTING.COM, Kenneth provides educational articles, news, market commentary, and other information regarding proven investment systems that work in good times and bad.
Comments contained in the body of this report are technical opinions only and are not necessarily those of Gruneisen Growth Corp. The material herein has been obtained from sources believed to be reliable and accurate, however, its accuracy and completeness cannot be guaranteed. Our firm, employees, and customers may effect transactions, including transactions contrary to any recommendation herein, or have positions in the securities mentioned herein or options with respect thereto. Any recommendation contained in this report may not be suitable for all investors and it is not to be deemed an offer or solicitation on our part with respect to the purchase or sale of any securities. |
|
 |
Tech Indexes and Retail Index Lost Ground
Kenneth J. Gruneisen - Passed the CAN SLIM® Master's Exam
Financial shares were mixed as the Bank Index ($BKX +0.35%) eked out a gain while the Broker/Dealer Index ($XBD -0.36%) edged lower. The Retail Index ($RLX -0.83%) also was a negative influence and the tech sector was weak as the Semiconductor Index ($SOX -0.55%), Networking Index ($NWX -0.45%), and the Biotechnology Index ($BTK -0.36%) collectively edged lower. The Oil Services Index ($OSX -0.52%) lost ground while the Integrated Oil Index ($XOI +0.08%) finished flat. The Gold & Silver Index ($XAU +0.38%) posted a small gain.
Charts courtesy www.stockcharts.com
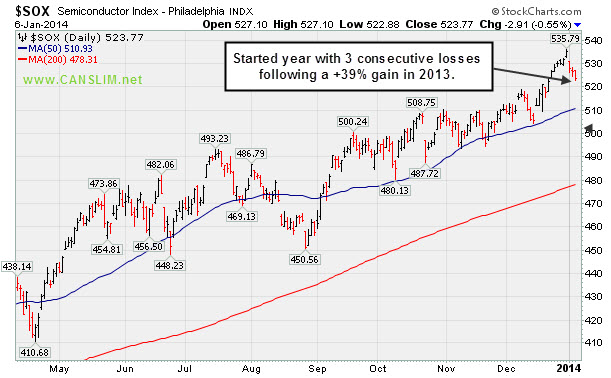
PICTURED: The Semiconductor Index ($SOX -0.55%) started the year with 3 consecutive losses following a rally of +39.31% in 2013.
| Oil Services |
$OSX |
275.17 |
-1.45 |
-0.52% |
-2.09% |
| Integrated Oil |
$XOI |
1,480.44 |
+1.15 |
+0.08% |
-1.51% |
| Semiconductor |
$SOX |
523.77 |
-2.91 |
-0.55% |
-2.10% |
| Networking |
$NWX |
320.92 |
-1.45 |
-0.45% |
-0.93% |
| Broker/Dealer |
$XBD |
160.32 |
-0.59 |
-0.36% |
-0.15% |
| Retail |
$RLX |
927.00 |
-7.76 |
-0.83% |
-1.36% |
| Gold & Silver |
$XAU |
86.96 |
+0.33 |
+0.38% |
+3.34% |
| Bank |
$BKX |
69.71 |
+0.24 |
+0.35% |
+0.65% |
| Biotech |
$BTK |
2,322.12 |
-8.42 |
-0.36% |
-0.36% |
|
|
|
 |
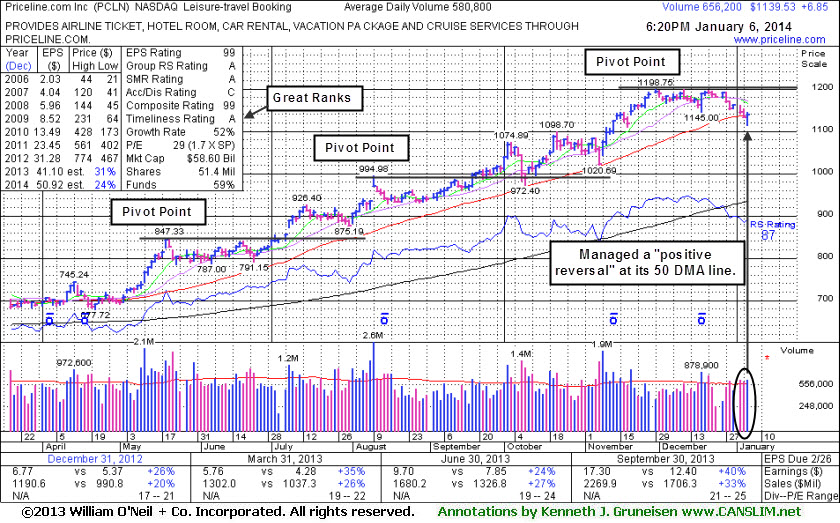
Managed Positive Reversal at 50-Day Moving Average Line
Kenneth J. Gruneisen - Passed the CAN SLIM® Master's Exam
Priceline.com Inc. (PCLN +$6.85 or +0.60% to $1,139.53) managed a positive reversal today, finding support at its 50-day moving average (DMA) line. A subsequent violation of the session's low ($1,113.01) would raise greater concerns and may trigger a more worrisome technical sell signal. Volume-driven gains above the pivot point have not shown up since recently highlighted. Disciplined investors watch for a proper technical buy signal before taking action and always limit losses if any stock falls more than -7% from their buy point.
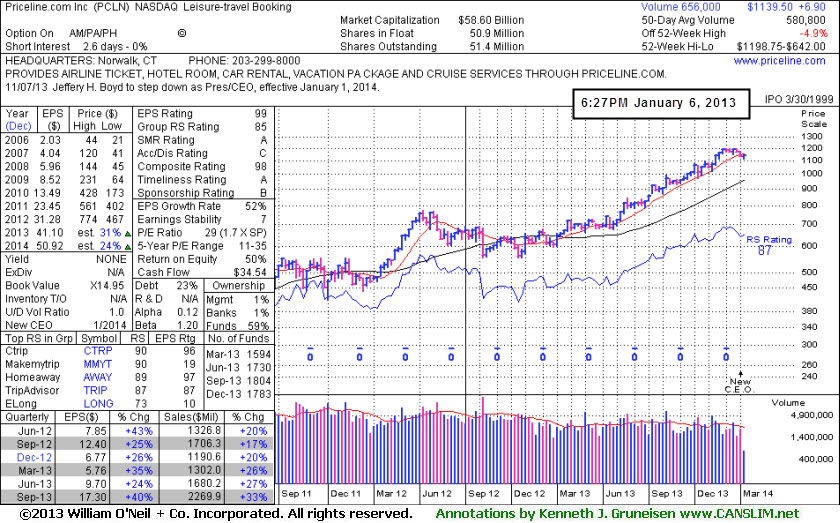
PCLN reported earnings +40% on +33% sales revenues for the Sep '13 quarter versus the year-ago period, above the +25% minimum earnings guideline (C criteria) and improving after a slightly sub par Jun '13 report. The Leisure - Travel Booking firm has earned great ranks, including the highest possible rating of 99 for earnings Per Share (EPS). Its strong annual earnings history satisfies the A criteria.
Keep in mind, the investment system's biggest winning models were typically held by at least a few mutual funds and attracting many others. However, once a stock is very heavily owned by a long list of mutual funds, as is now the case with PCLN, investors should be especially cautious and alert for any technical sell signals or fundamental disappointments which could prompt a rush for the exits. The number of top-rated funds owning its shares rose from 1,594 in Mar '13 to 1,783 in Dec '13, and increasing interest is an encouraging sign concerning the I criteria.
|
|
|
Color Codes Explained :
Y - Better candidates highlighted by our
staff of experts.
G - Previously featured
in past reports as yellow but may no longer be buyable under the
guidelines.
***Last / Change / Volume data in this table is the closing quote data***
Symbol/Exchange
Company Name
Industry Group |
PRICE |
CHANGE
(%Change) |
Day High |
Volume
(% DAV)
(% 50 day avg vol) |
52 Wk Hi
% From Hi |
Featured
Date |
Price
Featured |
Pivot Featured |
|
Max Buy |
ARMH
-
NASDAQ
A R M Holdings Plc Ads
ELECTRONICS - Semiconductor - Specialized
|
$53.30
|
-0.25
-0.47% |
$53.80
|
1,082,556
66.41% of 50 DAV
50 DAV is 1,630,000
|
$55.26
-3.55%
|
12/23/2013
|
$54.59
|
PP = $52.48
|
|
MB = $55.10
|
 Most Recent Note - 1/6/2014 7:03:43 PM
Y - Pulled back today for a 3rd consecutive loss. Prior highs near $52 define initial support to watch on pullbacks. Disciplined investors avoid chasing stocks more than +5% above prior highs and alway limit losses by selling any stock that falls more than -7% from their purchase price.
>>> FEATURED STOCK ARTICLE : No Overhead Supply Remains Following Volume-Driven Breakout - 12/23/2013
View all notes |
Set NEW NOTE alert |
CANSLIM.net Company Profile |
SEC
News |
Chart |
Request a new note
C
A N
S L
I M


|
CELG
-
NASDAQ
Celgene Corp
DRUGS - Drug Manufacturers - Major
|
$162.62
|
-7.19
-4.23% |
$166.85
|
4,620,807
173.28% of 50 DAV
50 DAV is 2,666,700
|
$173.80
-6.43%
|
9/12/2013
|
$149.50
|
PP = $150.02
|
|
MB = $157.52
|
Most Recent Note - 1/6/2014 11:59:02 AM
G - Gapped down today, retreating from its 52-week high with higher volume, slumping near its 50 DMA line which acted as support recently. Subsequent violations would raise greater concerns and trigger technical sell signals.
>>> FEATURED STOCK ARTICLE : Cooling Volume Totals While Hovering Near Highs - 12/4/2013
View all notes |
Set NEW NOTE alert |
CANSLIM.net Company Profile |
SEC
News |
Chart |
Request a new note
C
A N
S L
I M
|
EGOV
-
NASDAQ
N I C Inc
INTERNET - Internet Software and Services
|
$23.29
|
-0.21
-0.89% |
$24.22
|
483,940
176.88% of 50 DAV
50 DAV is 273,600
|
$25.99
-10.39%
|
12/20/2013
|
$24.00
|
PP = $26.09
|
|
MB = $27.39
|
Most Recent Note - 1/6/2014 6:55:54 PM
G - Color code is changed to green after slumping below its 50 DMA line with above average volume behind today's loss. Recent low ($22.17 on 12/16/13) defines near-term support above its 200 DMA line.
>>> FEATURED STOCK ARTICLE : Rebounded Above 50-Day Average; Relative Strength Rating Waned - 12/27/2013
View all notes |
Set NEW NOTE alert |
CANSLIM.net Company Profile |
SEC
News |
Chart |
Request a new note
C
A N
S L
I M
|
EQM
-
NYSE
E Q T Midstream Partners
ENERGY - Oil and Gas Pipelines
|
$59.69
|
+0.53
0.90% |
$60.18
|
295,035
231.22% of 50 DAV
50 DAV is 127,600
|
$60.15
-0.76%
|
12/12/2013
|
$53.17
|
PP = $56.51
|
|
MB = $59.34
|
Most Recent Note - 1/6/2014 6:58:06 PM
G - Hit a new all-time high with today's gain above the pivot point backed by +130% above average volume triggering a technical buy signal. Color code is changed to green as it is getting extended beyond its "max buy" level.
>>> FEATURED STOCK ARTICLE : Finding Support Near 50-Day Moving Average While Perched Near Highs - 12/13/2013
View all notes |
Set NEW NOTE alert |
CANSLIM.net Company Profile |
SEC
News |
Chart |
Request a new note
C
A N
S L
I M
|
FB
-
NASDAQ
Facebook Inc Cl A
INTERNET
|
$57.20
|
+2.64
4.84% |
$57.26
|
68,911,246
94.22% of 50 DAV
50 DAV is 73,142,100
|
$58.58
-2.36%
|
12/12/2013
|
$51.40
|
PP = $54.93
|
|
MB = $57.68
|
Most Recent Note - 1/6/2014 6:54:09 PM
Y - Rallied near a best-ever close with today's gain on average volume. Found support near prior highs during its consolidation. Rallied from a 9-week cup shaped base without a handle after completing a Public Offering on 12/20/13. Disciplined investors always limit losses by selling any stock that falls more than -7% from their purchase price.
>>> FEATURED STOCK ARTICLE : Well Known Social Media Firm on Watch List While Still Base Building - 12/12/2013
View all notes |
Set NEW NOTE alert |
CANSLIM.net Company Profile |
SEC
News |
Chart |
Request a new note
C
A N
S L
I M
|
Symbol/Exchange
Company Name
Industry Group |
PRICE |
CHANGE
(%Change) |
Day High |
Volume
(% DAV)
(% 50 day avg vol) |
52 Wk Hi
% From Hi |
Featured
Date |
Price
Featured |
Pivot Featured |
|
Max Buy |
FLT
-
NYSE
Fleetcor Technologies
DIVERSIFIED SERVICES - Business/Management Services
|
$116.11
|
-0.51
-0.44% |
$116.99
|
519,674
64.64% of 50 DAV
50 DAV is 803,900
|
$123.96
-6.33%
|
8/19/2013
|
$99.01
|
PP = $100.97
|
|
MB = $106.02
|
Most Recent Note - 1/2/2014 12:35:38 PM
G - Consolidating near its 50 DMA line with today's gain on higher volume. Previously noted - "It may be forming a new late-stage base but still faces some resistance up through the $123 level."
>>> FEATURED STOCK ARTICLE : Enduring Distributional Pressure While Extended From Sound Base - 12/17/2013
View all notes |
Set NEW NOTE alert |
CANSLIM.net Company Profile |
SEC
News |
Chart |
Request a new note
C
A N
S L
I M
|
GNRC
-
NYSE
Generac Hldgs Inc
CONSUMER DURABLES - Electronic Equipment
|
$55.76
|
-0.99
-1.74% |
$57.29
|
620,668
82.81% of 50 DAV
50 DAV is 749,500
|
$57.27
-2.64%
|
11/26/2013
|
$53.02
|
PP = $52.42
|
|
MB = $55.04
|
Most Recent Note - 1/2/2014 6:32:49 PM
G - Holding its ground stubbornly near its all-time high. Prior highs in the $52 area define initial support to watch on pullbacks. See the latest FSU analysis for more details and new annotated daily and weekly graphs.
>>> FEATURED STOCK ARTICLE : Volume Totals Cooling While Holding Ground Near Highs - 1/2/2014
View all notes |
Set NEW NOTE alert |
CANSLIM.net Company Profile |
SEC
News |
Chart |
Request a new note
C
A N
S L
I M
|
HLF
-
NYSE
Herbalife Ltd
DRUGS - Nutrition and Weight Management
|
$77.34
|
+0.25
0.32% |
$77.88
|
1,889,110
68.08% of 50 DAV
50 DAV is 2,774,700
|
$81.75
-5.39%
|
11/22/2013
|
$72.21
|
PP = $75.04
|
|
MB = $78.79
|
Most Recent Note - 1/3/2014 12:35:15 PM
Y - Pulling back on higher volume today, a sign of distributional pressure. Prior highs in the $74 area define initial support to watch. Disciplined investors always limit losses if any stock falls more than -7% from their purchase price.
>>> FEATURED STOCK ARTICLE : Volume Totals Cooling While Perched Near Highs - 12/30/2013
View all notes |
Set NEW NOTE alert |
CANSLIM.net Company Profile |
SEC
News |
Chart |
Request a new note
C
A N
S L
I M
|
JAZZ
-
NASDAQ
Jazz Pharmaceuticals Plc
DRUGS - Biotechnology
|
$125.51
|
-0.84
-0.66% |
$127.62
|
792,727
112.08% of 50 DAV
50 DAV is 707,300
|
$128.49
-2.32%
|
9/30/2013
|
$93.20
|
PP = $89.10
|
|
MB = $93.56
|
Most Recent Note - 1/2/2014 1:16:14 PM
G - Still hovering at its 52-week high, stubbornly holding its ground with volume totals cooling. Heavy volume was behind considerable gains on 12/20/13 news it will buy Gentium Spa (GENT) for $1 Billion.
>>> FEATURED STOCK ARTICLE : Technically Extended Stock May Be a Dangerous Chase - 12/10/2013
View all notes |
Set NEW NOTE alert |
CANSLIM.net Company Profile |
SEC
News |
Chart |
Request a new note
C
A N
S L
I M
|
KORS
-
NYSE
Michael Kors Hldgs Ltd
RETAIL - Apparel Stores
|
$82.04
|
-0.47
-0.57% |
$83.00
|
1,790,268
38.58% of 50 DAV
50 DAV is 4,640,000
|
$84.58
-3.00%
|
8/6/2013
|
$69.66
|
PP = $66.28
|
|
MB = $69.59
|
Most Recent Note - 1/6/2014 7:04:43 PM
G - Consolidating above support at its 50 DMA line after recent distributional pressure. Did not form a new base of sufficient length.
>>> FEATURED STOCK ARTICLE : Consolidation Too Brief To Note New Pivot - 12/6/2013
View all notes |
Set NEW NOTE alert |
CANSLIM.net Company Profile |
SEC
News |
Chart |
Request a new note
C
A N
S L
I M
|
Symbol/Exchange
Company Name
Industry Group |
PRICE |
CHANGE
(%Change) |
Day High |
Volume
(% DAV)
(% 50 day avg vol) |
52 Wk Hi
% From Hi |
Featured
Date |
Price
Featured |
Pivot Featured |
|
Max Buy |
MRLN
-
NASDAQ
Marlin Business Services
DIVERSIFIED SERVICES - Rental and Leasing Services
|
$26.45
|
+0.08
0.30% |
$26.97
|
29,784
108.70% of 50 DAV
50 DAV is 27,400
|
$28.64
-7.64%
|
12/19/2013
|
$26.69
|
PP = $28.74
|
|
MB = $30.18
|
Most Recent Note - 1/6/2014 7:06:26 PM
Y - Color code is changed to yellow while consolidating above its 50 DMA line. Its Relative Strength (RS) Rating at 76 remains below the 80+ minimum guideline for buy candidates. Subsequent volume-driven gains above the pivot point are needed to trigger a proper new technical buy signal.
>>> FEATURED STOCK ARTICLE : Finished Weak While Enduring Distributional Pressure - 12/19/2013
View all notes |
Set NEW NOTE alert |
CANSLIM.net Company Profile |
SEC
News |
Chart |
Request a new note
C
A N
S L
I M
|
PCLN
-
NASDAQ
Priceline.Com Inc
INTERNET - Internet Software and Services
|
$1,139.53
|
+6.85
0.60% |
$1,144.44
|
656,612
113.05% of 50 DAV
50 DAV is 580,800
|
$1,198.75
-4.94%
|
12/18/2013
|
$1,156.20
|
PP = $1,198.85
|
|
MB = $1,258.79
|
Most Recent Note - 1/6/2014 6:48:03 PM
Y - Managed a "positive reversal" today after undercutting its 50 DMA line. See the latest FSU analysis for more details and new annotated daily and weekly graphs.
>>> FEATURED STOCK ARTICLE : Managed Positive Reversal at 50-Day Moving Average Line - 1/6/2014
View all notes |
Set NEW NOTE alert |
CANSLIM.net Company Profile |
SEC
News |
Chart |
Request a new note
C
A N
S L
I M
|
SFUN
-
NYSE
Soufun Hldgs Ltd Ads A
INTERNET - Internet Information Providers
|
$83.98
|
+1.65
2.00% |
$85.31
|
855,196
68.43% of 50 DAV
50 DAV is 1,249,800
|
$84.44
-0.54%
|
10/17/2013
|
$58.02
|
PP = $53.87
|
|
MB = $56.56
|
Most Recent Note - 1/6/2014 6:49:47 PM
G - Hit a new all-time high today with a gain on light volume. Held its ground stubbornly and wedged higher with gains lacking great volume conviction since noted in prior reports with caution - "It is extended from any sound base pattern yet may produce more climactic gains. Prior highs and its 50 DMA line coincide in the $59 area defining important support to watch."
>>> FEATURED STOCK ARTICLE : Extended From Base Yet May Produce More Climactic Gains - 12/9/2013
View all notes |
Set NEW NOTE alert |
CANSLIM.net Company Profile |
SEC
News |
Chart |
Request a new note
C
A N
S L
I M
|
SILC
-
NASDAQ
Silicom Ltd
COMPUTER HARDWARE - Networking andamp; Communication Dev
|
$45.40
|
+0.00
0.00% |
$45.66
|
21,318
60.05% of 50 DAV
50 DAV is 35,500
|
$46.23
-1.80%
|
12/23/2013
|
$44.62
|
PP = $46.25
|
|
MB = $48.56
|
Most Recent Note - 1/2/2014 1:03:09 PM
Y - Challenging its pivot point and hitting a new 52-week high today while on track for a 12th consecutive gain without great volume conviction. Volume should be a minimum of +40% above average behind gains above a stock's pivot point to trigger a proper technical buy signal.
>>> FEATURED STOCK ARTICLE : Stock With Small Supply Has Formed a Sound Base Pattern - 12/24/2013
View all notes |
Set NEW NOTE alert |
CANSLIM.net Company Profile |
SEC
News |
Chart |
Request a new note
C
A N
S L
I M
|
SSNC
-
NASDAQ
S S & C Technologies
COMPUTER SOFTWARE and SERVICES - Application Software
|
$44.90
|
-0.19
-0.42% |
$45.55
|
362,833
125.85% of 50 DAV
50 DAV is 288,300
|
$45.26
-0.80%
|
10/22/2013
|
$39.17
|
PP = $40.04
|
|
MB = $42.04
|
Most Recent Note - 1/6/2014 7:08:33 PM
G - Paused today after a streak of 9 consecutive gains, extended from any sound base. Found recent support near its 50 DMA line.
>>> FEATURED STOCK ARTICLE : Found Prompt Support After Damaging Losses Raised Concerns - 12/16/2013
View all notes |
Set NEW NOTE alert |
CANSLIM.net Company Profile |
SEC
News |
Chart |
Request a new note
C
A N
S L
I M
|
Symbol/Exchange
Company Name
Industry Group |
PRICE |
CHANGE
(%Change) |
Day High |
Volume
(% DAV)
(% 50 day avg vol) |
52 Wk Hi
% From Hi |
Featured
Date |
Price
Featured |
Pivot Featured |
|
Max Buy |
SSYS
-
NASDAQ
Stratasys Ltd
COMPUTER HARDWARE - Computer Peripherals
|
$127.98
|
-8.48
-6.21% |
$136.53
|
1,843,363
166.07% of 50 DAV
50 DAV is 1,110,000
|
$138.10
-7.33%
|
10/11/2013
|
$102.94
|
PP = $105.38
|
|
MB = $110.65
|
Most Recent Note - 1/6/2014 12:25:38 PM
G - Retreating from its 52-week high with today's loss on higher volume indicating distributional pressure after rising without great volume conviction behind recent gains. Found recent support at its 50 DMA line. Previously noted with caution - "Reported earnings +13% on +153% sales revenues, below the +25% minimum earnings guideline (C criteria) raising fundamental concerns."
>>> FEATURED STOCK ARTICLE : Rallying From Support at 50-Day Moving Average Line - 12/20/2013
View all notes |
Set NEW NOTE alert |
CANSLIM.net Company Profile |
SEC
News |
Chart |
Request a new note
C
A N
S L
I M
|
ULTI
-
NASDAQ
Ultimate Software Group
INTERNET - Internet Software and Services
|
$151.61
|
-0.27
-0.18% |
$153.10
|
103,333
73.49% of 50 DAV
50 DAV is 140,600
|
$162.88
-6.92%
|
10/16/2013
|
$142.95
|
PP = $151.18
|
|
MB = $158.74
|
Most Recent Note - 1/2/2014 1:28:49 PM
G - Its Relative Strength (RS) Rating has slumped to 80, the minimum rank for buy candidates. Consolidating near its 50 DMA line. The recent low ($144.04 on 12/12/13) define the next near-term support to watch.
>>> FEATURED STOCK ARTICLE : Gain on Light Volume While Inching Above 50-Day Average - 12/26/2013
View all notes |
Set NEW NOTE alert |
CANSLIM.net Company Profile |
SEC
News |
Chart |
Request a new note
C
A N
S L
I M
|
VRX
-
NYSE
Valeant Pharmaceuticals
DRUGS - Drug Manufacturers - Other
|
$112.62
|
-4.54
-3.88% |
$117.57
|
2,402,894
220.35% of 50 DAV
50 DAV is 1,090,500
|
$118.25
-4.76%
|
9/11/2013
|
$100.26
|
PP = $105.50
|
|
MB = $110.78
|
Most Recent Note - 1/6/2014 6:51:54 PM
G - Retreated from its 52-week high today with heavy volume indicative of distributional pressure. Its 50 DMA line and prior lows ($105.17) define near term support to watch.
>>> FEATURED STOCK ARTICLE : Rebounding With Volume Backed Gains But Fundamental Concerns Remain - 12/18/2013
View all notes |
Set NEW NOTE alert |
CANSLIM.net Company Profile |
SEC
News |
Chart |
Request a new note
C
A N
S L
I M
|
YNDX
-
NASDAQ
Yandex N V Class A
INTERNET - Internet Information Providers
|
$42.91
|
+0.01
0.02% |
$43.19
|
1,809,898
74.37% of 50 DAV
50 DAV is 2,433,800
|
$43.65
-1.70%
|
11/27/2013
|
$39.61
|
PP = $42.10
|
|
MB = $44.21
|
Most Recent Note - 1/6/2014 7:11:17 PM
Y - Hovering in a tight range, holding its ground near its 52-week high while volume has been light behind recent gains. At least +40% above average volume should be behind gains above the pivot point to trigger a proper new technical buy signal.
>>> FEATURED STOCK ARTICLE : Best Ever Close With Gain on Light Volume - 12/31/2013
View all notes |
Set NEW NOTE alert |
CANSLIM.net Company Profile |
SEC
News |
Chart |
Request a new note
C
A N
S L
I M
|
YY
-
NASDAQ
YY Inc Ads
INTERNET - Internet Service Providers
|
$57.34
|
-0.68
-1.17% |
$58.48
|
2,492,804
162.39% of 50 DAV
50 DAV is 1,535,100
|
$58.35
-1.73%
|
1/3/2014
|
$55.08
|
PP = $56.85
|
|
MB = $59.69
|
Most Recent Note - 1/6/2014 12:30:11 PM
Y - Holding its ground today near its all-time high. Finished strong after highlighted in yellow in the 1/03/14 mid-day report (read here) with pivot point cited based on its 11/18/13 high plus 10 cents after a riskier "late stage" base. The gain above the pivot point triggered a convincing technical buy signal with +258% above average volume. See the latest FSU analysis for an annotated weekly graph and additional details.

>>> FEATURED STOCK ARTICLE : Finished Strong With High Volume After Featured in Mid-Day Report - 1/3/2014
View all notes |
Set NEW NOTE alert |
CANSLIM.net Company Profile |
SEC
News |
Chart |
Request a new note
C
A N
S L
I M
|
Symbol/Exchange
Company Name
Industry Group |
PRICE |
CHANGE
(%Change) |
Day High |
Volume
(% DAV)
(% 50 day avg vol) |
52 Wk Hi
% From Hi |
Featured
Date |
Price
Featured |
Pivot Featured |
|
Max Buy |
|
|
|
THESE ARE NOT BUY RECOMMENDATIONS!
Comments contained in the body of this report are technical
opinions only. The material herein has been obtained
from sources believed to be reliable and accurate, however,
its accuracy and completeness cannot be guaranteed.
This site is not an investment advisor, hence it does
not endorse or recommend any securities or other investments.
Any recommendation contained in this report may not
be suitable for all investors and it is not to be deemed
an offer or solicitation on our part with respect to
the purchase or sale of any securities. All trademarks,
service marks and trade names appearing in this report
are the property of their respective owners, and are
likewise used for identification purposes only.
This report is a service available
only to active Paid Premium Members.
You may opt-out of receiving report notifications
at any time. Questions or comments may be submitted
by writing to Premium Membership Services 665 S.E. 10 Street, Suite 201 Deerfield Beach, FL 33441-5634 or by calling 1-800-965-8307
or 954-785-1121.
|
|
|

