You are not logged in.
This means you
CAN ONLY VIEW reports that were published prior to Monday, April 14, 2025.
You
MUST UPGRADE YOUR MEMBERSHIP if you want to see any current reports.
AFTER MARKET UPDATE - FRIDAY, JANUARY 6TH, 2012
Previous After Market Report Next After Market Report >>>
|
|
|
|
DOW |
-55.78 |
12,359.92 |
-0.45% |
|
Volume |
710,508,850 |
-14% |
|
Volume |
1,661,187,890 |
-7% |
|
NASDAQ |
+4.36 |
2,674.22 |
+0.16% |
|
Advancers |
1,396 |
45% |
|
Advancers |
1,118 |
42% |
|
S&P 500 |
-3.25 |
1,277.81 |
-0.25% |
|
Decliners |
1,613 |
52% |
|
Decliners |
1,391 |
53% |
|
Russell 2000 |
-2.58 |
749.71 |
-0.34% |
|
52 Wk Highs |
94 |
|
|
52 Wk Highs |
44 |
|
|
S&P 600 |
-1.33 |
420.18 |
-0.32% |
|
52 Wk Lows |
13 |
|
|
52 Wk Lows |
34 |
|
|
 |
Major Averages Post Gains for First Week of New Year
Kenneth J. Gruneisen - Passed the CAN SLIM® Master's Exam
For the first week of the new year the Dow Jones Industrial Average gained +1.2%, the S&P Index rose +1.6%, and the Nasdaq Composite Index added +2.7%. The three major averages are collectively trading above both their 50-day and 200-day moving average lines, respectively. Friday's volume totals were lighter than the prior session on the NYSE and on the Nasdaq exchange as the major averages finished with small losses. Breadth on the session was slightly negative as decliners led advancers by an 8-7 margin on the NYSE and on the Nasdaq exchange. New 52-week highs outnumbered new 52-week lows on the NYSE and on the Nasdaq exchange again. There were 37 high-ranked companies from the CANSLIM.net Leaders List that made new 52-week highs and appeared on the CANSLIM.net BreakOuts Page, up from the prior session total of 35 stocks. There were gains for 4 of the 16 high-ranked companies currently included on the Featured Stocks Page.
Positive news on the labor market failed to lift the market. Before the open, non-farm payrolls for December rose by 200,000 beating the consensus estimate of 155,000. The unemployment rate declined to 8.5%, the lowest jobless reading since February 2009. Financials finished lower with The Goldman Sachs Group Inc (GS -1.23%) and Morgan Stanley (MS -2.33%) declining after several analysts reduced estimates on banks dependent on trading revenues.
Aluminum maker Alcoa Inc (AA -2.14%), which kicks off earnings season as it reports earnings on Monday, dropped after saying it will cut its smelting capacity by 12%. Discount retailer Family Dollar Stores Inc(FDO -7.47%) was down on disappointing earnings results. Tech was a bright spot with Apple Inc (AAPL +1.05%) rising.
Europe closed mostly lower on Friday. The DAX finished down -0.6% in Germany and the CAC 40 closed lower by -0.2%. The FTSE ended the session higher with a +0.5% gain.
The action in leading stocks listed on the the Featured Stocks Page has brought more breakdowns than breakouts in recent weeks, raising questions about the health of the current market uptrend. Keep an eye on the number of high-ranked leaders hitting the BreakOuts Page in the days ahead to help yourself determine whether leadership is expanding again or contracting.
The market (M criteria) is currently in a confirmed uptrend, which means that disciplined investors' odds are considered favorable for accumulating shares of sound buy candidates in the days ahead. If that stance changes (M criteria) it will be noted in this daily commentary which all members should read regularly. We appreciate any feedback members may wish to send via the inquiry form here.
The Q4 2011 CANSLIM.net Webcast aired on Wednesday, December 28th at 8PM EST and is now available "ON DEMAND" to all upgraded members at no additional cost. Via the Premium Member Homepage links to all prior reports and webcasts are always available.
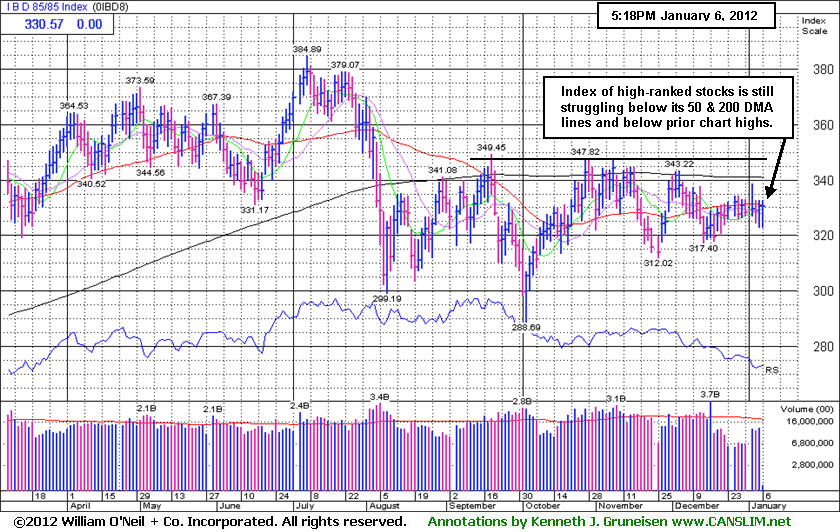
PICTURED: The IBD 85/85 Index is still struggling below its 50-day and 200-day moving average (DMA) line and below prior chart highs. If the market is capable of sustaining a meaningful rally, normally one can expect companies with the best earnings histories to participate and provide leadership. This index's recent divergence contrasts with the healthier action seen in the major averages, all of which, as noted above, are trading above their respective short-term and long-term averages. Make your disciplined buy and sell decisions carefully and on a case-by-case basis. The investment system's rules say to never hold a high-ranked stock if it falls more than -7% from your purchase price.
|
 Kenneth J. Gruneisen started out as a licensed stockbroker in August 1987, a couple of months prior to the historic stock market crash that took the Dow Jones Industrial Average down -22.6% in a single day. He has published daily fact-based fundamental and technical analysis on high-ranked stocks online for two decades. Through FACTBASEDINVESTING.COM, Kenneth provides educational articles, news, market commentary, and other information regarding proven investment systems that work in good times and bad.
Comments contained in the body of this report are technical opinions only and are not necessarily those of Gruneisen Growth Corp. The material herein has been obtained from sources believed to be reliable and accurate, however, its accuracy and completeness cannot be guaranteed. Our firm, employees, and customers may effect transactions, including transactions contrary to any recommendation herein, or have positions in the securities mentioned herein or options with respect thereto. Any recommendation contained in this report may not be suitable for all investors and it is not to be deemed an offer or solicitation on our part with respect to the purchase or sale of any securities. |
|
 |
Medical-Related Shares Led Gainers Again
Kenneth J. Gruneisen - Passed the CAN SLIM® Master's Exam
The Healthcare Index ($HMO +2.23%) and Biotechnology Index ($BTK +2.39%) were standout gainers on Friday, marking a second consecutive session with leadership shown by medical-related shares. The tech sector also had a slightly positive bias as the Internet Index ($IIX +0.16%), Semiconductor Index ($SOX +0.28%), and Networking Index ($NWX +0.67%) posted small gains. The Bank Index ($BKX -0.29%) and the Broker/Dealer Index ($XBD -0.23%) also edged lower, creating a slight drag on the major averages. Energy-related shares were mixed as the Integrated Oil Index ($XOI -0.53%) edged lower and the Oil Services Index ($OSX +0.26%) posted a small gain. The Gold & Silver Index ($XAU -0.98%) was a laggard.
Charts courtesy www.stockcharts.com
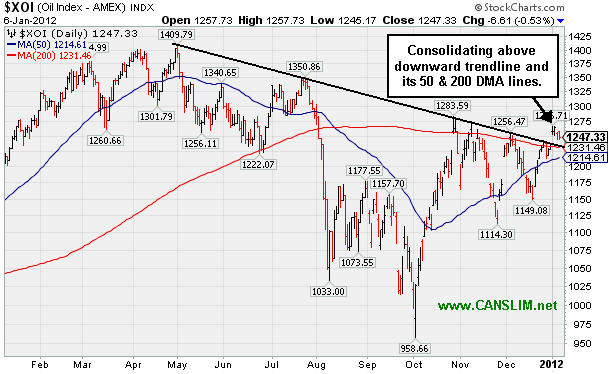
PICTURED: The Integrated Oil Index ($XOI -0.53%) is consolidating above a downward trendline and its 50-day and 200-day moving average (DMA) lines.
| Oil Services |
$OSX |
223.28 |
+0.59 |
+0.26% |
+0.32% |
| Healthcare |
$HMO |
2,419.23 |
+52.82 |
+2.23% |
+6.03% |
| Integrated Oil |
$XOI |
1,247.33 |
-6.61 |
-0.53% |
+1.48% |
| Semiconductor |
$SOX |
375.22 |
+1.05 |
+0.28% |
+2.95% |
| Networking |
$NWX |
218.04 |
+1.45 |
+0.67% |
+1.33% |
| Internet |
$IIX |
288.49 |
+0.46 |
+0.16% |
+2.39% |
| Broker/Dealer |
$XBD |
86.63 |
-0.20 |
-0.23% |
+4.03% |
| Retail |
$RLX |
533.34 |
+2.28 |
+0.43% |
+1.93% |
| Gold & Silver |
$XAU |
187.17 |
-1.85 |
-0.98% |
+3.47% |
| Bank |
$BKX |
41.59 |
-0.12 |
-0.29% |
+5.61% |
| Biotech |
$BTK |
1,162.91 |
+27.11 |
+2.39% |
+6.55% |
|
|
|
 |
Halted Slide After Streak of Losses on Higher Volume
Kenneth J. Gruneisen - Passed the CAN SLIM® Master's Exam
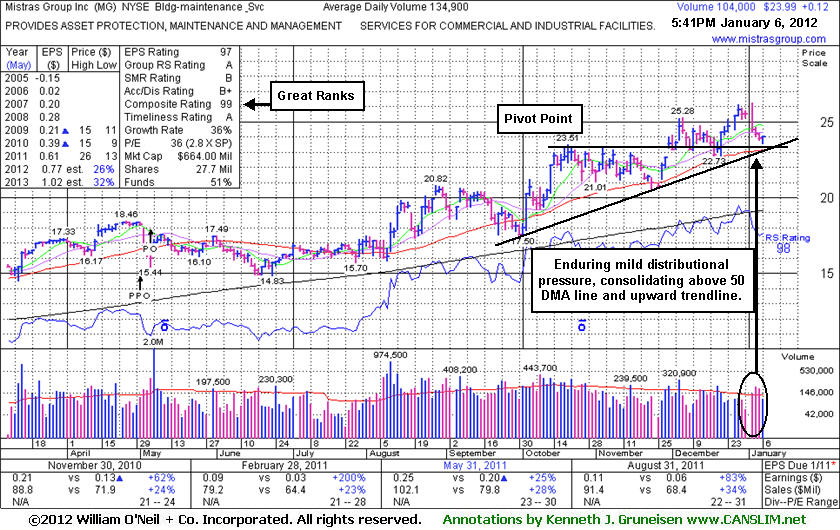
Mistras Group Inc (MG +$0.12 or +0.50% to $23.99) halted a 5-session losing streak today. It endured distributional pressure this week after a "negative reversal" on 1/03/12. The losses on high volume led to a dip back near its pivot point and prior highs in the $23 area defining chart support along with its 50-day moving average (DMA) line. Since its last appearance in this FSU section on 12/08/11 with an annotated daily graph under the headline, "Pullback On Light Volume Just Undercut Pivot Point ", it found support above its 50 DMA line and then it wedged to new highs without great volume conviction behind its gains. More damaging losses in the near-term may raise serious concerns and trigger technical sell signals.
A solid gain and strong close on 12/05/11 with +55% above average volume triggered a technical buy signal. The Building - Maintenance Services group has improved in its Group Relative Strength Rating to 86, up from 49 when it was shown in this FSU section on 11/11/11. That is a reassuring sign concerning the L criteria which calls investors to choose buy candidates with strong leadership in the industry group. It has maintained its solid earnings history concerning the C and A criteria. The number of top-rated funds owning its shares rose from 99 in Sep '10 to 157 in Sep '11, a reassuring sign concerning the I criteria. After its 5/05/11 Public Offering the company management's still large 47% ownership interest keeps them very motivated to look after and build shareholder value. The small supply (S criteria) of only 27.7 million shares outstanding and 14.7 million in the public float can contribute to greater price volatility in the event of institutional buying or selling. Disciplined investors always limit losses at 7-8% if ever a stock falls that much after purchased.
|
|
|
Color Codes Explained :
Y - Better candidates highlighted by our
staff of experts.
G - Previously featured
in past reports as yellow but may no longer be buyable under the
guidelines.
***Last / Change / Volume data in this table is the closing quote data***
Symbol/Exchange
Company Name
Industry Group |
PRICE |
CHANGE
(%Change) |
Day High |
Volume
(% DAV)
(% 50 day avg vol) |
52 Wk Hi
% From Hi |
Featured
Date |
Price
Featured |
Pivot Featured |
|
Max Buy |
ADS
-
NYSE
Alliance Data Sys Corp
COMPUTER SOFTWARE and SERVICES - Information and Delivery Service
|
$102.54
|
+0.00
0.00% |
$103.35
|
706,837
96.25% of 50 DAV
50 DAV is 734,400
|
$107.33
-4.46%
|
10/21/2011
|
$97.94
|
PP = $101.15
|
|
MB = $106.21
|
Most Recent Note - 1/5/2012 2:25:56 PM
Y - Up today, finding prompt support near its 50 DMA line after enduring distributional pressure this week. It remains perched within close striking distance of its all-time high. However, a subsequent violation of the 1/04/12 session low ($100.42) would raise greater concerns and trigger a technical sell signal.
>>> The latest Featured Stock Update with an annotated graph appeared on 12/14/2011. Click here.
View all notes |
Alert me of new notes |
CANSLIM.net Company Profile |
SEC |
Zacks Reports |
StockTalk |
News |
Chart |
Request a new note
C
A N
S L
I M


|
ALXN
-
NASDAQ
Alexion Pharmaceuticals
DRUGS - Drug Manufacturers - Other
|
$74.45
|
+2.04
2.82% |
$74.68
|
1,775,296
153.07% of 50 DAV
50 DAV is 1,159,800
|
$73.05
1.92%
|
11/30/2011
|
$68.66
|
PP = $70.52
|
|
MB = $74.05
|
 Most Recent Note - 1/6/2012 12:25:29 PM
Y - Getting near its "max buy" level today while rallying to new all-time highs with volume running at an above average for a second consecutive session. The prior gain above its pivot point had only +25% above average volume, less than the investment system guidelines call for to trigger a proper technical buy signal. Its 50 DMA line defines near-term support above prior lows in the $62 area.
>>> The latest Featured Stock Update with an annotated graph appeared on 12/12/2011. Click here.
View all notes |
Alert me of new notes |
CANSLIM.net Company Profile |
SEC |
Zacks Reports |
StockTalk |
News |
Chart |
Request a new note
C
A N
S L
I M
|
CATM
-
NASDAQ
Cardtronics Inc
DIVERSIFIED SERVICES - Business/Management Services
|
$26.09
|
-0.74
-2.76% |
$27.05
|
365,008
106.60% of 50 DAV
50 DAV is 342,400
|
$28.74
-9.22%
|
12/23/2011
|
$28.64
|
PP = $28.56
|
|
MB = $29.99
|
Most Recent Note - 1/6/2012 3:42:29 PM
G - Slumping under its 50 DMA line today with a loss raising concerns, and its color code is changed to green. Previously noted, "The gain on 12/23/11 was backed by +77% above average volume and it touched a new 52-week high, but it did not close above the new pivot point cited based on its 11/08/11 high plus 10 cents."
>>> The latest Featured Stock Update with an annotated graph appeared on 12/23/2011. Click here.
View all notes |
Alert me of new notes |
CANSLIM.net Company Profile |
SEC |
Zacks Reports |
StockTalk |
News |
Chart |
Request a new note
C
A N
S L
I M
|
CELG
-
NASDAQ
Celgene Corp
DRUGS - Drug Manufacturers - Major
|
$67.22
|
-1.29
-1.88% |
$68.45
|
5,765,843
173.82% of 50 DAV
50 DAV is 3,317,100
|
$69.26
-2.95%
|
12/20/2011
|
$66.68
|
PP = $68.35
|
|
MB = $71.77
|
Most Recent Note - 1/6/2012 12:44:04 PM
Y - Encountering mild distributional pressure while perched at its 52-week high. Volume-driven gains above the pivot point cited may trigger a new (or add-on) technical buy signal.
>>> The latest Featured Stock Update with an annotated graph appeared on 12/29/2011. Click here.
View all notes |
Alert me of new notes |
CANSLIM.net Company Profile |
SEC |
Zacks Reports |
StockTalk |
News |
Chart |
Request a new note
C
A N
S L
I M
|
FEIC
-
NASDAQ
F E I Co
ELECTRONICS - Diversified Electronics
|
$41.08
|
-0.45
-1.08% |
$41.90
|
170,620
49.34% of 50 DAV
50 DAV is 345,800
|
$43.00
-4.47%
|
12/7/2011
|
$41.41
|
PP = $42.35
|
|
MB = $44.47
|
Most Recent Note - 1/5/2012 4:34:53 PM
Y - Overcame early weakness today and managed a "positive reversal" for a gain on average volume. Still hovering near its all-time high, meanwhile, its nearby 50 DMA line defines chart support above prior lows in the $36 area. Disciplined investors would still be watching for a volume-driven gain above the pivot point to trigger a proper technical buy signal.
>>> The latest Featured Stock Update with an annotated graph appeared on 12/21/2011. Click here.
View all notes |
Alert me of new notes |
CANSLIM.net Company Profile |
SEC |
Zacks Reports |
StockTalk |
News |
Chart |
Request a new note
C
A N
S L
I M
|
Symbol/Exchange
Company Name
Industry Group |
PRICE |
CHANGE
(%Change) |
Day High |
Volume
(% DAV)
(% 50 day avg vol) |
52 Wk Hi
% From Hi |
Featured
Date |
Price
Featured |
Pivot Featured |
|
Max Buy |
GNC
-
NYSE
G N C Holdings Inc
RETAIL - Drug Stores
|
$27.54
|
-0.96
-3.37% |
$28.59
|
1,511,280
99.32% of 50 DAV
50 DAV is 1,521,700
|
$29.50
-6.64%
|
10/26/2011
|
$24.60
|
PP = $24.80
|
|
MB = $26.04
|
Most Recent Note - 1/6/2012 3:45:25 PM
G - Quietly consolidating -5.6% off its 52-week high. It is extended from its prior base pattern. Its 50 DMA line defines important support to watch above prior chart highs on pullbacks.
>>> The latest Featured Stock Update with an annotated graph appeared on 12/16/2011. Click here.
View all notes |
Alert me of new notes |
CANSLIM.net Company Profile |
SEC |
Zacks Reports |
StockTalk |
News |
Chart |
Request a new note
C
A N
S L
I M
|
HMSY
-
NASDAQ
H M S Holdings Corp
COMPUTER SOFTWARE and SERVICES - Healthcare Information Service
|
$31.21
|
+0.10
0.32% |
$31.61
|
560,838
51.92% of 50 DAV
50 DAV is 1,080,100
|
$32.83
-4.93%
|
10/27/2011
|
$26.44
|
PP = $28.37
|
|
MB = $29.79
|
Most Recent Note - 1/6/2012 5:54:08 PM
G - Hovering in a tight range near its all-time high with volume totals cooling. No resistance remains, but it is slightly extended from its prior base.
>>> The latest Featured Stock Update with an annotated graph appeared on 12/28/2011. Click here.
View all notes |
Alert me of new notes |
CANSLIM.net Company Profile |
SEC |
Zacks Reports |
StockTalk |
News |
Chart |
Request a new note
C
A N
S L
I M
|
ISRG
-
NASDAQ
Intuitive Surgical Inc
HEALTH SERVICES - Medical Appliances and Equipment
|
$460.46
|
-11.90
-2.52% |
$472.97
|
507,444
167.81% of 50 DAV
50 DAV is 302,400
|
$474.50
-2.96%
|
12/20/2011
|
$442.43
|
PP = $449.16
|
|
MB = $471.62
|
Most Recent Note - 1/6/2012 1:03:11 PM
Y - Enduring mild distributional pressure while churning near its all-time high. Previously noted, "Recent gains above its pivot point have lacked the volume needed to trigger a proper new (or add-on) technical buy signal. Important support is defined by its 50 DMA line."
>>> The latest Featured Stock Update with an annotated graph appeared on 12/13/2011. Click here.
View all notes |
Alert me of new notes |
CANSLIM.net Company Profile |
SEC |
Zacks Reports |
StockTalk |
News |
Chart |
Request a new note
C
A N
S L
I M
|
MA
-
NYSE
Mastercard Inc Cl A
DIVERSIFIED SERVICES - Business/Management Services
|
$342.92
|
-9.49
-2.69% |
$354.00
|
2,088,700
204.49% of 50 DAV
50 DAV is 1,021,400
|
$384.99
-10.93%
|
1/3/2012
|
$367.87
|
PP = $385.09
|
|
MB = $404.34
|
Most Recent Note - 1/6/2012 3:39:29 PM
G - Down for a 4th consecutive session with above average volume. Failed to attract support since violating its 50 DMA line and triggering a technical sell signal on 1/04/12 when last noted - "Another damaging loss is raising concerns, and its color code is changed to green while now encountering distributional pressure after building a riskier late-stage base. Only a prompt rebound above its short-term average would help its outlook. The 1/03/12 mid-day report (read here) cited a new pivot point based on its 52-week high plus 10 cents. Quarterly and annual earnings history makes it a good match with the C and A criteria. See the latest FSU analysis for an annotated weekly graph."
>>> The latest Featured Stock Update with an annotated graph appeared on 1/3/2012. Click here.
View all notes |
Alert me of new notes |
CANSLIM.net Company Profile |
SEC |
Zacks Reports |
StockTalk |
News |
Chart |
Request a new note
C
A N
S L
I M
|
MG
-
NYSE
Mistras Group Inc
DIVERSIFIED SERVICES - Bulding and Faci;ity Management Services
|
$23.99
|
+0.12
0.50% |
$24.04
|
114,954
85.21% of 50 DAV
50 DAV is 134,900
|
$26.24
-8.57%
|
10/28/2011
|
$22.49
|
PP = $23.61
|
|
MB = $24.79
|
Most Recent Note - 1/6/2012 5:51:01 PM
G - Halted its streak of distributional losses with a quiet gain today. Its 50 DMA line and upward trendline define near-term support to watch. See the latest FSU analysis for more details and a new annotated graph.
>>> The latest Featured Stock Update with an annotated graph appeared on 1/6/2012. Click here.
View all notes |
Alert me of new notes |
CANSLIM.net Company Profile |
SEC |
Zacks Reports |
StockTalk |
News |
Chart |
Request a new note
C
A N
S L
I M
|
Symbol/Exchange
Company Name
Industry Group |
PRICE |
CHANGE
(%Change) |
Day High |
Volume
(% DAV)
(% 50 day avg vol) |
52 Wk Hi
% From Hi |
Featured
Date |
Price
Featured |
Pivot Featured |
|
Max Buy |
MKTX
-
NASDAQ
Marketaxess Holdings Inc
FINANCIAL SERVICES - Investment Brokerage - Nationa
|
$30.88
|
-0.22
-0.71% |
$31.41
|
166,401
78.98% of 50 DAV
50 DAV is 210,700
|
$31.59
-2.25%
|
10/28/2011
|
$29.79
|
PP = $31.05
|
|
MB = $32.60
|
Most Recent Note - 1/5/2012 4:38:35 PM
Y - Finished near the session high with a solid gain today on average volume. Perched within close striking distance of its previously cited pivot point and near all-time highs. The 50 DMA line defines initial chart support to watch.
>>> The latest Featured Stock Update with an annotated graph appeared on 12/20/2011. Click here.
View all notes |
Alert me of new notes |
CANSLIM.net Company Profile |
SEC |
Zacks Reports |
StockTalk |
News |
Chart |
Request a new note
C
A N
S L
I M
|
OSIS
-
NASDAQ
O S I Systems Inc
ELECTRONICS - Semiconductor Equipment and Mate
|
$49.87
|
+0.00
0.00% |
$50.56
|
94,807
87.62% of 50 DAV
50 DAV is 108,200
|
$50.50
-1.25%
|
11/1/2011
|
$42.07
|
PP = $45.57
|
|
MB = $47.85
|
Most Recent Note - 1/5/2012 4:41:31 PM
G - Wedged higher with today's 3rd consecutive small gain on below average volume for a best-ever close. Extended from its prior base. Its 50 DMA line and recent chart lows near $45 define important near-term support to watch.
>>> The latest Featured Stock Update with an annotated graph appeared on 12/27/2011. Click here.
View all notes |
Alert me of new notes |
CANSLIM.net Company Profile |
SEC |
Zacks Reports |
StockTalk |
News |
Chart |
Request a new note
C
A N
S L
I M
|
PRGO
-
NASDAQ
Perrigo Co
DRUGS - Drug Related Products
|
$96.06
|
-0.09
-0.09% |
$96.91
|
819,152
59.63% of 50 DAV
50 DAV is 1,373,800
|
$104.70
-8.25%
|
12/9/2011
|
$99.54
|
PP = $101.56
|
|
MB = $106.64
|
Most Recent Note - 1/6/2012 5:58:00 PM
G - Consolidating just above support at its 50 DMA line. Subsequent weakness below that short-term average and a violation of the latest chart low ($94.04 on 1/05/12) would raise more serious concerns and trigger technical sell signals.
>>> The latest Featured Stock Update with an annotated graph appeared on 12/9/2011. Click here.
View all notes |
Alert me of new notes |
CANSLIM.net Company Profile |
SEC |
Zacks Reports |
StockTalk |
News |
Chart |
Request a new note
C
A N
S L
I M
|
RAX
-
NYSE
Rackspace Hosting Inc
INTERNET - Internet Software and; Services
|
$41.66
|
-0.11
-0.26% |
$42.06
|
1,708,625
105.92% of 50 DAV
50 DAV is 1,613,100
|
$46.50
-10.40%
|
11/8/2011
|
$44.28
|
PP = $46.27
|
|
MB = $48.58
|
Most Recent Note - 1/5/2012 5:53:30 PM
G - Down today with higher volume while violating its 50 DMA line, triggering a technical sell signal and sinking to 5-week lows. Color code was changed to green based on weak action that is indicative of distributional pressure after not making headway above its pivot point. See the latest FSU analysis for more details and a new annotated graph.
>>> The latest Featured Stock Update with an annotated graph appeared on 1/5/2012. Click here.
View all notes |
Alert me of new notes |
CANSLIM.net Company Profile |
SEC |
Zacks Reports |
StockTalk |
News |
Chart |
Request a new note
C
A N
S L
I M
|
TDG
-
NYSE
Transdigm Group Inc
AEROSPACE/DEFENSE - Aerospace/Defense Products and; Services
|
$96.74
|
+1.55
1.63% |
$98.30
|
411,475
115.26% of 50 DAV
50 DAV is 357,000
|
$102.73
-5.83%
|
11/9/2011
|
$98.45
|
PP = $95.14
|
|
MB = $99.90
|
Most Recent Note - 1/5/2012 4:47:05 PM
G - Promptly rebounded above its 50 DMA line today with a solid gain on higher volume, and its finish near the session high was an encouraging sign of support. Its prior loss on more than 2 times average volume triggered a technical sell signal. Recent lows in the $90 area define the next nearby support level to watch. See latest FSU analysis for more details and a new annotated graph.
>>> The latest Featured Stock Update with an annotated graph appeared on 1/4/2012. Click here.
View all notes |
Alert me of new notes |
CANSLIM.net Company Profile |
SEC |
Zacks Reports |
StockTalk |
News |
Chart |
Request a new note
C
A N
S L
I M
|
Symbol/Exchange
Company Name
Industry Group |
PRICE |
CHANGE
(%Change) |
Day High |
Volume
(% DAV)
(% 50 day avg vol) |
52 Wk Hi
% From Hi |
Featured
Date |
Price
Featured |
Pivot Featured |
|
Max Buy |
V
-
NYSE
Visa Inc Cl A
DIVERSIFIED SERVICES - Business/Management Services
|
$100.71
|
-1.20
-1.18% |
$102.22
|
3,272,245
79.63% of 50 DAV
50 DAV is 4,109,500
|
$103.45
-2.65%
|
10/24/2011
|
$94.21
|
PP = $94.85
|
|
MB = $99.59
|
Most Recent Note - 1/5/2012 4:29:22 PM
G - Overcame early weakness and managed a positive reversal today for a small gain on below average volume. It is extended from its prior base and trading above its "max buy" level. Prior highs in the $95 area and its 50 DMA line define chart support to watch on pullbacks.
>>> The latest Featured Stock Update with an annotated graph appeared on 12/15/2011. Click here.
View all notes |
Alert me of new notes |
CANSLIM.net Company Profile |
SEC |
Zacks Reports |
StockTalk |
News |
Chart |
Request a new note
C
A N
S L
I M
|
|
|
|
THESE ARE NOT BUY RECOMMENDATIONS!
Comments contained in the body of this report are technical
opinions only. The material herein has been obtained
from sources believed to be reliable and accurate, however,
its accuracy and completeness cannot be guaranteed.
This site is not an investment advisor, hence it does
not endorse or recommend any securities or other investments.
Any recommendation contained in this report may not
be suitable for all investors and it is not to be deemed
an offer or solicitation on our part with respect to
the purchase or sale of any securities. All trademarks,
service marks and trade names appearing in this report
are the property of their respective owners, and are
likewise used for identification purposes only.
This report is a service available
only to active Paid Premium Members.
You may opt-out of receiving report notifications
at any time. Questions or comments may be submitted
by writing to Premium Membership Services 665 S.E. 10 Street, Suite 201 Deerfield Beach, FL 33441-5634 or by calling 1-800-965-8307
or 954-785-1121.
|
|
|

