***Last / Change / Volume data in this table is the closing quote data***
Symbol/Exchange
Company Name
Industry Group |
PRICE |
CHANGE
(%Change) |
Day High |
Volume
(% DAV)
(% 50 day avg vol) |
52 Wk Hi
% From Hi |
Featured
Date |
Price
Featured |
Pivot Featured |
|
Max Buy |
ARMH
-
NASDAQ
A R M Holdings Plc Ads
ELECTRONICS - Semiconductor - Specialized
|
$53.55
|
-0.46
-0.85% |
$54.26
|
1,945,499
116.59% of 50 DAV
50 DAV is 1,668,700
|
$55.26
-3.09%
|
12/23/2013
|
$54.59
|
PP = $52.48
|
|
MB = $55.10
|
Most Recent Note - 12/30/2013 5:35:43 PM
Y - Prior highs near $52 define initial support to watch on pullbacks. Stubbornly holding its ground with volume totals cooling after technically breaking out as noted earlier.
>>> FEATURED STOCK ARTICLE : No Overhead Supply Remains Following Volume-Driven Breakout - 12/23/2013
View all notes |
Set NEW NOTE alert |
CANSLIM.net Company Profile |
SEC
News |
Chart |
Request a new note
C
A N
S L
I M


|
CELG
-
NASDAQ
Celgene Corp
DRUGS - Drug Manufacturers - Major
|
$169.81
|
-2.13
-1.24% |
$171.79
|
1,589,785
59.29% of 50 DAV
50 DAV is 2,681,300
|
$173.80
-2.30%
|
9/12/2013
|
$149.50
|
PP = $150.02
|
|
MB = $157.52
|
Most Recent Note - 12/31/2013 5:23:06 PM
G - Perched within close striking distance of its 52-week high. Found prompt support near its 50 DMA line recently. Subsequent violations would raise greater concerns and trigger technical sell signals.
>>> FEATURED STOCK ARTICLE : Cooling Volume Totals While Hovering Near Highs - 12/4/2013
View all notes |
Set NEW NOTE alert |
CANSLIM.net Company Profile |
SEC
News |
Chart |
Request a new note
C
A N
S L
I M
|
EGOV
-
NASDAQ
N I C Inc
INTERNET - Internet Software and Services
|
$23.50
|
-0.29
-1.22% |
$23.86
|
273,444
99.54% of 50 DAV
50 DAV is 274,700
|
$25.99
-9.58%
|
12/20/2013
|
$24.00
|
PP = $26.09
|
|
MB = $27.39
|
Most Recent Note - 1/2/2014 1:13:31 PM
Y - Retreating toward its 50 DMA line with today's loss after 4 consecutive gains. Subsequent gains above the pivot with sufficient volume may trigger a new (or add-on) technical buy signal. Recent low ($22.17 on 12/16/13) defines near-term support above its 200 DMA line.
>>> FEATURED STOCK ARTICLE : Rebounded Above 50-Day Average; Relative Strength Rating Waned - 12/27/2013
View all notes |
Set NEW NOTE alert |
CANSLIM.net Company Profile |
SEC
News |
Chart |
Request a new note
C
A N
S L
I M
|
EQM
-
NYSE
E Q T Midstream Partners
ENERGY - Oil and Gas Pipelines
|
$59.16
|
+0.76
1.30% |
$60.15
|
90,222
69.56% of 50 DAV
50 DAV is 129,700
|
$59.39
-0.39%
|
12/12/2013
|
$53.17
|
PP = $56.51
|
|
MB = $59.34
|
Most Recent Note - 1/2/2014 12:32:57 PM
Y - Hovering near its all-time high today after wedging higher with gains lacking great volume conviction. A gain above the pivot point backed by at least +40% above average volume is needed to trigger a proper technical buy signal.
>>> FEATURED STOCK ARTICLE : Finding Support Near 50-Day Moving Average While Perched Near Highs - 12/13/2013
View all notes |
Set NEW NOTE alert |
CANSLIM.net Company Profile |
SEC
News |
Chart |
Request a new note
C
A N
S L
I M
|
FB
-
NASDAQ
Facebook Inc Cl A
INTERNET
|
$54.56
|
-0.15
-0.28% |
$55.65
|
38,243,189
51.65% of 50 DAV
50 DAV is 74,040,400
|
$58.58
-6.87%
|
12/12/2013
|
$51.40
|
PP = $54.93
|
|
MB = $57.68
|
Most Recent Note - 12/30/2013 5:39:53 PM
Y - Pulled back today and closed below its old high close ($54.22 on 10/18/13) raising concerns while slumping back into the prior base. Rallied from a 9-week cup shaped base without a handle after completing a Public Offering on 12/20/13. Disciplined investors always limit losses by selling any stock that falls more than -7% from their purchase price.
>>> FEATURED STOCK ARTICLE : Well Known Social Media Firm on Watch List While Still Base Building - 12/12/2013
View all notes |
Set NEW NOTE alert |
CANSLIM.net Company Profile |
SEC
News |
Chart |
Request a new note
C
A N
S L
I M
|
Symbol/Exchange
Company Name
Industry Group |
PRICE |
CHANGE
(%Change) |
Day High |
Volume
(% DAV)
(% 50 day avg vol) |
52 Wk Hi
% From Hi |
Featured
Date |
Price
Featured |
Pivot Featured |
|
Max Buy |
FLT
-
NYSE
Fleetcor Technologies
DIVERSIFIED SERVICES - Business/Management Services
|
$116.62
|
-1.76
-1.49% |
$118.56
|
572,295
70.88% of 50 DAV
50 DAV is 807,400
|
$123.96
-5.92%
|
8/19/2013
|
$99.01
|
PP = $100.97
|
|
MB = $106.02
|
Most Recent Note - 1/2/2014 12:35:38 PM
G - Consolidating near its 50 DMA line with today's gain on higher volume. Previously noted - "It may be forming a new late-stage base but still faces some resistance up through the $123 level."
>>> FEATURED STOCK ARTICLE : Enduring Distributional Pressure While Extended From Sound Base - 12/17/2013
View all notes |
Set NEW NOTE alert |
CANSLIM.net Company Profile |
SEC
News |
Chart |
Request a new note
C
A N
S L
I M
|
GNRC
-
NYSE
Generac Hldgs Inc
CONSUMER DURABLES - Electronic Equipment
|
$56.75
|
+0.46
0.82% |
$57.27
|
550,325
73.59% of 50 DAV
50 DAV is 747,800
|
$57.05
-0.53%
|
11/26/2013
|
$53.02
|
PP = $52.42
|
|
MB = $55.04
|
Most Recent Note - 1/2/2014 6:32:49 PM
G - Holding its ground stubbornly near its all-time high. Prior highs in the $52 area define initial support to watch on pullbacks. See the latest FSU analysis for more details and new annotated daily and weekly graphs.
>>> FEATURED STOCK ARTICLE : Volume Totals Cooling While Holding Ground Near Highs - 1/2/2014
View all notes |
Set NEW NOTE alert |
CANSLIM.net Company Profile |
SEC
News |
Chart |
Request a new note
C
A N
S L
I M
|
HLF
-
NYSE
Herbalife Ltd
DRUGS - Nutrition and Weight Management
|
$77.09
|
-2.74
-3.43% |
$78.99
|
7,458,809
280.93% of 50 DAV
50 DAV is 2,655,000
|
$81.75
-5.70%
|
11/22/2013
|
$72.21
|
PP = $75.04
|
|
MB = $78.79
|
 Most Recent Note - 1/3/2014 12:35:15 PM
Y - Pulling back on higher volume today, a sign of distributional pressure. Prior highs in the $74 area define initial support to watch. Disciplined investors always limit losses if any stock falls more than -7% from their purchase price.
>>> FEATURED STOCK ARTICLE : Volume Totals Cooling While Perched Near Highs - 12/30/2013
View all notes |
Set NEW NOTE alert |
CANSLIM.net Company Profile |
SEC
News |
Chart |
Request a new note
C
A N
S L
I M
|
JAZZ
-
NASDAQ
Jazz Pharmaceuticals Plc
DRUGS - Biotechnology
|
$126.35
|
-0.43
-0.34% |
$128.45
|
423,207
58.74% of 50 DAV
50 DAV is 720,500
|
$128.49
-1.67%
|
9/30/2013
|
$93.20
|
PP = $89.10
|
|
MB = $93.56
|
Most Recent Note - 1/2/2014 1:16:14 PM
G - Still hovering at its 52-week high, stubbornly holding its ground with volume totals cooling. Heavy volume was behind considerable gains on 12/20/13 news it will buy Gentium Spa (GENT) for $1 Billion.
>>> FEATURED STOCK ARTICLE : Technically Extended Stock May Be a Dangerous Chase - 12/10/2013
View all notes |
Set NEW NOTE alert |
CANSLIM.net Company Profile |
SEC
News |
Chart |
Request a new note
C
A N
S L
I M
|
KORS
-
NYSE
Michael Kors Hldgs Ltd
RETAIL - Apparel Stores
|
$82.51
|
+0.10
0.12% |
$83.50
|
1,898,469
40.45% of 50 DAV
50 DAV is 4,693,700
|
$84.58
-2.45%
|
8/6/2013
|
$69.66
|
PP = $66.28
|
|
MB = $69.59
|
Most Recent Note - 12/30/2013 5:41:19 PM
G - Still testing support at its 50 DMA line after recent distributional pressure. Did not form a new base of sufficient length.
>>> FEATURED STOCK ARTICLE : Consolidation Too Brief To Note New Pivot - 12/6/2013
View all notes |
Set NEW NOTE alert |
CANSLIM.net Company Profile |
SEC
News |
Chart |
Request a new note
C
A N
S L
I M
|
Symbol/Exchange
Company Name
Industry Group |
PRICE |
CHANGE
(%Change) |
Day High |
Volume
(% DAV)
(% 50 day avg vol) |
52 Wk Hi
% From Hi |
Featured
Date |
Price
Featured |
Pivot Featured |
|
Max Buy |
MRLN
-
NASDAQ
Marlin Business Services
DIVERSIFIED SERVICES - Rental and Leasing Services
|
$26.37
|
+0.67
2.61% |
$26.52
|
31,426
115.54% of 50 DAV
50 DAV is 27,200
|
$28.64
-7.92%
|
12/19/2013
|
$26.69
|
PP = $28.74
|
|
MB = $30.18
|
Most Recent Note - 1/2/2014 1:20:05 PM
G - Its Relative Strength (RS) Rating has slumped to 64, well below the 80+ minimum guideline for buy candidates. Color code is changed to green while consolidating near its 50 DMA line with volume totals cooling. Subsequent volume-driven gains above the pivot point are needed to trigger a proper new technical buy signal.
>>> FEATURED STOCK ARTICLE : Finished Weak While Enduring Distributional Pressure - 12/19/2013
View all notes |
Set NEW NOTE alert |
CANSLIM.net Company Profile |
SEC
News |
Chart |
Request a new note
C
A N
S L
I M
|
PCLN
-
NASDAQ
Priceline.Com Inc
INTERNET - Internet Software and Services
|
$1,132.68
|
-12.76
-1.11% |
$1,152.69
|
622,684
106.41% of 50 DAV
50 DAV is 585,200
|
$1,198.75
-5.51%
|
12/18/2013
|
$1,156.20
|
PP = $1,198.85
|
|
MB = $1,258.79
|
Most Recent Note - 1/2/2014 12:55:52 PM
Y - Slumping near prior lows and its 50 DMA line ($1,136.34 now) while enduring mild distributional pressure recently, and subsequent violations may trigger worrisome technical sell signals. Volume-driven gains above the pivot point have not shown up since recently highlighted. Disciplined investors watch for a proper technical buy signal before taking action and always limit losses if any stock falls more than -7% from their buy point.
>>> FEATURED STOCK ARTICLE : Extended From Any Sound Base Pattern - 12/3/2013
View all notes |
Set NEW NOTE alert |
CANSLIM.net Company Profile |
SEC
News |
Chart |
Request a new note
C
A N
S L
I M
|
SFUN
-
NYSE
Soufun Hldgs Ltd Ads A
INTERNET - Internet Information Providers
|
$82.33
|
-0.18
-0.22% |
$83.22
|
841,213
67.15% of 50 DAV
50 DAV is 1,252,700
|
$84.44
-2.49%
|
10/17/2013
|
$58.02
|
PP = $53.87
|
|
MB = $56.56
|
Most Recent Note - 12/31/2013 5:25:22 PM
G - Perched at all-time highs, still holding its ground stubbornly. Wedged higher since noted in prior reports with caution - "It is extended from any sound base pattern yet may produce more climactic gains. Prior highs and its 50 DMA line coincide in the $59 area defining important support to watch."
>>> FEATURED STOCK ARTICLE : Extended From Base Yet May Produce More Climactic Gains - 12/9/2013
View all notes |
Set NEW NOTE alert |
CANSLIM.net Company Profile |
SEC
News |
Chart |
Request a new note
C
A N
S L
I M
|
SILC
-
NASDAQ
Silicom Ltd
COMPUTER HARDWARE - Networking andamp; Communication Dev
|
$45.40
|
+0.09
0.20% |
$45.94
|
18,488
50.10% of 50 DAV
50 DAV is 36,900
|
$46.15
-1.63%
|
12/23/2013
|
$44.62
|
PP = $46.25
|
|
MB = $48.56
|
Most Recent Note - 1/2/2014 1:03:09 PM
Y - Challenging its pivot point and hitting a new 52-week high today while on track for a 12th consecutive gain without great volume conviction. Volume should be a minimum of +40% above average behind gains above a stock's pivot point to trigger a proper technical buy signal.
>>> FEATURED STOCK ARTICLE : Stock With Small Supply Has Formed a Sound Base Pattern - 12/24/2013
View all notes |
Set NEW NOTE alert |
CANSLIM.net Company Profile |
SEC
News |
Chart |
Request a new note
C
A N
S L
I M
|
SSNC
-
NASDAQ
S S & C Technologies
COMPUTER SOFTWARE and SERVICES - Application Software
|
$45.09
|
+0.55
1.23% |
$45.26
|
286,608
99.93% of 50 DAV
50 DAV is 286,800
|
$44.26
1.88%
|
10/22/2013
|
$39.17
|
PP = $40.04
|
|
MB = $42.04
|
Most Recent Note - 12/30/2013 5:43:29 PM
G - Finished at a best-ever close after today's 6th consecutive gain with light volume. Found recent support near its 50 DMA line but did not form a sound new base. Recent low ($38.85 on 12/13/13) defines important near-term support to watch below its 50 DMA line.
>>> FEATURED STOCK ARTICLE : Found Prompt Support After Damaging Losses Raised Concerns - 12/16/2013
View all notes |
Set NEW NOTE alert |
CANSLIM.net Company Profile |
SEC
News |
Chart |
Request a new note
C
A N
S L
I M
|
Symbol/Exchange
Company Name
Industry Group |
PRICE |
CHANGE
(%Change) |
Day High |
Volume
(% DAV)
(% 50 day avg vol) |
52 Wk Hi
% From Hi |
Featured
Date |
Price
Featured |
Pivot Featured |
|
Max Buy |
SSYS
-
NASDAQ
Stratasys Ltd
COMPUTER HARDWARE - Computer Peripherals
|
$136.46
|
+2.45
1.83% |
$138.10
|
813,072
72.92% of 50 DAV
50 DAV is 1,115,000
|
$134.87
1.18%
|
10/11/2013
|
$102.94
|
PP = $105.38
|
|
MB = $110.65
|
Most Recent Note - 1/2/2014 1:23:37 PM
G - Wedging to another new 52-week high today, rising without great volume conviction behind recent gains. Found recent support at its 50 DMA line. Previously noted with caution - "Reported earnings +13% on +153% sales revenues, below the +25% minimum earnings guideline (C criteria) raising fundamental concerns."
>>> FEATURED STOCK ARTICLE : Rallying From Support at 50-Day Moving Average Line - 12/20/2013
View all notes |
Set NEW NOTE alert |
CANSLIM.net Company Profile |
SEC
News |
Chart |
Request a new note
C
A N
S L
I M
|
ULTI
-
NASDAQ
Ultimate Software Group
INTERNET - Internet Software and Services
|
$151.88
|
-0.55
-0.36% |
$154.06
|
124,978
88.83% of 50 DAV
50 DAV is 140,700
|
$162.88
-6.75%
|
10/16/2013
|
$142.95
|
PP = $151.18
|
|
MB = $158.74
|
Most Recent Note - 1/2/2014 1:28:49 PM
G - Its Relative Strength (RS) Rating has slumped to 80, the minimum rank for buy candidates. Consolidating near its 50 DMA line. The recent low ($144.04 on 12/12/13) define the next near-term support to watch.
>>> FEATURED STOCK ARTICLE : Gain on Light Volume While Inching Above 50-Day Average - 12/26/2013
View all notes |
Set NEW NOTE alert |
CANSLIM.net Company Profile |
SEC
News |
Chart |
Request a new note
C
A N
S L
I M
|
VRX
-
NYSE
Valeant Pharmaceuticals
DRUGS - Drug Manufacturers - Other
|
$117.16
|
+0.18
0.15% |
$118.01
|
787,409
71.94% of 50 DAV
50 DAV is 1,094,600
|
$118.25
-0.92%
|
9/11/2013
|
$100.26
|
PP = $105.50
|
|
MB = $110.78
|
Most Recent Note - 1/2/2014 1:04:44 PM
G - Perched at its 52-week high today with volume running at an above average pace. Resilient after earnings +24% on +74% sales revenues for the Sep '13 quarter came in a notch below the +25% minimum guideline (C criteria).
>>> FEATURED STOCK ARTICLE : Rebounding With Volume Backed Gains But Fundamental Concerns Remain - 12/18/2013
View all notes |
Set NEW NOTE alert |
CANSLIM.net Company Profile |
SEC
News |
Chart |
Request a new note
C
A N
S L
I M
|
YNDX
-
NASDAQ
Yandex N V Class A
INTERNET - Internet Information Providers
|
$42.90
|
+0.27
0.63% |
$43.34
|
1,130,415
45.23% of 50 DAV
50 DAV is 2,499,300
|
$43.65
-1.72%
|
11/27/2013
|
$39.61
|
PP = $42.10
|
|
MB = $44.21
|
Most Recent Note - 12/31/2013 5:18:33 PM
Y - Rallied for a best ever close with light volume behind today's gain. At least +40% above average volume should be behind gains above the pivot point to trigger a proper new technical buy signal. See the latest FSU analysis for more details and a new annotated graph.
>>> FEATURED STOCK ARTICLE : Best Ever Close With Gain on Light Volume - 12/31/2013
View all notes |
Set NEW NOTE alert |
CANSLIM.net Company Profile |
SEC
News |
Chart |
Request a new note
C
A N
S L
I M
|
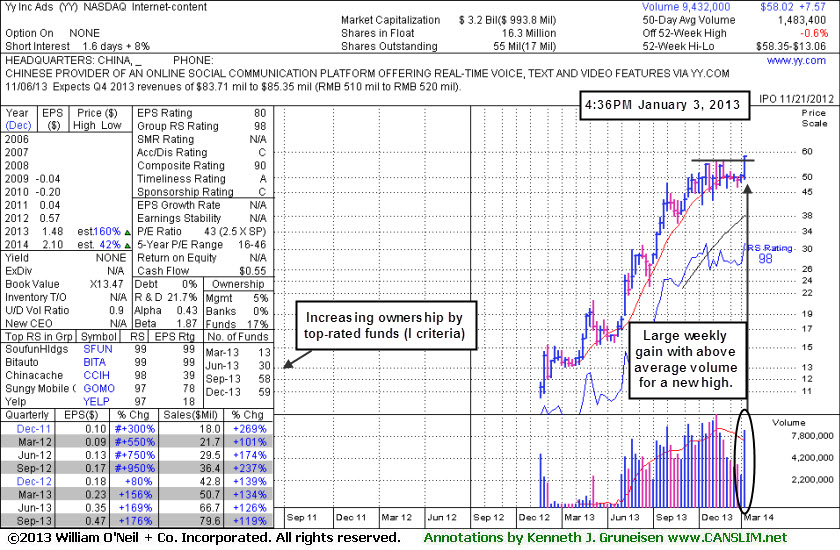
YY
-
NASDAQ
YY Inc Ads
INTERNET - Internet Service Providers
|
$58.02
|
+5.56
10.60% |
$58.35
|
5,312,473
358.13% of 50 DAV
50 DAV is 1,483,400
|
$56.75
2.24%
|
1/3/2014
|
$55.08
|
PP = $56.85
|
|
MB = $59.69
|
Most Recent Note - 1/3/2014 5:31:41 PM
Y - Finished strong after highlighted in yellow in the earlier mid-day report (read here) with pivot point cited based on its 11/18/13 high plus 10 cents after a riskier "late stage" base. The gain above the pivot point triggered a convincing technical buy signal with +258% above average volume. See the latest FSU analysis for an annotated weekly graph and additional details.

>>> FEATURED STOCK ARTICLE : Finished Strong With High Volume After Featured in Mid-Day Report - 1/3/2014
View all notes |
Set NEW NOTE alert |
CANSLIM.net Company Profile |
SEC
News |
Chart |
Request a new note
C
A N
S L
I M
|
Symbol/Exchange
Company Name
Industry Group |
PRICE |
CHANGE
(%Change) |
Day High |
Volume
(% DAV)
(% 50 day avg vol) |
52 Wk Hi
% From Hi |
Featured
Date |
Price
Featured |
Pivot Featured |
|
Max Buy |