You are not logged in.
This means you
CAN ONLY VIEW reports that were published prior to Monday, April 14, 2025.
You
MUST UPGRADE YOUR MEMBERSHIP if you want to see any current reports.
AFTER MARKET UPDATE - THURSDAY, JANUARY 2ND, 2014
Previous After Market Report Next After Market Report >>>
|
|
|
|
DOW |
-135.31 |
16,441.35 |
-0.82% |
|
Volume |
611,656,480 |
+10% |
|
Volume |
1,635,382,940 |
+26% |
|
NASDAQ |
-33.52 |
4,143.07 |
-0.80% |
|
Advancers |
1,014 |
32% |
|
Advancers |
929 |
35% |
|
S&P 500 |
-16.38 |
1,831.98 |
-0.89% |
|
Decliners |
2,058 |
65% |
|
Decliners |
1,662 |
63% |
|
Russell 2000 |
-12.92 |
1,150.72 |
-1.11% |
|
52 Wk Highs |
90 |
|
|
52 Wk Highs |
103 |
|
|
S&P 600 |
-8.25 |
657.29 |
-1.24% |
|
52 Wk Lows |
31 |
|
|
52 Wk Lows |
10 |
|
|
 |
Major Averages Started New Year With Losses
Kenneth J. Gruneisen - Passed the CAN SLIM® Master's Exam
Stocks kicked off 2014 on a down note. The Dow lost 135 points to 16,441. The NASDAQ was down 33 points to close at 4,143. Behind Thursday's losses the volume totals were higher than the prior trading session's volume totals on the NYSE and on the Nasdaq exchange. Breadth was negative as advancers trailed decliners by a 2-1 margin on the NYSE and 9-5 on the Nasdaq exchange. There were 33 high-ranked companies from the CANSLIM.net Leaders List that made new 52-week highs and appeared on the CANSLIM.net BreakOuts Page, down from a total of 76 stocks on the prior session. The list of stocks hitting new 52-week highs contracted yet new highs still outnumbered new lows on the Nasdaq exchange and on the NYSE. There were gains for 9 of the 19 high-ranked companies currently included on the Featured Stocks Page.
Investors overlooked a batch of positive economic data and instead took profits from 2013's impressive rally. Jobless claims unexpectedly fell last week to a one-month low while construction spending increased for the eighth consecutive month in November. In addition, a gauge from the ISM showed manufacturing expanded in December at the second-fastest pace in more than two years.
Overall, every S&P 500 sector retreated. Utilities and industrials were the worst performing groups as Dominion Resources Inc (D -1.72%) and General Electric Co (GE -1.89%) lost ground. Energy stocks were also under pressure as WTI crude dropped the most in nearly 14 months. Exxon Mobil Corp (XOM -1.43%) and Schlumberger Ltd (SLB -1.3%) fell.
Treasury yields fell from almost two-year highs as prices increased. The 10-year note gained 12/32 to yield 2.98%. The 30-year bond rose 27/32 to yield 3.92%.
The Market (M criteria) rally has continued producing sufficient leadership (stocks hitting new highs) and the ongoing uptrend remains intact. New buying efforts should always be selective. The CANSLIM.net Featured Stocks Page shows the most action-worthy candidates and their latest notes and a Headline Link directs members to the latest detailed analysis with data-packed graphs annotated by a Certified expert along with links to additional resources. The Premium Member Homepage includes "dynamic archives" to all prior pay reports published. Watch for an announcement via email concerning the next WEBCAST.
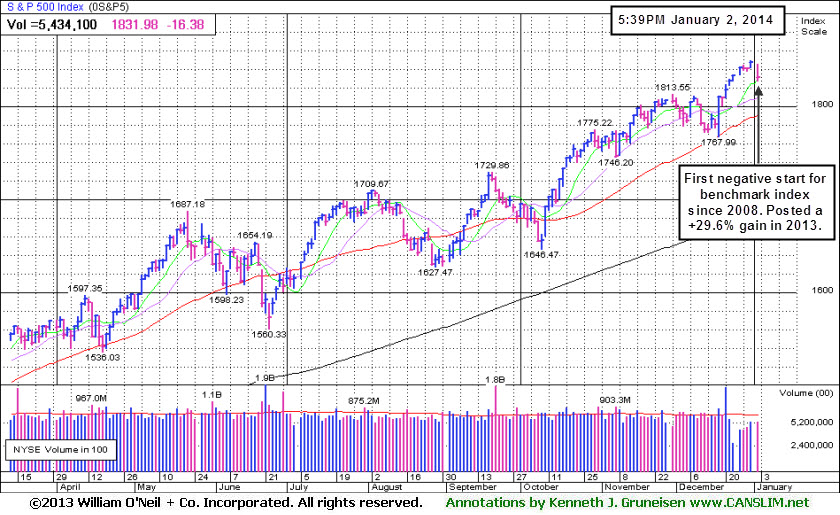
PICTURED: The S&P 500 Index started the year lower for the first time since 2008 as it declined 16 points to 1,831. It rose +29.6% in 2013.
|
 Kenneth J. Gruneisen started out as a licensed stockbroker in August 1987, a couple of months prior to the historic stock market crash that took the Dow Jones Industrial Average down -22.6% in a single day. He has published daily fact-based fundamental and technical analysis on high-ranked stocks online for two decades. Through FACTBASEDINVESTING.COM, Kenneth provides educational articles, news, market commentary, and other information regarding proven investment systems that work in good times and bad.
Comments contained in the body of this report are technical opinions only and are not necessarily those of Gruneisen Growth Corp. The material herein has been obtained from sources believed to be reliable and accurate, however, its accuracy and completeness cannot be guaranteed. Our firm, employees, and customers may effect transactions, including transactions contrary to any recommendation herein, or have positions in the securities mentioned herein or options with respect thereto. Any recommendation contained in this report may not be suitable for all investors and it is not to be deemed an offer or solicitation on our part with respect to the purchase or sale of any securities. |
|
 |
Gold & Silver Index Rallied Amid Widespread Losses
Kenneth J. Gruneisen - Passed the CAN SLIM® Master's Exam
The Gold & Silver Index ($XAU +4.03%) was a standout gainer while most groups lost ground on Thursday's session. The Retail Index ($RLX -0.39%) and financial groups had a negative influence on the major averages as the Bank Index ($BKX -0.45%) and the Broker/Dealer Index ($XBD -0.42%) ended with modest losses. The Biotechnology Index ($BTK +0.52%) posted a gain while the Networking Index ($NWX -1.22%) and the Semiconductor Index ($SOX -1.36%) lost ground. Energy-related shares had a negative bias as the Oil Services Index ($OSX -1.66%) and the Integrated Oil Index ($XOI -1.26%) lost ground.
Charts courtesy www.stockcharts.com
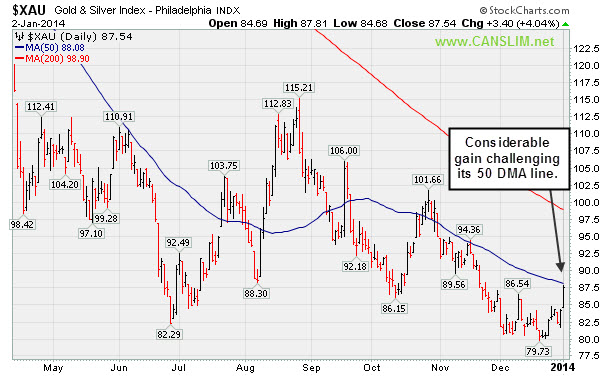
PICTURED: The Gold & Silver Index ($XAU +4.03%) was a standout gainer on Thursday, rallying toward its 50-day moving average (DMA) line. It lost -49.18% in 2013.
| Oil Services |
$OSX |
276.36 |
-4.67 |
-1.66% |
-1.66% |
| Integrated Oil |
$XOI |
1,484.20 |
-18.94 |
-1.26% |
-1.26% |
| Semiconductor |
$SOX |
527.75 |
-7.28 |
-1.36% |
-1.36% |
| Networking |
$NWX |
319.98 |
-3.96 |
-1.22% |
-1.22% |
| Broker/Dealer |
$XBD |
159.88 |
-0.68 |
-0.42% |
-0.42% |
| Retail |
$RLX |
936.12 |
-3.68 |
-0.39% |
-0.39% |
| Gold & Silver |
$XAU |
87.54 |
+3.39 |
+4.03% |
+4.03% |
| Bank |
$BKX |
68.95 |
-0.31 |
-0.45% |
-0.45% |
| Biotech |
$BTK |
2,342.62 |
+12.19 |
+0.52% |
+0.52% |
|
|
|
 |
Volume Totals Cooling While Holding Ground Near Highs
Kenneth J. Gruneisen - Passed the CAN SLIM® Master's Exam
Generac Hldgs Inc (GNRC -$0.35 or -0.62% to $56.29) is holding its ground stubbornly near its all-time high with volume totals cooling, action indicating that few investors have been headed for the exit. Prior highs in the $52 area define initial support to watch on pullbacks. A volume-driven gain on 12/20/13 was its last gain with above average volume, and it has stubbornly held its ground and made gradual progress since its last appearance in this FSU section on 11/29/13 with annotated graphs under the headline, "Following Latest Breakout Prior Highs Define Support", while consolidating above prior highs in the $52 area. On 11/26/13 a new pivot point was cited based on its 10/25/13 high plus 10 cents as it rallied from a short flat base with +59% above average volume triggering a new (or-add on) technical buy signal. Disciplined investors avoid chasing stocks if they get extended more than +5% above their pivot point, and they always limit losses by selling if any stock falls more than -7% from their purchase price.
The high-ranked Electrical - Power/Equipment firm It reported earnings +36% on +21% sales revenues for the Sep '13 quarter, continuing its strong earnings increases satisfying the C criteria. Consensus estimates are calling for FY '13 earnings growth of +29%, yet FY '14 earnings are forecast at down -6%, and its currently low P/E valuation (0.8 X SP) suggests that the market has a timid outlook for future growth which is cause for some concern.
The number of top-rated funds owning its shares rose from 280 in Dec '12 to 427 in Sep '13, an encouraging sign concerning the I criteria. Its current Up/Down Volume Ratio of 1.8 is also an unbiased indication that it shares have been under accumulation over the past 50 days.
|
|
|
Color Codes Explained :
Y - Better candidates highlighted by our
staff of experts.
G - Previously featured
in past reports as yellow but may no longer be buyable under the
guidelines.
***Last / Change / Volume data in this table is the closing quote data***
Symbol/Exchange
Company Name
Industry Group |
PRICE |
CHANGE
(%Change) |
Day High |
Volume
(% DAV)
(% 50 day avg vol) |
52 Wk Hi
% From Hi |
Featured
Date |
Price
Featured |
Pivot Featured |
|
Max Buy |
ARMH
-
NASDAQ
A R M Holdings Plc Ads
ELECTRONICS - Semiconductor - Specialized
|
$54.01
|
-0.72
-1.32% |
$54.75
|
1,383,945
80.75% of 50 DAV
50 DAV is 1,713,900
|
$55.26
-2.26%
|
12/23/2013
|
$54.59
|
PP = $52.48
|
|
MB = $55.10
|
Most Recent Note - 12/30/2013 5:35:43 PM
Y - Prior highs near $52 define initial support to watch on pullbacks. Stubbornly holding its ground with volume totals cooling after technically breaking out as noted earlier.
>>> FEATURED STOCK ARTICLE : No Overhead Supply Remains Following Volume-Driven Breakout - 12/23/2013
View all notes |
Set NEW NOTE alert |
CANSLIM.net Company Profile |
SEC
News |
Chart |
Request a new note
C
A N
S L
I M


|
CELG
-
NASDAQ
Celgene Corp
DRUGS - Drug Manufacturers - Major
|
$171.94
|
+2.97
1.76% |
$172.34
|
2,379,168
89.02% of 50 DAV
50 DAV is 2,672,700
|
$173.80
-1.07%
|
9/12/2013
|
$149.50
|
PP = $150.02
|
|
MB = $157.52
|
Most Recent Note - 12/31/2013 5:23:06 PM
G - Perched within close striking distance of its 52-week high. Found prompt support near its 50 DMA line recently. Subsequent violations would raise greater concerns and trigger technical sell signals.
>>> FEATURED STOCK ARTICLE : Cooling Volume Totals While Hovering Near Highs - 12/4/2013
View all notes |
Set NEW NOTE alert |
CANSLIM.net Company Profile |
SEC
News |
Chart |
Request a new note
C
A N
S L
I M
|
EGOV
-
NASDAQ
N I C Inc
INTERNET - Internet Software and Services
|
$23.79
|
-1.08
-4.34% |
$24.97
|
253,553
90.59% of 50 DAV
50 DAV is 279,900
|
$25.99
-8.46%
|
12/20/2013
|
$24.00
|
PP = $26.09
|
|
MB = $27.39
|
 Most Recent Note - 1/2/2014 1:13:31 PM
Y - Retreating toward its 50 DMA line with today's loss after 4 consecutive gains. Subsequent gains above the pivot with sufficient volume may trigger a new (or add-on) technical buy signal. Recent low ($22.17 on 12/16/13) defines near-term support above its 200 DMA line.
>>> FEATURED STOCK ARTICLE : Rebounded Above 50-Day Average; Relative Strength Rating Waned - 12/27/2013
View all notes |
Set NEW NOTE alert |
CANSLIM.net Company Profile |
SEC
News |
Chart |
Request a new note
C
A N
S L
I M
|
EQM
-
NYSE
E Q T Midstream Partners
ENERGY - Oil and Gas Pipelines
|
$58.40
|
-0.39
-0.66% |
$58.60
|
222,600
171.23% of 50 DAV
50 DAV is 130,000
|
$59.39
-1.67%
|
12/12/2013
|
$53.17
|
PP = $56.51
|
|
MB = $59.34
|
Most Recent Note - 1/2/2014 12:32:57 PM
Y - Hovering near its all-time high today after wedging higher with gains lacking great volume conviction. A gain above the pivot point backed by at least +40% above average volume is needed to trigger a proper technical buy signal.
>>> FEATURED STOCK ARTICLE : Finding Support Near 50-Day Moving Average While Perched Near Highs - 12/13/2013
View all notes |
Set NEW NOTE alert |
CANSLIM.net Company Profile |
SEC
News |
Chart |
Request a new note
C
A N
S L
I M
|
FB
-
NASDAQ
Facebook Inc Cl A
INTERNET
|
$54.71
|
+0.06
0.11% |
$55.22
|
43,209,911
58.12% of 50 DAV
50 DAV is 74,339,900
|
$58.58
-6.61%
|
12/12/2013
|
$51.40
|
PP = $54.93
|
|
MB = $57.68
|
Most Recent Note - 12/30/2013 5:39:53 PM
Y - Pulled back today and closed below its old high close ($54.22 on 10/18/13) raising concerns while slumping back into the prior base. Rallied from a 9-week cup shaped base without a handle after completing a Public Offering on 12/20/13. Disciplined investors always limit losses by selling any stock that falls more than -7% from their purchase price.
>>> FEATURED STOCK ARTICLE : Well Known Social Media Firm on Watch List While Still Base Building - 12/12/2013
View all notes |
Set NEW NOTE alert |
CANSLIM.net Company Profile |
SEC
News |
Chart |
Request a new note
C
A N
S L
I M
|
Symbol/Exchange
Company Name
Industry Group |
PRICE |
CHANGE
(%Change) |
Day High |
Volume
(% DAV)
(% 50 day avg vol) |
52 Wk Hi
% From Hi |
Featured
Date |
Price
Featured |
Pivot Featured |
|
Max Buy |
FLT
-
NYSE
Fleetcor Technologies
DIVERSIFIED SERVICES - Business/Management Services
|
$118.38
|
+1.21
1.03% |
$118.45
|
1,264,475
159.51% of 50 DAV
50 DAV is 792,700
|
$123.96
-4.50%
|
8/19/2013
|
$99.01
|
PP = $100.97
|
|
MB = $106.02
|
Most Recent Note - 1/2/2014 12:35:38 PM
G - Consolidating near its 50 DMA line with today's gain on higher volume. Previously noted - "It may be forming a new late-stage base but still faces some resistance up through the $123 level."
>>> FEATURED STOCK ARTICLE : Enduring Distributional Pressure While Extended From Sound Base - 12/17/2013
View all notes |
Set NEW NOTE alert |
CANSLIM.net Company Profile |
SEC
News |
Chart |
Request a new note
C
A N
S L
I M
|
GNRC
-
NYSE
Generac Hldgs Inc
CONSUMER DURABLES - Electronic Equipment
|
$56.29
|
-0.35
-0.62% |
$56.92
|
601,050
79.95% of 50 DAV
50 DAV is 751,800
|
$57.05
-1.33%
|
11/26/2013
|
$53.02
|
PP = $52.42
|
|
MB = $55.04
|
Most Recent Note - 1/2/2014 6:32:49 PM
G - Holding its ground stubbornly near its all-time high. Prior highs in the $52 area define initial support to watch on pullbacks. See the latest FSU analysis for more details and new annotated daily and weekly graphs.
>>> FEATURED STOCK ARTICLE : Volume Totals Cooling While Holding Ground Near Highs - 1/2/2014
View all notes |
Set NEW NOTE alert |
CANSLIM.net Company Profile |
SEC
News |
Chart |
Request a new note
C
A N
S L
I M
|
HLF
-
NYSE
Herbalife Ltd
DRUGS - Nutrition and Weight Management
|
$79.83
|
+1.13
1.44% |
$80.88
|
1,870,830
70.59% of 50 DAV
50 DAV is 2,650,100
|
$81.75
-2.35%
|
11/22/2013
|
$72.21
|
PP = $75.04
|
|
MB = $78.79
|
Most Recent Note - 12/30/2013 5:30:33 PM
Y - Perched -4.7% off its 52-week high today. Color code was changed to yellow after quietly dipping below its "max buy" level. See the latest FSU analysis for more details and new annotated daily and weekly graphs.
>>> FEATURED STOCK ARTICLE : Volume Totals Cooling While Perched Near Highs - 12/30/2013
View all notes |
Set NEW NOTE alert |
CANSLIM.net Company Profile |
SEC
News |
Chart |
Request a new note
C
A N
S L
I M
|
JAZZ
-
NASDAQ
Jazz Pharmaceuticals Plc
DRUGS - Biotechnology
|
$126.78
|
+0.22
0.17% |
$127.37
|
498,402
69.18% of 50 DAV
50 DAV is 720,400
|
$128.49
-1.33%
|
9/30/2013
|
$93.20
|
PP = $89.10
|
|
MB = $93.56
|
Most Recent Note - 1/2/2014 1:16:14 PM
G - Still hovering at its 52-week high, stubbornly holding its ground with volume totals cooling. Heavy volume was behind considerable gains on 12/20/13 news it will buy Gentium Spa (GENT) for $1 Billion.
>>> FEATURED STOCK ARTICLE : Technically Extended Stock May Be a Dangerous Chase - 12/10/2013
View all notes |
Set NEW NOTE alert |
CANSLIM.net Company Profile |
SEC
News |
Chart |
Request a new note
C
A N
S L
I M
|
KORS
-
NYSE
Michael Kors Hldgs Ltd
RETAIL - Apparel Stores
|
$82.41
|
+1.22
1.50% |
$82.75
|
3,342,211
71.22% of 50 DAV
50 DAV is 4,692,900
|
$84.58
-2.57%
|
8/6/2013
|
$69.66
|
PP = $66.28
|
|
MB = $69.59
|
Most Recent Note - 12/30/2013 5:41:19 PM
G - Still testing support at its 50 DMA line after recent distributional pressure. Did not form a new base of sufficient length.
>>> FEATURED STOCK ARTICLE : Consolidation Too Brief To Note New Pivot - 12/6/2013
View all notes |
Set NEW NOTE alert |
CANSLIM.net Company Profile |
SEC
News |
Chart |
Request a new note
C
A N
S L
I M
|
Symbol/Exchange
Company Name
Industry Group |
PRICE |
CHANGE
(%Change) |
Day High |
Volume
(% DAV)
(% 50 day avg vol) |
52 Wk Hi
% From Hi |
Featured
Date |
Price
Featured |
Pivot Featured |
|
Max Buy |
MRLN
-
NASDAQ
Marlin Business Services
DIVERSIFIED SERVICES - Rental and Leasing Services
|
$25.70
|
+0.50
1.98% |
$25.77
|
97,891
380.90% of 50 DAV
50 DAV is 25,700
|
$28.64
-10.26%
|
12/19/2013
|
$26.69
|
PP = $28.74
|
|
MB = $30.18
|
Most Recent Note - 1/2/2014 1:20:05 PM
G - Its Relative Strength (RS) Rating has slumped to 64, well below the 80+ minimum guideline for buy candidates. Color code is changed to green while consolidating near its 50 DMA line with volume totals cooling. Subsequent volume-driven gains above the pivot point are needed to trigger a proper new technical buy signal.
>>> FEATURED STOCK ARTICLE : Finished Weak While Enduring Distributional Pressure - 12/19/2013
View all notes |
Set NEW NOTE alert |
CANSLIM.net Company Profile |
SEC
News |
Chart |
Request a new note
C
A N
S L
I M
|
PCLN
-
NASDAQ
Priceline.Com Inc
INTERNET - Internet Software and Services
|
$1,145.44
|
-16.96
-1.46% |
$1,161.29
|
653,380
111.46% of 50 DAV
50 DAV is 586,200
|
$1,198.75
-4.45%
|
12/18/2013
|
$1,156.20
|
PP = $1,198.85
|
|
MB = $1,258.79
|
Most Recent Note - 1/2/2014 12:55:52 PM
Y - Slumping near prior lows and its 50 DMA line ($1,136.34 now) while enduring mild distributional pressure recently, and subsequent violations may trigger worrisome technical sell signals. Volume-driven gains above the pivot point have not shown up since recently highlighted. Disciplined investors watch for a proper technical buy signal before taking action and always limit losses if any stock falls more than -7% from their buy point.
>>> FEATURED STOCK ARTICLE : Extended From Any Sound Base Pattern - 12/3/2013
View all notes |
Set NEW NOTE alert |
CANSLIM.net Company Profile |
SEC
News |
Chart |
Request a new note
C
A N
S L
I M
|
SFUN
-
NYSE
Soufun Hldgs Ltd Ads A
INTERNET - Internet Information Providers
|
$82.51
|
+0.10
0.12% |
$82.70
|
1,104,582
88.69% of 50 DAV
50 DAV is 1,245,500
|
$84.44
-2.28%
|
10/17/2013
|
$58.02
|
PP = $53.87
|
|
MB = $56.56
|
Most Recent Note - 12/31/2013 5:25:22 PM
G - Perched at all-time highs, still holding its ground stubbornly. Wedged higher since noted in prior reports with caution - "It is extended from any sound base pattern yet may produce more climactic gains. Prior highs and its 50 DMA line coincide in the $59 area defining important support to watch."
>>> FEATURED STOCK ARTICLE : Extended From Base Yet May Produce More Climactic Gains - 12/9/2013
View all notes |
Set NEW NOTE alert |
CANSLIM.net Company Profile |
SEC
News |
Chart |
Request a new note
C
A N
S L
I M
|
SILC
-
NASDAQ
Silicom Ltd
COMPUTER HARDWARE - Networking andamp; Communication Dev
|
$45.31
|
-0.41
-0.90% |
$46.23
|
51,562
120.47% of 50 DAV
50 DAV is 42,800
|
$46.15
-1.82%
|
12/23/2013
|
$44.62
|
PP = $46.25
|
|
MB = $48.56
|
Most Recent Note - 1/2/2014 1:03:09 PM
Y - Challenging its pivot point and hitting a new 52-week high today while on track for a 12th consecutive gain without great volume conviction. Volume should be a minimum of +40% above average behind gains above a stock's pivot point to trigger a proper technical buy signal.
>>> FEATURED STOCK ARTICLE : Stock With Small Supply Has Formed a Sound Base Pattern - 12/24/2013
View all notes |
Set NEW NOTE alert |
CANSLIM.net Company Profile |
SEC
News |
Chart |
Request a new note
C
A N
S L
I M
|
SSNC
-
NASDAQ
S S & C Technologies
COMPUTER SOFTWARE and SERVICES - Application Software
|
$44.54
|
+0.28
0.63% |
$44.63
|
310,375
108.67% of 50 DAV
50 DAV is 285,600
|
$44.26
0.63%
|
10/22/2013
|
$39.17
|
PP = $40.04
|
|
MB = $42.04
|
Most Recent Note - 12/30/2013 5:43:29 PM
G - Finished at a best-ever close after today's 6th consecutive gain with light volume. Found recent support near its 50 DMA line but did not form a sound new base. Recent low ($38.85 on 12/13/13) defines important near-term support to watch below its 50 DMA line.
>>> FEATURED STOCK ARTICLE : Found Prompt Support After Damaging Losses Raised Concerns - 12/16/2013
View all notes |
Set NEW NOTE alert |
CANSLIM.net Company Profile |
SEC
News |
Chart |
Request a new note
C
A N
S L
I M
|
Symbol/Exchange
Company Name
Industry Group |
PRICE |
CHANGE
(%Change) |
Day High |
Volume
(% DAV)
(% 50 day avg vol) |
52 Wk Hi
% From Hi |
Featured
Date |
Price
Featured |
Pivot Featured |
|
Max Buy |
SSYS
-
NASDAQ
Stratasys Ltd
COMPUTER HARDWARE - Computer Peripherals
|
$134.01
|
-0.69
-0.51% |
$135.52
|
865,393
77.96% of 50 DAV
50 DAV is 1,110,100
|
$134.87
-0.64%
|
10/11/2013
|
$102.94
|
PP = $105.38
|
|
MB = $110.65
|
Most Recent Note - 1/2/2014 1:23:37 PM
G - Wedging to another new 52-week high today, rising without great volume conviction behind recent gains. Found recent support at its 50 DMA line. Previously noted with caution - "Reported earnings +13% on +153% sales revenues, below the +25% minimum earnings guideline (C criteria) raising fundamental concerns."
>>> FEATURED STOCK ARTICLE : Rallying From Support at 50-Day Moving Average Line - 12/20/2013
View all notes |
Set NEW NOTE alert |
CANSLIM.net Company Profile |
SEC
News |
Chart |
Request a new note
C
A N
S L
I M
|
ULTI
-
NASDAQ
Ultimate Software Group
INTERNET - Internet Software and Services
|
$152.43
|
-0.79
-0.52% |
$153.91
|
113,898
80.10% of 50 DAV
50 DAV is 142,200
|
$162.88
-6.42%
|
10/16/2013
|
$142.95
|
PP = $151.18
|
|
MB = $158.74
|
Most Recent Note - 1/2/2014 1:28:49 PM
G - Its Relative Strength (RS) Rating has slumped to 80, the minimum rank for buy candidates. Consolidating near its 50 DMA line. The recent low ($144.04 on 12/12/13) define the next near-term support to watch.
>>> FEATURED STOCK ARTICLE : Gain on Light Volume While Inching Above 50-Day Average - 12/26/2013
View all notes |
Set NEW NOTE alert |
CANSLIM.net Company Profile |
SEC
News |
Chart |
Request a new note
C
A N
S L
I M
|
VRX
-
NYSE
Valeant Pharmaceuticals
DRUGS - Drug Manufacturers - Other
|
$116.98
|
-0.42
-0.36% |
$118.12
|
1,936,994
180.15% of 50 DAV
50 DAV is 1,075,200
|
$118.25
-1.07%
|
9/11/2013
|
$100.26
|
PP = $105.50
|
|
MB = $110.78
|
Most Recent Note - 1/2/2014 1:04:44 PM
G - Perched at its 52-week high today with volume running at an above average pace. Resilient after earnings +24% on +74% sales revenues for the Sep '13 quarter came in a notch below the +25% minimum guideline (C criteria).
>>> FEATURED STOCK ARTICLE : Rebounding With Volume Backed Gains But Fundamental Concerns Remain - 12/18/2013
View all notes |
Set NEW NOTE alert |
CANSLIM.net Company Profile |
SEC
News |
Chart |
Request a new note
C
A N
S L
I M
|
YNDX
-
NASDAQ
Yandex N V Class A
INTERNET - Internet Information Providers
|
$42.63
|
-0.52
-1.21% |
$43.34
|
1,724,245
68.34% of 50 DAV
50 DAV is 2,522,900
|
$43.65
-2.34%
|
11/27/2013
|
$39.61
|
PP = $42.10
|
|
MB = $44.21
|
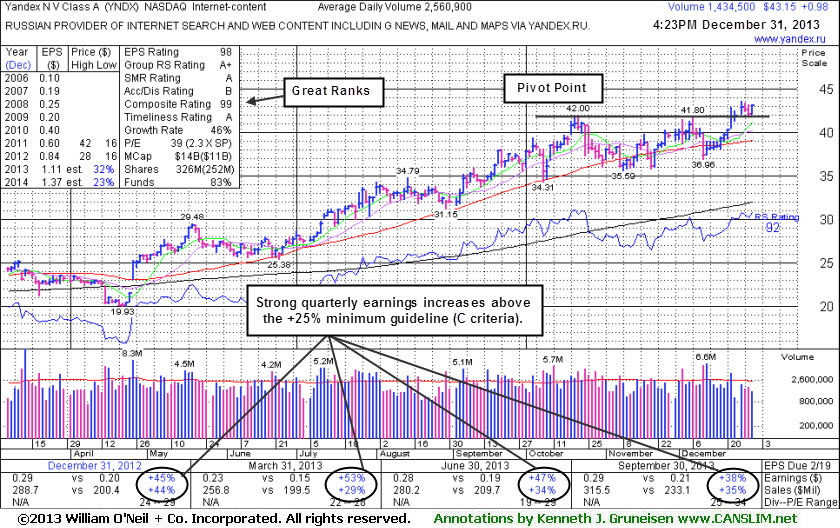
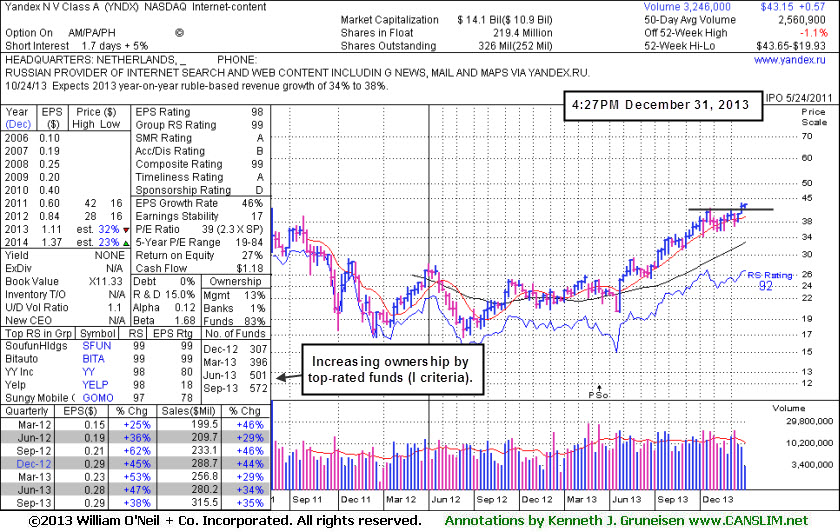
Most Recent Note - 12/31/2013 5:18:33 PM
Y - Rallied for a best ever close with light volume behind today's gain. At least +40% above average volume should be behind gains above the pivot point to trigger a proper new technical buy signal. See the latest FSU analysis for more details and a new annotated graph.
>>> FEATURED STOCK ARTICLE : Best Ever Close With Gain on Light Volume - 12/31/2013
View all notes |
Set NEW NOTE alert |
CANSLIM.net Company Profile |
SEC
News |
Chart |
Request a new note
C
A N
S L
I M
|
|
|
|
THESE ARE NOT BUY RECOMMENDATIONS!
Comments contained in the body of this report are technical
opinions only. The material herein has been obtained
from sources believed to be reliable and accurate, however,
its accuracy and completeness cannot be guaranteed.
This site is not an investment advisor, hence it does
not endorse or recommend any securities or other investments.
Any recommendation contained in this report may not
be suitable for all investors and it is not to be deemed
an offer or solicitation on our part with respect to
the purchase or sale of any securities. All trademarks,
service marks and trade names appearing in this report
are the property of their respective owners, and are
likewise used for identification purposes only.
This report is a service available
only to active Paid Premium Members.
You may opt-out of receiving report notifications
at any time. Questions or comments may be submitted
by writing to Premium Membership Services 665 S.E. 10 Street, Suite 201 Deerfield Beach, FL 33441-5634 or by calling 1-800-965-8307
or 954-785-1121.
|
|
|

