You are not logged in.
This means you
CAN ONLY VIEW reports that were published prior to Monday, April 14, 2025.
You
MUST UPGRADE YOUR MEMBERSHIP if you want to see any current reports.
AFTER MARKET UPDATE - WEDNESDAY, JANUARY 2ND, 2013
Previous After Market Report Next After Market Report >>>
|
|
|
|
DOW |
+308.41 |
13,412.55 |
+2.35% |
|
Volume |
859,080,660 |
+17% |
|
Volume |
2,051,553,270 |
+37% |
|
NASDAQ |
+92.75 |
3,112.26 |
+3.07% |
|
Advancers |
2,840 |
90% |
|
Advancers |
2,206 |
85% |
|
S&P 500 |
+36.23 |
1,462.42 |
+2.54% |
|
Decliners |
280 |
9% |
|
Decliners |
337 |
13% |
|
Russell 2000 |
+24.07 |
873.42 |
+2.83% |
|
52 Wk Highs |
454 |
|
|
52 Wk Highs |
247 |
|
|
S&P 600 |
+12.71 |
489.28 |
+2.67% |
|
52 Wk Lows |
4 |
|
|
52 Wk Lows |
18 |
|
|
 |
Breadth Positive and Volume Increased Behind Big Rally
Kenneth J. Gruneisen - Passed the CAN SLIM® Master's Exam
The Dow Jones Industrial Average, S&P 500 Index, and the Nasdaq Composite Index collectively rallied above their December highs with considerable gains on Wednesday. The volume totals were reported higher on both the NYSE and the Nasdaq exchange, which indicated that more serious institutional buying demand was behind the market's rally. Breadth was solidly positive as advancers led decliners by a 10-1 margin on the NYSE and by more than a 6-1 margin on the Nasdaq exchange. The total number of stocks hitting new 52-week highs swelled considerably and easily outnumbered new 52-week lows on the NYSE and on the Nasdaq exchange. There were 166 high-ranked companies from the CANSLIM.net Leaders List making new 52-week highs and appearing on the CANSLIM.net BreakOuts Page, up considerably from the prior session total of 37 stocks. Any sustainable rally requires a healthy crop of companies hitting new 52-week highs, so it was encouraging to see a great expansion in new leadership. There were gains for 10 of the 13 high-ranked companies currently included on the Featured Stocks Page.
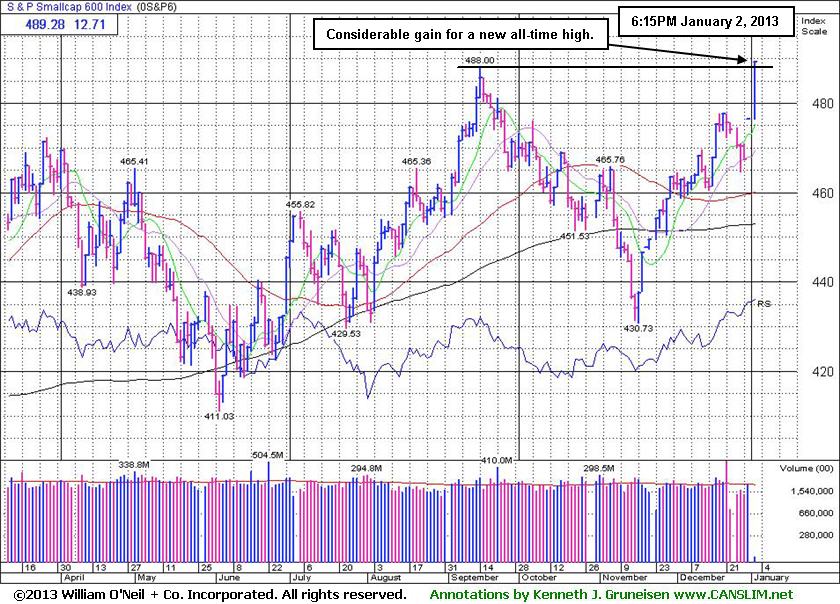
Markets kicked off 2013 on a positive tone. The S&P 500 Index rose to a two-month high, meanwhile the S&P Small Cap 600 and S&P Mid-Cap 400 Indexes both rallied to new all-time highs.
Stocks rallied as investors cheered passage of a budget bill to avert the fiscal cliff of automatic spending cuts and tax increases. However, Moody's warned that further action is needed for the U.S. to maintain its top credit rating. On the economic front, data was mixed. The ISM Manufacturing Index rose in December from a three-year low, but construction spending unexpectedly fell in November.
Overall, all sectors gained ground. Telecommunication was the best performing group as AT&T Inc (T +3.83%) advanced. Technology and financial shares followed closely behind as Apple Inc (AAPL +3.17%) rallied and Bank of America Corp (BAC +3.62%) gained ground. Retailers bucked the uptrend ahead of Thursday's same-store-sales figures as Target Corp (TGT -0.59%) lost and Macy's Inc (M -1.82%) retreated.
In fixed-income, a return to the risk-trade pushed the yield on the 10-year note to its highest level since October as it lost 22/32 to yield 1.84%.
Technically, the market (M criteria) narrowly avoided the label of a full blown "correction" while the uptrend came under recent pressure, and with Monday's solid gains the benchmark S&P 500 Index promptly rebounded above its 50-day moving average (DMA) line, and Nasdaq Composite Index and Dow Jones Industrial Average both promptly rebounded above their respective 50 DMA and 200 DMA lines. investors may consider new buying efforts only in stocks meeting all key criteria.
Watch for an announcement via email concerning the next WEBCAST. The webcast will also be available via an updated link highlighted at the top of the Premium Member Homepage.
PICTURED 1: The S&P Small Cap 600 Index rallied to a new all-time high.
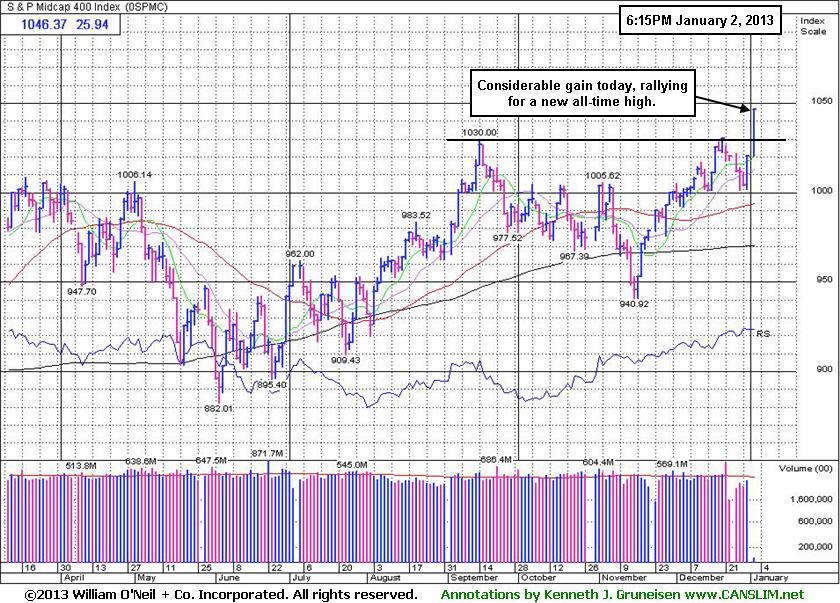
PICTURED 2: The S&P Mid-Cap 400 Index rallied to a new all-time high.
|
 Kenneth J. Gruneisen started out as a licensed stockbroker in August 1987, a couple of months prior to the historic stock market crash that took the Dow Jones Industrial Average down -22.6% in a single day. He has published daily fact-based fundamental and technical analysis on high-ranked stocks online for two decades. Through FACTBASEDINVESTING.COM, Kenneth provides educational articles, news, market commentary, and other information regarding proven investment systems that work in good times and bad.
Comments contained in the body of this report are technical opinions only and are not necessarily those of Gruneisen Growth Corp. The material herein has been obtained from sources believed to be reliable and accurate, however, its accuracy and completeness cannot be guaranteed. Our firm, employees, and customers may effect transactions, including transactions contrary to any recommendation herein, or have positions in the securities mentioned herein or options with respect thereto. Any recommendation contained in this report may not be suitable for all investors and it is not to be deemed an offer or solicitation on our part with respect to the purchase or sale of any securities. |
|
 |
Tech, Financial, and Energy-Related Groups Led Gainers
Kenneth J. Gruneisen - Passed the CAN SLIM® Master's Exam
The tech sector helped lead the market rally on Wednesday as the Semiconductor Index ($SOX +4.08%) set a strong pace, followed by big gains from the Networking Index ($NWX +3.37%), Biotechnology Index ($BTK +3.67%), and the Internet Index ($IIX +3.02%), each of which rose more than +3% on the session. Financial shares also underpinned the major averages' gains as the Broker/Dealer Index ($XBD +3.03%) and the Bank Index ($BKX +3.22%) rose more than +3% each. The Retail Index ($RLX +1.43%) gained ground, and strength in energy-related shares boosted the Integrated Oil Index ($XOI +2.11%) and the Oil Services Index ($OSX +2.61%). The Gold & Silver Index ($XAU +1.73%) also posted a solid gain, meanwhile the Healthcare Index ($HMO +0.53%) was a laggard with its smaller gain.
Charts courtesy www.stockcharts.com
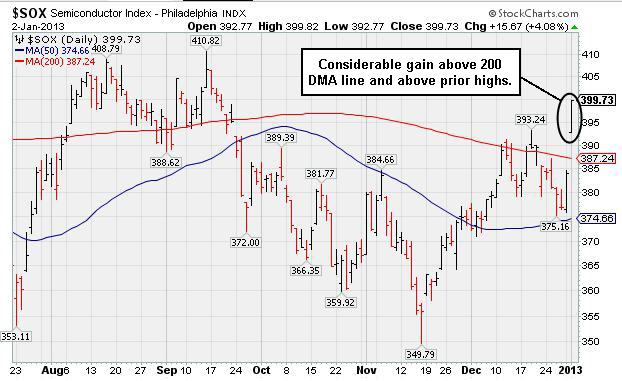
PICTURED: The Semiconductor Index ($SOX +4.08%) gapped up for a considerable gain, rallying above its 200-day moving average (DMA) line and above prior highs. The encouraging action in the tech sector is a reassuring sign, as the tech sector normally contributes leadership to the most bullish market environments.
| Oil Services |
$OSX |
225.91 |
+5.75 |
+2.61% |
+2.61% |
| Healthcare |
$HMO |
2,527.42 |
+13.23 |
+0.53% |
+0.53% |
| Integrated Oil |
$XOI |
1,268.00 |
+26.17 |
+2.11% |
+2.11% |
| Semiconductor |
$SOX |
399.73 |
+15.67 |
+4.08% |
+4.08% |
| Networking |
$NWX |
234.19 |
+7.64 |
+3.37% |
+3.37% |
| Internet |
$IIX |
336.90 |
+9.89 |
+3.02% |
+3.03% |
| Broker/Dealer |
$XBD |
97.19 |
+2.86 |
+3.03% |
+3.04% |
| Retail |
$RLX |
662.39 |
+9.33 |
+1.43% |
+1.43% |
| Gold & Silver |
$XAU |
168.47 |
+2.87 |
+1.73% |
+1.73% |
| Bank |
$BKX |
52.93 |
+1.65 |
+3.22% |
+3.22% |
| Biotech |
$BTK |
1,603.75 |
+56.71 |
+3.67% |
+3.67% |
|
|
|
 |
Held Ground Following Prior Breakout; Getting Extended Now
Kenneth J. Gruneisen - Passed the CAN SLIM® Master's Exam
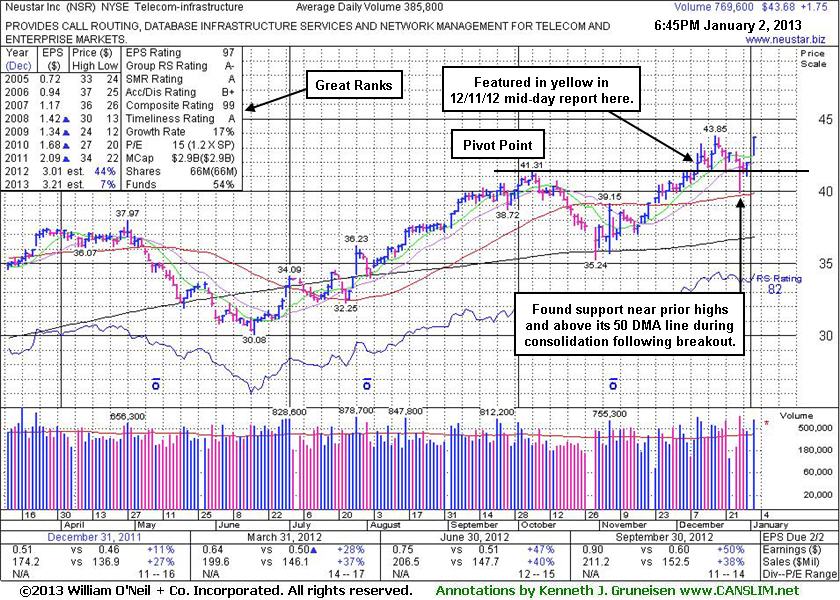
Neustar Inc (NSR +$1.75 or +4.17% to $43.68) gapped up today and rallied above its "max buy" level with a volume-driven gain and its color code was changed to green. Subsequent deterioration below its old high close ($41.05 on 10/05/12) could negate its recent breakout, a worrisome sign. Disciplined investors know to avoid chasing extended stocks more than +5% above their pivot point, and they always sell if ever any stock falls more than -7% from their purchase price to properly manage risk under the fact-based system's guidelines.
Leadership from a couple of other high-ranked leaders in the Telecom - Infrastructure group is a reassuring sign (concerning the L criteria) and its Group Relative Strength Rating has improved to a 79 from a 61 rating since last shown in this FSU section on 12/11/12 with an annotated graph under the headline, "Featured in Mid-day Report and Finished With Strong Gain Above Pivot Point". Its 12/11/12 gain on heavy volume +172% above average clinched a technical buy signal. It rose from a 10-week base during which it found support at its 200-day moving average (DMA) line. Quarterly comparisons through Sep '12 showed 3 consecutive increases of more than the +25% minimum earnings guideline (C criteria).
The number of top-rated funds owning its shares rose from 404 in Dec '11 to 421 in Sep '12, a slightly reassuring trend concerning the I criteria. Its Return On Equity is reported at 29%, well above the 17% minimum guideline. Its small supply of 66 million shares (S criteria) outstanding can lead to greater price volatility if the institutional crowd rushes to accumulate shares, or if they decide to leave.
|
|
|
Color Codes Explained :
Y - Better candidates highlighted by our
staff of experts.
G - Previously featured
in past reports as yellow but may no longer be buyable under the
guidelines.
***Last / Change / Volume data in this table is the closing quote data***
Symbol/Exchange
Company Name
Industry Group |
PRICE |
CHANGE
(%Change) |
Day High |
Volume
(% DAV)
(% 50 day avg vol) |
52 Wk Hi
% From Hi |
Featured
Date |
Price
Featured |
Pivot Featured |
|
Max Buy |
CELG
-
NASDAQ
Celgene Corp
DRUGS - Drug Manufacturers - Major
|
$81.10
|
+2.63
3.35% |
$81.10
|
4,007,915
142.82% of 50 DAV
50 DAV is 2,806,300
|
$82.78
-2.03%
|
12/11/2012
|
$82.24
|
PP = $81.34
|
|
MB = $85.41
|
 Most Recent Note - 1/2/2013 4:05:27 PM
Y - Gapped up today and tallied a solid gain with slightly above average volume, rallying back near its pivot point. Its 50 DMA acted as support during the recent consolidation.
>>> The latest Featured Stock Update with an annotated graph appeared on 12/12/2012. Click here.
View all notes |
Alert me of new notes |
CANSLIM.net Company Profile |
SEC |
Zacks Reports |
StockTalk |
News |
Chart |
Request a new note
C
A N
S L
I M


|
CFNL
-
NASDAQ
Cardinal Financial Corp
BANKING - Regional - Southeast Banks
|
$16.68
|
+0.38
2.33% |
$16.90
|
364,713
171.63% of 50 DAV
50 DAV is 212,500
|
$16.66
0.12%
|
12/3/2012
|
$15.20
|
PP = $16.31
|
|
MB = $17.13
|
Most Recent Note - 1/2/2013 4:07:21 PM
Y - Today's gain for a new 52-week high cleared its pivot point with sufficient volume to trigger a proper new (or add-on) technical buy signal.
>>> The latest Featured Stock Update with an annotated graph appeared on 12/31/2012. Click here.
View all notes |
Alert me of new notes |
CANSLIM.net Company Profile |
SEC |
Zacks Reports |
StockTalk |
News |
Chart |
Request a new note
C
A N
S L
I M
|
CMCSA
-
NASDAQ
Comcast Corp Cl A
MEDIA - CATV Systems
|
$38.52
|
+1.16
3.10% |
$38.57
|
17,623,105
147.51% of 50 DAV
50 DAV is 11,947,100
|
$38.22
0.78%
|
12/3/2012
|
$37.08
|
PP = $38.06
|
|
MB = $39.96
|
Most Recent Note - 1/2/2013 4:08:50 PM
Y - Today's gain above its pivot point had sufficient volume to trigger a technical buy signal. No resistance remains due to overhead supply.
>>> The latest Featured Stock Update with an annotated graph appeared on 12/27/2012. Click here.
View all notes |
Alert me of new notes |
CANSLIM.net Company Profile |
SEC |
Zacks Reports |
StockTalk |
News |
Chart |
Request a new note
C
A N
S L
I M
|
LULU
-
NASDAQ
Lululemon Athletica
MANUFACTURING - Textile Manufacturing
|
$74.02
|
-2.21
-2.90% |
$77.96
|
3,115,024
162.53% of 50 DAV
50 DAV is 1,916,600
|
$81.09
-8.72%
|
12/26/2012
|
$73.81
|
PP = $77.95
|
|
MB = $81.85
|
Most Recent Note - 1/2/2013 4:10:10 PM
Y - Negative reversal for a loss with average volume today raises concerns. Subsequent volume-driven gains above its pivot point are still needed to trigger a new technical buy signal.
>>> The latest Featured Stock Update with an annotated graph appeared on 12/28/2012. Click here.
View all notes |
Alert me of new notes |
CANSLIM.net Company Profile |
SEC |
Zacks Reports |
StockTalk |
News |
Chart |
Request a new note
C
A N
S L
I M
|
MIDD
-
NASDAQ
Middleby Corp
MANUFACTURING - Diversified Machinery
|
$131.39
|
+3.18
2.48% |
$133.80
|
133,510
154.35% of 50 DAV
50 DAV is 86,500
|
$134.51
-2.32%
|
10/8/2012
|
$118.46
|
PP = $122.67
|
|
MB = $128.80
|
Most Recent Note - 1/2/2013 4:11:05 PM
G - Gapped up today and challenged its 52-week and all-time high with a volume-driven gain. Earnings +23% on +18% sales for the Sep '12 quarter, below the +25% minimum earnings guideline (C criteria), raised concerns.
>>> The latest Featured Stock Update with an annotated graph appeared on 12/26/2012. Click here.
View all notes |
Alert me of new notes |
CANSLIM.net Company Profile |
SEC |
Zacks Reports |
StockTalk |
News |
Chart |
Request a new note
C
A N
S L
I M
|
Symbol/Exchange
Company Name
Industry Group |
PRICE |
CHANGE
(%Change) |
Day High |
Volume
(% DAV)
(% 50 day avg vol) |
52 Wk Hi
% From Hi |
Featured
Date |
Price
Featured |
Pivot Featured |
|
Max Buy |
N
-
NYSE
Netsuite Inc
DIVERSIFIED SERVICES - Business/Management Services
|
$69.00
|
+1.70
2.53% |
$70.06
|
352,085
78.47% of 50 DAV
50 DAV is 448,700
|
$67.82
1.74%
|
12/12/2012
|
$64.75
|
PP = $67.12
|
|
MB = $70.48
|
Most Recent Note - 1/2/2013 4:12:36 PM
Y - Gapped up today and hit a new high while trading above its pivot point, however the gain was marked by light volume. Disciplined investors know that volume must be at least +40% above average behind gains above the pivot point to trigger a proper technical buy signal.
>>> The latest Featured Stock Update with an annotated graph appeared on 12/13/2012. Click here.
View all notes |
Alert me of new notes |
CANSLIM.net Company Profile |
SEC |
Zacks Reports |
StockTalk |
News |
Chart |
Request a new note
C
A N
S L
I M
|
NSR
-
NYSE
Neustar Inc
TELECOMMUNICATIONS - Diversified Communication Serv
|
$43.68
|
+1.75
4.17% |
$43.70
|
769,632
199.49% of 50 DAV
50 DAV is 385,800
|
$43.85
-0.39%
|
12/11/2012
|
$41.85
|
PP = $41.41
|
|
MB = $43.48
|
Most Recent Note - 1/2/2013 4:14:55 PM
G - Gapped up and rallied above its "max buy" level with a volume-driven gain and its color code is changed to green. Subsequent deterioration below its old high close ($41.05 on 10/05/12) could negate its recent breakout, a worrisome sign.
>>> The latest Featured Stock Update with an annotated graph appeared on 1/2/2013. Click here.
View all notes |
Alert me of new notes |
CANSLIM.net Company Profile |
SEC |
Zacks Reports |
StockTalk |
News |
Chart |
Request a new note
C
A N
S L
I M
|
RAX
-
NYSE
Rackspace Hosting Inc
INTERNET - Internet Software and; Services
|
$77.06
|
+2.79
3.76% |
$77.09
|
1,028,833
70.20% of 50 DAV
50 DAV is 1,465,600
|
$74.78
3.05%
|
12/18/2012
|
$71.88
|
PP = $70.10
|
|
MB = $73.61
|
Most Recent Note - 1/2/2013 4:17:04 PM
G - Wedged to a new all-time high above its "max buy" level with today's gain lacking great volume conviction and its color code is changed to green. Prior highs in the $70 area define initial support to watch following its recent breakout.
>>> The latest Featured Stock Update with an annotated graph appeared on 12/18/2012. Click here.
View all notes |
Alert me of new notes |
CANSLIM.net Company Profile |
SEC |
Zacks Reports |
StockTalk |
News |
Chart |
Request a new note
C
A N
S L
I M
|
RNF
-
NYSE
Rentech Nitrogen Ptnr Lp
CHEMICALS - Agricultural Chemicals
|
$38.94
|
+1.25
3.32% |
$40.00
|
421,747
146.39% of 50 DAV
50 DAV is 288,100
|
$41.15
-5.37%
|
11/1/2012
|
$39.11
|
PP = $40.15
|
|
MB = $42.16
|
Most Recent Note - 1/2/2013 12:09:40 PM
Y - Off earlier highs following a gap up today that had it trading near its pivot point and challenging previously stubborn resistance in the $40 area. While patient investors may still be watching for a technical buy signal, a violation of its recent low ($36.06 on 12/18/12) would raise more serious concerns and could trigger a technical sell signal.
>>> The latest Featured Stock Update with an annotated graph appeared on 12/19/2012. Click here.
View all notes |
Alert me of new notes |
CANSLIM.net Company Profile |
SEC |
Zacks Reports |
StockTalk |
News |
Chart |
Request a new note
C
A N
S L
I M
|
ULTA
-
NASDAQ
Ulta Salon Cosm & Frag
SPECIALTY RETAIL - Specialty Retail, Other
|
$101.53
|
+3.27
3.33% |
$102.48
|
1,190,215
154.47% of 50 DAV
50 DAV is 770,500
|
$103.52
-1.92%
|
12/4/2012
|
$100.29
|
PP = $103.62
|
|
MB = $108.80
|
Most Recent Note - 1/2/2013 4:21:30 PM
Y - Challenging its 52-week high and previously stubborn resistance with a volume-driven gain today. Its 50 DMA line recently acted as support. Its Relative Strength line did not recently lead the way and confirm a move into new high territory.
>>> The latest Featured Stock Update with an annotated graph appeared on 12/21/2012. Click here.
View all notes |
Alert me of new notes |
CANSLIM.net Company Profile |
SEC |
Zacks Reports |
StockTalk |
News |
Chart |
Request a new note
C
A N
S L
I M
|
Symbol/Exchange
Company Name
Industry Group |
PRICE |
CHANGE
(%Change) |
Day High |
Volume
(% DAV)
(% 50 day avg vol) |
52 Wk Hi
% From Hi |
Featured
Date |
Price
Featured |
Pivot Featured |
|
Max Buy |
VRX
-
NYSE
Valeant Pharmaceuticals
DRUGS - Drug Manufacturers - Other
|
$60.75
|
+0.98
1.64% |
$61.61
|
2,440,491
169.94% of 50 DAV
50 DAV is 1,436,100
|
$61.11
-0.59%
|
12/20/2012
|
$60.24
|
PP = $61.21
|
|
MB = $64.27
|
Most Recent Note - 1/2/2013 4:24:07 PM
Y - Gapped up for a gain on higher volume today, but it finished at the session low and below its pivot point. It stalled and encountered mild distributional pressure after highlighted in yellow in the 12/20/12 mid-day report, encountering stubborn resistance in the $60-61 area. Disciplined investors may watch for a volume-driven gain above its pivot point to trigger a technical buy signal before taking action.
>>> The latest Featured Stock Update with an annotated graph appeared on 12/20/2012. Click here.
View all notes |
Alert me of new notes |
CANSLIM.net Company Profile |
SEC |
Zacks Reports |
StockTalk |
News |
Chart |
Request a new note
C
A N
S L
I M
|
VSI
-
NYSE
Vitamin Shoppe Inc
SPECIALTY RETAIL - Specialty Retail, Other
|
$56.08
|
-1.28
-2.23% |
$58.77
|
665,278
264.63% of 50 DAV
50 DAV is 251,400
|
$61.89
-9.39%
|
12/3/2012
|
$59.06
|
PP = $61.99
|
|
MB = $65.09
|
Most Recent Note - 1/2/2013 4:25:58 PM
G - Reversed into the red for worrisome loss on higher volume after starting in positive territory today. Prior lows and its 200 DMA line define important near-term support to watch in the $53 area. It faces resistance due to overhead supply up through the $61 level which has been a stubborn resistance level in recent months.
>>> The latest Featured Stock Update with an annotated graph appeared on 12/24/2012. Click here.
View all notes |
Alert me of new notes |
CANSLIM.net Company Profile |
SEC |
Zacks Reports |
StockTalk |
News |
Chart |
Request a new note
C
A N
S L
I M
|
WPI
-
NYSE
Watson Pharmaceuticals
DRUGS - Drugs - Generic
|
$84.21
|
-1.79
-2.08% |
$86.83
|
4,173,239
523.62% of 50 DAV
50 DAV is 797,000
|
$91.47
-7.94%
|
12/17/2012
|
$87.99
|
PP = $90.49
|
|
MB = $95.01
|
Most Recent Note - 1/2/2013 12:23:20 PM
G - Slumping further below its 50 DMA line today with another damaging volume-driven loss. Monday's loss triggered a technical sell signal, and its color code was changed to green. It stalled after the gain with +122% above average volume for a new 52-week high on 12/21/12 clinched a technical buy signal.
>>> The latest Featured Stock Update with an annotated graph appeared on 12/17/2012. Click here.
View all notes |
Alert me of new notes |
CANSLIM.net Company Profile |
SEC |
Zacks Reports |
StockTalk |
News |
Chart |
Request a new note
C
A N
S L
I M
|
|
|
|
THESE ARE NOT BUY RECOMMENDATIONS!
Comments contained in the body of this report are technical
opinions only. The material herein has been obtained
from sources believed to be reliable and accurate, however,
its accuracy and completeness cannot be guaranteed.
This site is not an investment advisor, hence it does
not endorse or recommend any securities or other investments.
Any recommendation contained in this report may not
be suitable for all investors and it is not to be deemed
an offer or solicitation on our part with respect to
the purchase or sale of any securities. All trademarks,
service marks and trade names appearing in this report
are the property of their respective owners, and are
likewise used for identification purposes only.
This report is a service available
only to active Paid Premium Members.
You may opt-out of receiving report notifications
at any time. Questions or comments may be submitted
by writing to Premium Membership Services 665 S.E. 10 Street, Suite 201 Deerfield Beach, FL 33441-5634 or by calling 1-800-965-8307
or 954-785-1121.
|
|
|

