You are not logged in.
This means you
CAN ONLY VIEW reports that were published prior to Wednesday, April 9, 2025.
You
MUST UPGRADE YOUR MEMBERSHIP if you want to see any current reports.
AFTER MARKET UPDATE - WEDNESDAY, DECEMBER 28TH, 2022
Previous After Market Report Next After Market Report >>>
|
|
|
|
DOW |
-365.85 |
32,875.71 |
-1.10% |
|
Volume |
3,140,133,034 |
+434% |
|
Volume |
3,947,670,149 |
+12% |
|
NASDAQ |
-139.94 |
10,213.29 |
-1.35% |
|
Advancers |
1,551 |
33% |
|
Advancers |
718 |
23% |
|
S&P 500 |
-46.03 |
3,783.22 |
-1.20% |
|
Decliners |
3,089 |
67% |
|
Decliners |
2,455 |
77% |
|
Russell 2000 |
-27.49 |
1,722.02 |
-1.57% |
|
52 Wk Highs |
62 |
|
|
52 Wk Highs |
99 |
|
|
S&P 600 |
-21.95 |
1,137.71 |
-1.89% |
|
52 Wk Lows |
180 |
|
|
52 Wk Lows |
508 |
|
|
The market is in a correction (M criteria). Thin leadership was a recent warning sign as weakness in the major averages was noted.
Unfortunately a server failure over the holiday weekend disabled some critical website functions. As a consequence we could not publish the usual mid-day and after market reports for Tuesday and mid-day Wednesday. We apologize for any inconvenience this may be to our members and we greatly appreciate your patience while we are still working to restore our systems.
|
 |
Damage Mounts and Major Indices Signal a Worrisome Correction
Kenneth J. Gruneisen - Passed the CAN SLIM® Master's Exam
The Dow shed 365 points, while the Nasdaq Composite fell 1.4%. The S&P 500 slid 1.2%, with all sectors finishing in negative territory. Volume totals were higher than the prior session on the NYSE and on the Nasdaq exchange. Decliners led advancers by more than a 3-1 margin on the NYSE and by a 2-1 margin on the Nasdaq exchange. There were no high-ranked companies from the Leaders List that hit new 52-week highs and were listed on the BreakOuts Page. New 52-week lows totals expanded and solidly outnumbered new 52-week highs totals on the NYSE and on the Nasdaq exchange. The market is in a correction (M criteria). Disciplined investors know to avoid new buying, reduce exposure and raise cash until a new confirmed rally with a solid follow-through day is noted. Chart courtesy of www.stockcharts.com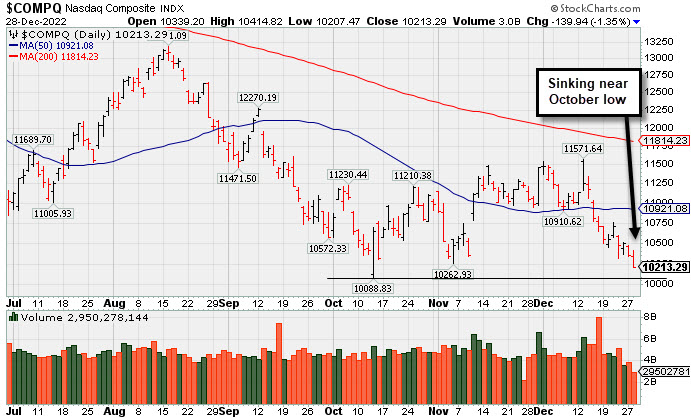 PICTURED: The Nasdaq Composite Index sank further below its 50-day and 200-day moving average (DMA) lines to a new low close near the October 13th low. It is currently perched -37% off its November 22, 2021 record high.
U.S. equities finished lower as hopes for a year-end rally dwindled. Investors continued to assess the 2023 economic outlook and the possibility for a recession in the coming months. As the year winds down, equities are on pace for their worst year since 2008.
On the data front, pending home sales fell 4% month-over-month in November to its second-lowest level on record, signaling further slowdown in the real estate market. The Richmond Federal Reserve (Fed) manufacturing index came in at 1 in December, up from November’s -9 print. The report cited shipments, new orders, and the job outlook as key drivers behind the improved print. In corporate news, Southwest Airlines Co continued to cancel flights today after canceling over 70% of its flights earlier in the week. The airline is facing scrutiny from the federal government over its large-scale cancelations.
Longer-dated Treasuries weakened, with the yield on the benchmark 10-year note climbed three basis points (0.03%) to 3.88%, while the 30-year bond advanced two basis points (0.02%) to 3.96%. The yield on the more policy-sensitive two-year note shed four basis points (0.04%) to 4.35%. In commodities, West Texas Intermediate (WTI) crude fell 1.1% to $78.62/barrel amid a surge of COVID-19 cases in China. Despite easing COVID-19 restrictions from the world’s largest cruder importer, investors are concerned a surge of cases may impact oil demand.
|
 Kenneth J. Gruneisen started out as a licensed stockbroker in August 1987, a couple of months prior to the historic stock market crash that took the Dow Jones Industrial Average down -22.6% in a single day. He has published daily fact-based fundamental and technical analysis on high-ranked stocks online for two decades. Through FACTBASEDINVESTING.COM, Kenneth provides educational articles, news, market commentary, and other information regarding proven investment systems that work in good times and bad.
Comments contained in the body of this report are technical opinions only and are not necessarily those of Gruneisen Growth Corp. The material herein has been obtained from sources believed to be reliable and accurate, however, its accuracy and completeness cannot be guaranteed. Our firm, employees, and customers may effect transactions, including transactions contrary to any recommendation herein, or have positions in the securities mentioned herein or options with respect thereto. Any recommendation contained in this report may not be suitable for all investors and it is not to be deemed an offer or solicitation on our part with respect to the purchase or sale of any securities. |
|
 |
Commodity-Linked Groups, Retail, and Tech Indexes Led Decliners
Kenneth J. Gruneisen - Passed the CAN SLIM® Master's Exam
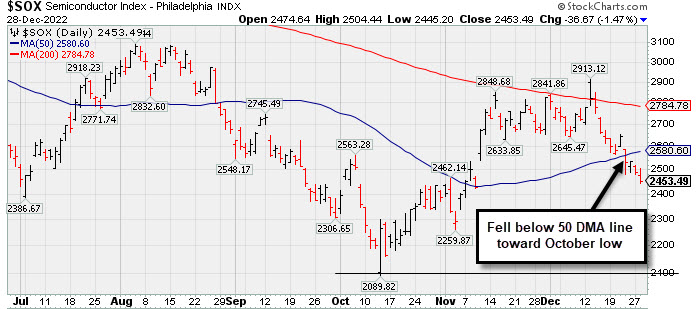
The Bank Index ($BKX -0.31%) and Broker/Dealer Index ($XBD -0.64%) both edged lower and the Retail Index ($RLX -1.08%) also lost ground weighing on the major averages. The tech sector had a negative bias as the Semiconductor Index ($SOX-1.47%), Networking Index ($NWX-1.28%), and Biotech Index ($BTK-0.67%) each lost ground. Commodity-linked groups were especially weak as the Oil Services Index ($OSX-3.11%), Integrated Oil Index ($XOI-2.35%), and Gold & Silver Index ($XAU -3.02%) indexes each lost considerable ground.
PICTURED: The Semiconductor Index ($SOX-1.47%) recently fell below its 50-day moving average (DMA) line toward the October low.
| Oil Services |
$OSX |
81.35 |
-2.61 |
-3.11% |
+58.29% |
| Integrated Oil |
$XOI |
1,759.32 |
-42.42 |
-2.35% |
+51.43% |
| Semiconductor |
$SOX |
2,453.49 |
-36.67 |
-1.47% |
-35.75% |
| Networking |
$NWX |
761.74 |
-9.89 |
-1.28% |
-20.30% |
| Broker/Dealer |
$XBD |
443.25 |
-2.85 |
-0.64% |
-7.48% |
| Retail |
$RLX |
2,715.14 |
-29.75 |
-1.08% |
-34.44% |
| Gold & Silver |
$XAU |
121.07 |
-3.78 |
-3.02% |
-7.97% |
| Bank |
$BKX |
99.34 |
-0.31 |
-0.31% |
-24.90% |
| Biotech |
$BTK |
5,159.04 |
-35.04 |
-0.67% |
-4.03% |
|
|
|
 |
|
|
|
Color Codes Explained :
Y - Better candidates highlighted by our
staff of experts.
G - Previously featured
in past reports as yellow but may no longer be buyable under the
guidelines.
***Last / Change / Volume data in this table is the closing quote data***
|
|
|
THESE ARE NOT BUY RECOMMENDATIONS!
Comments contained in the body of this report are technical
opinions only. The material herein has been obtained
from sources believed to be reliable and accurate, however,
its accuracy and completeness cannot be guaranteed.
This site is not an investment advisor, hence it does
not endorse or recommend any securities or other investments.
Any recommendation contained in this report may not
be suitable for all investors and it is not to be deemed
an offer or solicitation on our part with respect to
the purchase or sale of any securities. All trademarks,
service marks and trade names appearing in this report
are the property of their respective owners, and are
likewise used for identification purposes only.
This report is a service available
only to active Paid Premium Members.
You may opt-out of receiving report notifications
at any time. Questions or comments may be submitted
by writing to Premium Membership Services 665 S.E. 10 Street, Suite 201 Deerfield Beach, FL 33441-5634 or by calling 1-800-965-8307
or 954-785-1121.
|
|
|