You are not logged in.
This means you
CAN ONLY VIEW reports that were published prior to Wednesday, April 9, 2025.
You
MUST UPGRADE YOUR MEMBERSHIP if you want to see any current reports.
AFTER MARKET UPDATE - FRIDAY, DECEMBER 26TH, 2014
Previous After Market Report Next After Market Report >>>
|
|
|
|
DOW |
+23.50 |
18,053.71 |
+0.13% |
|
Volume |
435,834,820 |
+28% |
|
Volume |
870,496,530 |
+29% |
|
NASDAQ |
+33.39 |
4,806.86 |
+0.70% |
|
Advancers |
2,051 |
65% |
|
Advancers |
1,794 |
64% |
|
S&P 500 |
+6.89 |
2,088.77 |
+0.33% |
|
Decliners |
1,015 |
32% |
|
Decliners |
932 |
33% |
|
Russell 2000 |
+8.42 |
1,215.21 |
+0.70% |
|
52 Wk Highs |
236 |
|
|
52 Wk Highs |
140 |
|
|
S&P 600 |
+4.78 |
699.86 |
+0.69% |
|
52 Wk Lows |
20 |
|
|
52 Wk Lows |
31 |
|
|
 |
Indices Rose For Another Record High
Kenneth J. Gruneisen - Passed the CAN SLIM® Master's Exam
With Friday's advance, the major averages extended their winning streak to a second week. The Dow rose +1.4% while the S&P 500 and NASDAQ Composite both gained +0.9%. The volume totals on the NYSE and on the Nasdaq exchange were below average, yet up from Wednesday's shortened session totals. Advancers led decliners by a 2-1 margin on the Nasdaq exchange and on the NYSE. There were 88 high-ranked companies from the CANSLIM.net Leaders List that made new 52-week highs and appeared on the CANSLIM.net BreakOuts Page, up from the prior session total of 73 stocks. New 52-week highs expanded and outnumbered new 52-week lows on the NYSE and on the Nasdaq exchange. There gains for 7 of the 10 high-ranked companies currently on the Featured Stocks Page, a list that has recently been getting trimmed.
New highs for the Dow Jones Industrial Average and S&P 500 Index, coupled with more leadership, signaled that the market (M criteria) is back in a confirmed uptrend. Remember that new buying efforts should only be made in stocks meeting all fundamental and technical guidelines of the fact-based investment system.
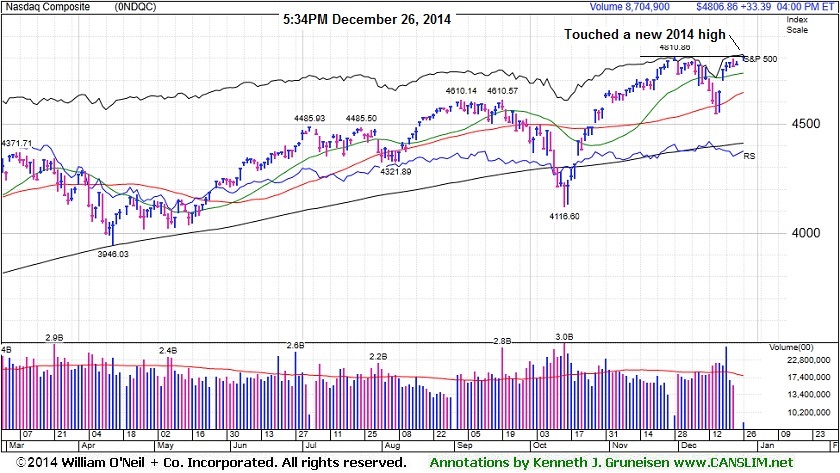
PICTURED: The NASDAQ Composite touched a new 2014 high and finished up 33 points to 4,806.
Stocks rose on Friday’s session. The Dow gained 24 points to hit an all-time high of 18,053. The S&P 500 advanced 7 points to close at a record level of 2,088.
The major averages ended a holiday-shortened week on a positive note bolstered by continued investor optimism surrounding the U.S. economy. U.S. equity market climbed this week after third-quarter GDP was revised to a 5% annualized rate, its fastest pace in 11 years. Friday's session was relatively quiet with no economic data releases.
Nine of 10 sectors were up on the session. Utilities were the best performing group. Sempra Energy (SRE +2.47%) and NiSource (NI +2.32%) rose. Biotech helped boost health care higher as Gilead Sciences (GILD +2.74%) and Celgene (CELG +3.42%) rose. Energy was the sector lower as oil resumed its decline. Shares of Newfield Exploration (NFX -3.19%) as WTI crude fell -1.8% to $54.86/barrel on the NYMEX.
Treasuries were higher with the benchmark 10-year note up 5/32 to yield 2.25%. In commodities, COMEX gold futures climbed 1.9% to $1,195.30/ounce.
Disciplined investors know that new buying efforts should only be made in stocks when all fundamental and technical guidelines are met. This should be done as the stock is breaking out of a sound base pattern. Historic studies have shown that odds are not as favorable for investors when buying stocks on pullbacks.
The Featured Stocks Page shows recent notes and Headline Links directing members to detailed analysis with data-packed graphs annotated by a Certified expert. See the Premium Member Homepage for archives to all prior pay reports published.
|
 Kenneth J. Gruneisen started out as a licensed stockbroker in August 1987, a couple of months prior to the historic stock market crash that took the Dow Jones Industrial Average down -22.6% in a single day. He has published daily fact-based fundamental and technical analysis on high-ranked stocks online for two decades. Through FACTBASEDINVESTING.COM, Kenneth provides educational articles, news, market commentary, and other information regarding proven investment systems that work in good times and bad.
Comments contained in the body of this report are technical opinions only and are not necessarily those of Gruneisen Growth Corp. The material herein has been obtained from sources believed to be reliable and accurate, however, its accuracy and completeness cannot be guaranteed. Our firm, employees, and customers may effect transactions, including transactions contrary to any recommendation herein, or have positions in the securities mentioned herein or options with respect thereto. Any recommendation contained in this report may not be suitable for all investors and it is not to be deemed an offer or solicitation on our part with respect to the purchase or sale of any securities. |
|
 |
Gold & Silver, Biotech, and Retail Indexes Led Gainers
Kenneth J. Gruneisen - Passed the CAN SLIM® Master's Exam
The Retail Index ($RLX +0.48%) was a positive influence on the major averages while the Bank Index ($BKX +0.03%) and the Broker/Dealer Index ($XBD +0.04%) both finished flat. Energy-linked shares posted small gains as the Integrated Oil Index ($XOI +0.19%) and the Oil Services Index ($OSX +0.34%) both edged higher. The Biotechnology Index ($BTK +2.47%) led the tech sector while the Semiconductor Index ($SOX +0.09%) and Networking Index ($NWX +0.10%) inched higher.
Charts courtesy www.stockcharts.com
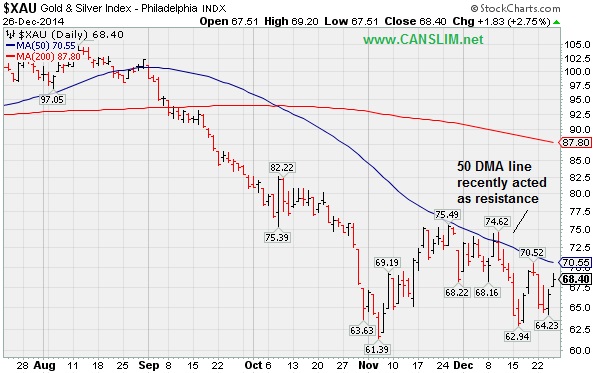
PICTURED: The Gold & Silver Index ($XAU +2.73%) was a standout gainer on Friday. Its 50-day moving average (DMA) line recently acted as resistance when trying to rebound from multi-year lows.
| Oil Services |
$OSX |
213.97 |
+0.72 |
+0.34% |
-23.86% |
| Integrated Oil |
$XOI |
1,366.47 |
+2.64 |
+0.19% |
-9.09% |
| Semiconductor |
$SOX |
697.00 |
+0.65 |
+0.09% |
+30.27% |
| Networking |
$NWX |
364.79 |
+0.38 |
+0.10% |
+12.61% |
| Broker/Dealer |
$XBD |
186.69 |
+0.07 |
+0.04% |
+16.28% |
| Retail |
$RLX |
1,026.96 |
+4.90 |
+0.48% |
+9.27% |
| Gold & Silver |
$XAU |
68.40 |
+1.82 |
+2.73% |
-18.72% |
| Bank |
$BKX |
74.85 |
+0.02 |
+0.03% |
+8.07% |
| Biotech |
$BTK |
3,485.46 |
+83.94 |
+2.47% |
+49.56% |
|
|
|
 |
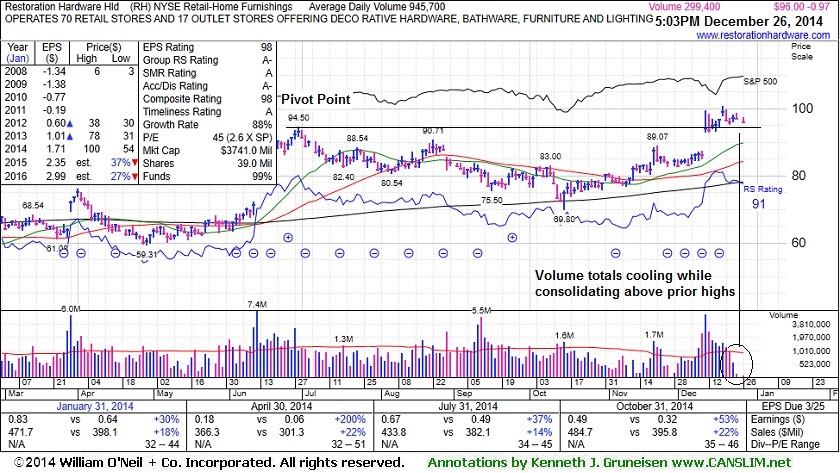
Consolidating Above Prior Highs With Volume Totals Cooling
Kenneth J. Gruneisen - Passed the CAN SLIM® Master's Exam
Restoration Hardware Hld (RH -$0.97 or -1.00% to $96.00) has seen volume totals cooling while consolidating below its "max buy" level. Subsequent losses leading to a close below its old high close ($93.05 on 6/30/14) would completely negate the recent breakout and raise concerns.
It was last shown in this FSU section on 12/11/14 with annotated graphs under the headline, "Close in Lower Third of Intra-day Range Indicates Distributional Pressure", after highlighted in yellow with a pivot point cited based on its 6/30/14 high plus 10 cents in the earlier mid-day report (read here). Convincing volume-driven gains helped clinch a convincing technical buy signal.
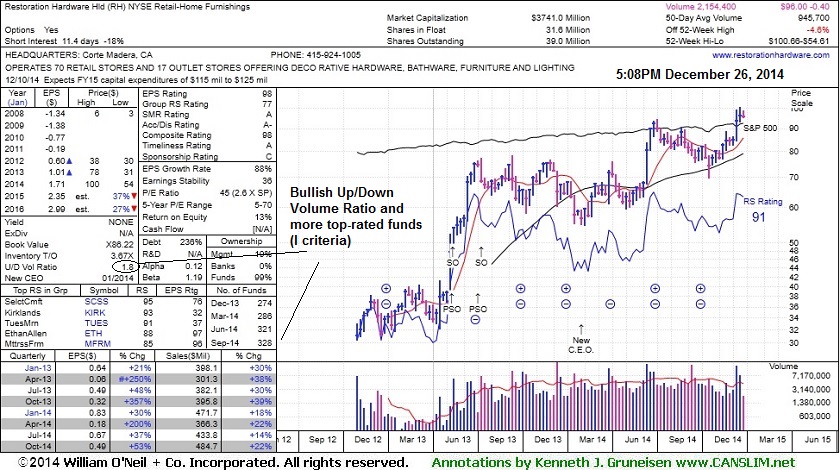
It reported that Oct '14 earnings rose +53% on +22% sales revenues versus the year ago period, continuing its streak of strong quarterly earnings above the +25% minimum guideline (C criteria). Its annual earnings (A criteria) growth has been very strong since reorganization and trading began on 11/02/12. It completed a Secondary Offering 7/12/13 and named a new CEO 1/31/14. Its Up/Down Volume Ratio of 1.8 is an unbiased indication its shares have been under accumulation over the past 50 days. The number of top-rated funds owning its shares rose from 274 in Dec '13 to 328 in Sep '14, a reassuring sign of increasing institutional interest (I criteria).
|
|
|
Color Codes Explained :
Y - Better candidates highlighted by our
staff of experts.
G - Previously featured
in past reports as yellow but may no longer be buyable under the
guidelines.
***Last / Change / Volume data in this table is the closing quote data***
Symbol/Exchange
Company Name
Industry Group |
PRICE |
CHANGE
(%Change) |
Day High |
Volume
(% DAV)
(% 50 day avg vol) |
52 Wk Hi
% From Hi |
Featured
Date |
Price
Featured |
Pivot Featured |
|
Max Buy |
ACT
-
NYSE
Actavis plc
Medical-Generic Drugs
|
$257.09
|
+2.89
1.14% |
$258.15
|
968,667
31.12% of 50 DAV
50 DAV is 3,113,000
|
$272.75
-5.74%
|
6/20/2014
|
$216.53
|
PP = $230.87
|
|
MB = $242.41
|
Most Recent Note - 12/22/2014 6:07:58 PM
G - Pulled back on lighter volume today following 3 consecutive gains on higher volume. Extended from prior highs in the $249 area defining near-term support.
>>> FEATURED STOCK ARTICLE : Consolidating After Rally on Acquisition Plans - 12/12/2014
View all notes |
Set NEW NOTE alert |
CANSLIM.net Company Profile |
SEC
News |
Chart |
Request a new note
C
A N
S L
I M


|
AFSI
-
NASDAQ
Amtrust Financial Svcs
INSURANCE - Property and; Casualty Insurance
|
$54.30
|
+0.09
0.17% |
$54.65
|
257,593
23.61% of 50 DAV
50 DAV is 1,091,000
|
$59.31
-8.45%
|
10/17/2014
|
$45.24
|
PP = $46.02
|
|
MB = $48.32
|
Most Recent Note - 12/24/2014 2:42:28 PM
G - Finding support near prior highs in the $53 area defining initial support above its 50 DMA line. See the latest FSU analysis for more details and new annotated graphs.
>>> FEATURED STOCK ARTICLE : Finding Support Near Prior Highs - 12/24/2014
View all notes |
Set NEW NOTE alert |
CANSLIM.net Company Profile |
SEC
News |
Chart |
Request a new note
C
A N
S L
I M
|
ALXN
-
NASDAQ
Alexion Pharmaceuticals
DRUGS - Drug Manufacturers - Other
|
$187.49
|
+5.53
3.04% |
$187.84
|
645,591
56.68% of 50 DAV
50 DAV is 1,139,000
|
$203.30
-7.78%
|
10/23/2014
|
$184.01
|
PP = $185.53
|
|
MB = $194.81
|
 Most Recent Note - 12/26/2014 5:53:33 PM
G - Rebounded with a quiet gain today ending near its 50 DMA line which may act as resistance. The recent low ($176.01 on 12/17/14) defines the next important support level. It faces resistance due to overhead supply up through $203. Disciplined investors limit losses by selling if any stock falls more than -7% from their purchase price.
>>> FEATURED STOCK ARTICLE : Recent 50-Day Moving Average Violation Triggered Sell Signal - 12/17/2014
View all notes |
Set NEW NOTE alert |
CANSLIM.net Company Profile |
SEC
News |
Chart |
Request a new note
C
A N
S L
I M
|
BIDU
-
NASDAQ
Baidu Inc Ads
INTERNET - Internet Information Providers
|
$234.88
|
+3.90
1.69% |
$237.43
|
1,619,128
46.94% of 50 DAV
50 DAV is 3,449,000
|
$251.99
-6.79%
|
10/30/2014
|
$234.08
|
PP = $231.51
|
|
MB = $243.09
|
Most Recent Note - 12/23/2014 7:02:49 PM
Y - Color code is changed to yellow while quietly consolidating. Recent lows in the $217-218 area define important near-term support following its quiet rebound above its 50 DMA line.
>>> FEATURED STOCK ARTICLE : Rebound Above 50-Day Moving Average Helped Technical Stance - 12/19/2014
View all notes |
Set NEW NOTE alert |
CANSLIM.net Company Profile |
SEC
News |
Chart |
Request a new note
C
A N
S L
I M
|
EPAM
-
NYSE
Epam Systems Inc
COMPUTER SOFTWARE and SERVICES - Information Technology Service
|
$48.84
|
+0.00
0.00% |
$49.21
|
145,667
32.30% of 50 DAV
50 DAV is 451,000
|
$52.89
-7.66%
|
10/23/2014
|
$45.21
|
PP = $46.09
|
|
MB = $48.39
|
Most Recent Note - 12/22/2014 6:10:59 PM
G - Consolidating just above its 50 DMA line. Prior highs in the $46 area acted as support last week. Subsequent losses below recent lows would raise concerns and trigger a more worrisome technical sell signal.
>>> FEATURED STOCK ARTICLE : Violated 50-Day Moving Average Triggering Technical Sell Signal - 12/16/2014
View all notes |
Set NEW NOTE alert |
CANSLIM.net Company Profile |
SEC
News |
Chart |
Request a new note
C
A N
S L
I M
|
Symbol/Exchange
Company Name
Industry Group |
PRICE |
CHANGE
(%Change) |
Day High |
Volume
(% DAV)
(% 50 day avg vol) |
52 Wk Hi
% From Hi |
Featured
Date |
Price
Featured |
Pivot Featured |
|
Max Buy |
FB
-
NASDAQ
Facebook Inc Cl A
INTERNET
|
$80.78
|
+0.01
0.01% |
$81.28
|
10,632,807
31.79% of 50 DAV
50 DAV is 33,446,000
|
$82.17
-1.70%
|
12/22/2014
|
$81.79
|
PP = $81.26
|
|
MB = $85.32
|
Most Recent Note - 12/22/2014 6:04:56 PM
Y - A new pivot point was cited based on its 10/28/14 high plus 10 cents. It hit a new high with today's 4th consecutive gain and no resistance remains due to overhead supply. Volume-driven gains are needed to clinch a proper technical buy signal. See the latest FSU analysis for more details and new annotated graphs.
>>> FEATURED STOCK ARTICLE : Gains for New Highs Backed By Lighter Volume - 12/22/2014
View all notes |
Set NEW NOTE alert |
CANSLIM.net Company Profile |
SEC
News |
Chart |
Request a new note
C
A N
S L
I M
|
ILMN
-
NASDAQ
Illumina Inc
DRUGS - Biotechnology
|
$188.20
|
+1.98
1.06% |
$189.42
|
533,064
43.84% of 50 DAV
50 DAV is 1,216,000
|
$197.37
-4.65%
|
10/22/2014
|
$188.77
|
PP = $182.27
|
|
MB = $191.38
|
Most Recent Note - 12/23/2014 6:54:59 PM
G - Ended below its 50 DMA line ($184.61) and near the session low with today's loss on below average volume. Only a prompt rebound above the 50 DMA line would help its outlook improve. Meanwhile it faces some resistance due to overhead supply up through $197.
>>> FEATURED STOCK ARTICLE : Violation of 50-Day Average Triggered Technical Sell Signal - 12/15/2014
View all notes |
Set NEW NOTE alert |
CANSLIM.net Company Profile |
SEC
News |
Chart |
Request a new note
C
A N
S L
I M
|
PANW
-
NYSE
Palo Alto Networks
Computer Sftwr-Security
|
$127.43
|
+1.44
1.14% |
$128.20
|
728,673
44.24% of 50 DAV
50 DAV is 1,647,000
|
$128.00
-0.45%
|
7/30/2014
|
$84.21
|
PP = $85.88
|
|
MB = $90.17
|
Most Recent Note - 12/23/2014 6:59:08 PM
G - Pulled back today on lighter volume following 4 consecutive gains. It has not formed a sound base. The 50 DMA line defines near-term support to watch below recent lows.
>>> FEATURED STOCK ARTICLE : Latest Consolidation Was Not a Base of Sufficient Length - 12/18/2014
View all notes |
Set NEW NOTE alert |
CANSLIM.net Company Profile |
SEC
News |
Chart |
Request a new note
C
A N
S L
I M
|
RH
-
NYSE
Restoration Hardware Hld
RETAIL - Home Furnishing Stores
|
$96.00
|
-0.97
-1.00% |
$97.40
|
299,548
31.70% of 50 DAV
50 DAV is 945,000
|
$100.66
-4.63%
|
12/11/2014
|
$98.66
|
PP = $94.60
|
|
MB = $99.33
|
Most Recent Note - 12/26/2014 5:55:25 PM
Y - Has been quietly consolidating below its "max buy" level. Subsequent losses leading to a close below its old high close ($93.05 on 6/30/14) would completely negate the recent breakout and raise concerns. See the latest FSU analysis fore more details and new annotated graphs.
>>> FEATURED STOCK ARTICLE : Consolidating Above Prior Highs With Volume Totals Cooling - 12/26/2014
View all notes |
Set NEW NOTE alert |
CANSLIM.net Company Profile |
SEC
News |
Chart |
Request a new note
C
A N
S L
I M
|
UIHC
-
NASDAQ
United Insurance Holding
Insurance-Prop/Cas/Titl
|
$21.13
|
-0.34
-1.58% |
$21.66
|
126,339
53.31% of 50 DAV
50 DAV is 237,000
|
$22.41
-5.71%
|
12/5/2014
|
$20.64
|
PP = $20.31
|
|
MB = $21.33
|
Most Recent Note - 12/23/2014 6:52:10 PM
G - Rose further above its "max buy" level as it posted a 7th consecutive gain. Disciplined investors avoid chasing stocks more than +5% above prior highs and always limit losses by selling any stock that falls more than -7% from its purchase price. See the latest FSU analysis for more details and new annotated graphs.
>>> FEATURED STOCK ARTICLE : Recent Streak of Gains Lacked Volume Conviction - 12/23/2014
View all notes |
Set NEW NOTE alert |
CANSLIM.net Company Profile |
SEC
News |
Chart |
Request a new note
C
A N
S L
I M
|
Symbol/Exchange
Company Name
Industry Group |
PRICE |
CHANGE
(%Change) |
Day High |
Volume
(% DAV)
(% 50 day avg vol) |
52 Wk Hi
% From Hi |
Featured
Date |
Price
Featured |
Pivot Featured |
|
Max Buy |
|
|
|
THESE ARE NOT BUY RECOMMENDATIONS!
Comments contained in the body of this report are technical
opinions only. The material herein has been obtained
from sources believed to be reliable and accurate, however,
its accuracy and completeness cannot be guaranteed.
This site is not an investment advisor, hence it does
not endorse or recommend any securities or other investments.
Any recommendation contained in this report may not
be suitable for all investors and it is not to be deemed
an offer or solicitation on our part with respect to
the purchase or sale of any securities. All trademarks,
service marks and trade names appearing in this report
are the property of their respective owners, and are
likewise used for identification purposes only.
This report is a service available
only to active Paid Premium Members.
You may opt-out of receiving report notifications
at any time. Questions or comments may be submitted
by writing to Premium Membership Services 665 S.E. 10 Street, Suite 201 Deerfield Beach, FL 33441-5634 or by calling 1-800-965-8307
or 954-785-1121.
|
|
|

