***Last / Change / Volume data in this table is the closing quote data***
Symbol/Exchange
Company Name
Industry Group |
PRICE |
CHANGE
(%Change) |
Day High |
Volume
(% DAV)
(% 50 day avg vol) |
52 Wk Hi
% From Hi |
Featured
Date |
Price
Featured |
Pivot Featured |
|
Max Buy |
BITA
-
NYSE
Bitauto Hldgs Ltd Ads
INTERNET - Internet Information Providers
|
$30.05
|
-1.25
-3.99% |
$34.47
|
2,175,127
212.68% of 50 DAV
50 DAV is 1,022,700
|
$31.89
-5.77%
|
9/24/2013
|
$16.40
|
PP = $17.31
|
|
MB = $18.18
|
 Most Recent Note - 11/18/2013 1:28:20 PM
G - Hitting yet another new 52-week high with today's 7th consecutive volume-driven gain, getting more extended from any sound base. Prior high in the $28 area defines initial support to watch on pullbacks.
>>> FEATURED STOCK ARTICLE : Consolidating After Getting Extended From Prior Base - 11/11/2013
View all notes |
Set NEW NOTE alert |
CANSLIM.net Company Profile |
SEC
News |
Chart |
Request a new note
C
A N
S L
I M


|
BLOX
-
NYSE
Infoblox Inc
COMPUTER HARDWARE - Networking and Communication Dev
|
$42.77
|
-2.73
-6.00% |
$46.30
|
1,052,192
137.63% of 50 DAV
50 DAV is 764,500
|
$48.97
-12.65%
|
10/11/2013
|
$43.02
|
PP = $45.60
|
|
MB = $47.88
|
Most Recent Note - 11/18/2013 1:29:57 PM
Y - Reversed into the red after initially gapping up today. Found support at its 50 DMA line during its recent consolidation. Disciplined investors limit losses by selling any stock that falls more than -7% from their purchase price.
>>> FEATURED STOCK ARTICLE : Finished Another Week Higher With Volume Behind Gains - 10/11/2013
View all notes |
Set NEW NOTE alert |
CANSLIM.net Company Profile |
SEC
News |
Chart |
Request a new note
C
A N
S L
I M
|
CELG
-
NASDAQ
Celgene Corp
DRUGS - Drug Manufacturers - Major
|
$152.98
|
+1.87
1.24% |
$155.25
|
3,241,079
112.53% of 50 DAV
50 DAV is 2,880,100
|
$161.64
-5.36%
|
9/12/2013
|
$149.50
|
PP = $150.02
|
|
MB = $157.52
|
Most Recent Note - 11/18/2013 1:32:00 PM
G - Rebounding above its 50 DMA line today, but recent gains have been lacking great volume conviction. The prior low ($142.10 on 11/07/13) is the next technical support level where a subsequent violation may trigger a more worrisome technical sell signal. Earnings +21% on +18% sales revenues for the Sep '13 quarter were below the +25% minimum guideline (C criteria) raising fundamental concerns.
>>> FEATURED STOCK ARTICLE : Testing 50-Day Average Following Sub Par Earnings Increase - 11/1/2013
View all notes |
Set NEW NOTE alert |
CANSLIM.net Company Profile |
SEC
News |
Chart |
Request a new note
C
A N
S L
I M
|
EGOV
-
NASDAQ
N I C Inc
INTERNET - Internet Software and Services
|
$23.84
|
-0.16
-0.67% |
$24.10
|
230,564
74.66% of 50 DAV
50 DAV is 308,800
|
$25.99
-8.27%
|
10/18/2013
|
$25.17
|
PP = $23.66
|
|
MB = $24.84
|
Most Recent Note - 11/18/2013 1:33:24 PM
Y - Found support near its 50 DMA line after recently slumping back into its prior base and raising concerns with damaging distributional action. Disciplined investors always limit losses by selling any stock that falls more than -7% from their purchase price.
>>> FEATURED STOCK ARTICLE : Technical Breakout From "Double Bottom" Base on 3 Times Average Volume - 10/18/2013
View all notes |
Set NEW NOTE alert |
CANSLIM.net Company Profile |
SEC
News |
Chart |
Request a new note
C
A N
S L
I M
|
FLT
-
NYSE
Fleetcor Technologies
DIVERSIFIED SERVICES - Business/Management Services
|
$118.03
|
-0.17
-0.14% |
$120.24
|
686,825
89.85% of 50 DAV
50 DAV is 764,400
|
$120.51
-2.06%
|
8/19/2013
|
$99.01
|
PP = $100.97
|
|
MB = $106.02
|
Most Recent Note - 11/13/2013 5:19:03 PM
G - Inched higher with light volume today while for a best-ever close. Endured distributional pressure in recent weeks and did not form a sound base. Its 50 DMA line defines near-term support to watch on pullbacks. See the latest FSU analysis for more details and new annotated daily and weekly graphs.
>>> FEATURED STOCK ARTICLE : Perched Near All-Time High Tallying Quiet Gains - 11/13/2013
View all notes |
Set NEW NOTE alert |
CANSLIM.net Company Profile |
SEC
News |
Chart |
Request a new note
C
A N
S L
I M
|
Symbol/Exchange
Company Name
Industry Group |
PRICE |
CHANGE
(%Change) |
Day High |
Volume
(% DAV)
(% 50 day avg vol) |
52 Wk Hi
% From Hi |
Featured
Date |
Price
Featured |
Pivot Featured |
|
Max Buy |
GNRC
-
NYSE
Generac Hldgs Inc
CONSUMER DURABLES - Electronic Equipment
|
$50.28
|
+0.17
0.34% |
$51.08
|
1,053,591
130.19% of 50 DAV
50 DAV is 809,300
|
$52.32
-3.90%
|
10/24/2013
|
$47.46
|
PP = $44.24
|
|
MB = $46.45
|
Most Recent Note - 11/13/2013 3:39:13 PM
G - Volume totals have been cooling while holding its ground stubbornly near all-time highs. Prior highs in the $44 area define near-term support to watch on pullbacks.
>>> FEATURED STOCK ARTICLE : Consolidating After "Breakway Gap" With 4 Times Average Volume - 10/30/2013
View all notes |
Set NEW NOTE alert |
CANSLIM.net Company Profile |
SEC
News |
Chart |
Request a new note
C
A N
S L
I M
|
JAZZ
-
NASDAQ
Jazz Pharmaceuticals Plc
DRUGS - Biotechnology
|
$109.09
|
+0.70
0.65% |
$110.57
|
754,411
103.34% of 50 DAV
50 DAV is 730,000
|
$110.63
-1.39%
|
9/30/2013
|
$93.20
|
PP = $89.10
|
|
MB = $93.56
|
Most Recent Note - 11/13/2013 2:34:51 PM
G- Powering to a new 52-week high with today's 4th consecutive gain on ever-increasing volume, getting more extended from prior highs. Disciplined investors avoid chasing stocks more than +5% above prior highs and always limit losses by selling any stock that falls more than -7% from their purchase price.
>>> FEATURED STOCK ARTICLE : Hovering Near All-Time Highs Following Volume-Driven Gains - 11/7/2013
View all notes |
Set NEW NOTE alert |
CANSLIM.net Company Profile |
SEC
News |
Chart |
Request a new note
C
A N
S L
I M
|
KORS
-
NYSE
Michael Kors Hldgs Ltd
RETAIL - Apparel Stores
|
$80.95
|
-1.78
-2.15% |
$83.13
|
3,137,526
67.23% of 50 DAV
50 DAV is 4,667,200
|
$82.75
-2.18%
|
8/6/2013
|
$69.66
|
PP = $66.28
|
|
MB = $69.59
|
Most Recent Note - 11/13/2013 12:29:34 PM
G - Perched near all-time highs after volume-driven gains, getting extended from prior highs in the $78 area that define near-term support.
>>> FEATURED STOCK ARTICLE : Hitting New Highs After Choppy Consolidation - 11/6/2013
View all notes |
Set NEW NOTE alert |
CANSLIM.net Company Profile |
SEC
News |
Chart |
Request a new note
C
A N
S L
I M
|
LOPE
-
NASDAQ
Grand Canyon Education
DIVERSIFIED SERVICES - Education and; Training Services
|
$45.07
|
-1.53
-3.28% |
$47.02
|
368,218
87.36% of 50 DAV
50 DAV is 421,500
|
$50.48
-10.72%
|
6/19/2013
|
$31.47
|
PP = $34.17
|
|
MB = $35.88
|
Most Recent Note - 11/13/2013 3:34:35 PM
G - Still holding its ground near all-time highs following a considerable volume-driven gain on 10/30/13. Reported earnings +17% on +14% sales revenues for the Sep '13 quarter, its 2nd quarterly comparison with an earnings increase below the +25% minimum guideline (C criteria). Repeatedly noted - "Fundamental concerns remain while technical action has been reassuring."
>>> FEATURED STOCK ARTICLE : Formed Advanced Base But Fundamental Concerns Remain - 10/14/2013
View all notes |
Set NEW NOTE alert |
CANSLIM.net Company Profile |
SEC
News |
Chart |
Request a new note
C
A N
S L
I M
|
MRLN
-
NASDAQ
Marlin Business Services
DIVERSIFIED SERVICES - Rental and Leasing Services
|
$24.78
|
-0.29
-1.16% |
$25.25
|
10,521
36.03% of 50 DAV
50 DAV is 29,200
|
$28.64
-13.47%
|
9/9/2013
|
$23.75
|
PP = $24.03
|
|
MB = $25.23
|
Most Recent Note - 11/14/2013 6:37:22 PM
G - Slumped below its 50 DMA line raising concerns. More damaging losses would raise greater concerns and trigger more worrisome technical sell signals. See the latest FSU analysis for more details and new annotated daily and weekly graphs.
>>> FEATURED STOCK ARTICLE : Violated 50-Day Moving Average Line Raising Concerns - 11/14/2013
View all notes |
Set NEW NOTE alert |
CANSLIM.net Company Profile |
SEC
News |
Chart |
Request a new note
C
A N
S L
I M
|
Symbol/Exchange
Company Name
Industry Group |
PRICE |
CHANGE
(%Change) |
Day High |
Volume
(% DAV)
(% 50 day avg vol) |
52 Wk Hi
% From Hi |
Featured
Date |
Price
Featured |
Pivot Featured |
|
Max Buy |
NOAH
-
NYSE
Noah Holdings Ltd Ads
FINANCIAL SERVICES - Asset Management
|
$22.56
|
-1.67
-6.89% |
$25.51
|
1,800,799
242.83% of 50 DAV
50 DAV is 741,600
|
$25.00
-9.76%
|
10/15/2013
|
$19.10
|
PP = $18.33
|
|
MB = $19.25
|
Most Recent Note - 11/18/2013 12:43:19 PM
G - Hitting yet another new 52-week high with today's 4th consecutive volume-driven gain after choppy action in recent weeks. Disciplined investors avoid chasing stocks extended more than +5% above prior highs and always limit losses by selling if any stock falls more than -7% from their purchase price.
>>> FEATURED STOCK ARTICLE : Finished Strong With Gain on 4 Times Average Volume - 10/15/2013
View all notes |
Set NEW NOTE alert |
CANSLIM.net Company Profile |
SEC
News |
Chart |
Request a new note
C
A N
S L
I M
|
OII
-
NYSE
Oceaneering Intl Inc
ENERGY - Oil and Gas Drilling and Explorati
|
$81.78
|
-2.00
-2.39% |
$84.44
|
490,590
73.73% of 50 DAV
50 DAV is 665,400
|
$87.64
-6.69%
|
10/16/2013
|
$83.08
|
PP = $84.74
|
|
MB = $88.98
|
Most Recent Note - 11/13/2013 12:35:52 PM
G - Violated its 50 DMA line with above average volume behind losses triggering a technical sell signal and its color code was changed to green. Recently reported earnings +23% on +16% sales revenues, below the +25% minimum earnings guideline (C criteria) raising concerns.
>>> FEATURED STOCK ARTICLE : Forming Set-Up Above 50-Day Moving Average Line - 10/16/2013
View all notes |
Set NEW NOTE alert |
CANSLIM.net Company Profile |
SEC
News |
Chart |
Request a new note
C
A N
S L
I M
|
PCLN
-
NASDAQ
Priceline.Com Inc
INTERNET - Internet Software and Services
|
$1,127.93
|
-11.60
-1.02% |
$1,145.00
|
610,815
97.11% of 50 DAV
50 DAV is 629,000
|
$1,144.76
-1.47%
|
9/13/2013
|
$966.82
|
PP = $995.08
|
|
MB = $1,044.83
|
Most Recent Note - 11/18/2013 1:09:42 PM
G - Hovering at its 52-week high with today's 7th consecutive gain. Found support at its 50 DMA line on prior pullbacks. It has not formed a sound base pattern. Reported earnings +40% on +33% sales revenues for the Sep '13 quarter versus the year-ago period, improving after a slightly sub par Jun '13 report.
>>> FEATURED STOCK ARTICLE : Rallied to New Highs Following Pullback to 50-day Average - 10/29/2013
View all notes |
Set NEW NOTE alert |
CANSLIM.net Company Profile |
SEC
News |
Chart |
Request a new note
C
A N
S L
I M
|
PRAA
-
NASDAQ
Portfolio Recovery Assoc
DIVERSIFIED SERVICES - Business/Management Services
|
$55.56
|
-1.20
-2.11% |
$57.50
|
320,201
73.09% of 50 DAV
50 DAV is 438,100
|
$63.96
-13.14%
|
10/17/2013
|
$60.75
|
PP = $61.70
|
|
MB = $64.79
|
Most Recent Note - 11/18/2013 1:13:37 PM
G - Holding its ground after undercutting the previously noted low ($56.20 on 10/09/13) defining an important chart support level to watch. Remains below its 50 DMA line after a streak of losses marked by volume raised concerns, and a rebound above that short-term average is needed for its outlook to improve.
>>> FEATURED STOCK ARTICLE : Near 50-Day Moving Average Enduring Distributional Pressure - 11/5/2013
View all notes |
Set NEW NOTE alert |
CANSLIM.net Company Profile |
SEC
News |
Chart |
Request a new note
C
A N
S L
I M
|
PRLB
-
NYSE
Proto Labs Inc
MANUFACTURING - Small Tools and Accessories
|
$84.50
|
-1.11
-1.30% |
$88.47
|
434,622
103.65% of 50 DAV
50 DAV is 419,300
|
$89.97
-6.08%
|
7/29/2013
|
$64.86
|
PP = $67.50
|
|
MB = $70.88
|
Most Recent Note - 11/18/2013 1:17:02 PM
G - Perched near its 52-week high today with no resistance remaining due to overhead supply, but it has not formed a sound base. Near term support to watch is at its 50 DMA line ($80.42 now).
>>> FEATURED STOCK ARTICLE : Undercut 50-Day Moving Average Yet Found Prompt Support - 11/4/2013
View all notes |
Set NEW NOTE alert |
CANSLIM.net Company Profile |
SEC
News |
Chart |
Request a new note
C
A N
S L
I M
|
Symbol/Exchange
Company Name
Industry Group |
PRICE |
CHANGE
(%Change) |
Day High |
Volume
(% DAV)
(% 50 day avg vol) |
52 Wk Hi
% From Hi |
Featured
Date |
Price
Featured |
Pivot Featured |
|
Max Buy |
SFUN
-
NYSE
Soufun Hldgs Ltd Ads A
INTERNET - Internet Information Providers
|
$66.53
|
-0.52
-0.78% |
$71.62
|
1,579,572
100.06% of 50 DAV
50 DAV is 1,578,600
|
$68.42
-2.76%
|
10/17/2013
|
$58.02
|
PP = $53.87
|
|
MB = $56.56
|
Most Recent Note - 11/18/2013 1:18:03 PM
G - Hitting new all-time highs today. Disciplined investors avoid chasing extended stocks. Prior highs in the $59 area define initial support to watch on pullbacks.
>>> FEATURED STOCK ARTICLE : Perched Near All-Time High After Testing Support - 11/8/2013
View all notes |
Set NEW NOTE alert |
CANSLIM.net Company Profile |
SEC
News |
Chart |
Request a new note
C
A N
S L
I M
|
SSNC
-
NASDAQ
S S & C Technologies
COMPUTER SOFTWARE and SERVICES - Application Software
|
$39.79
|
-0.53
-1.31% |
$40.47
|
259,226
57.79% of 50 DAV
50 DAV is 448,600
|
$41.75
-4.69%
|
10/22/2013
|
$39.17
|
PP = $40.04
|
|
MB = $42.04
|
Most Recent Note - 11/18/2013 1:21:56 PM
Y - Volume totals have still been cooling while consolidating since its 11/04/13 breakout gain. That is a sign that very few investors have headed to the exit while it remains perched near its all-time highs. Subsequent losses leading to a close below its old high closes in the $39.50 area would raise concerns and completely negate its recent breakout.
>>> FEATURED STOCK ARTICLE : Volume Totals Cooling Following Recent Volume-Driven Breakout - 11/12/2013
View all notes |
Set NEW NOTE alert |
CANSLIM.net Company Profile |
SEC
News |
Chart |
Request a new note
C
A N
S L
I M
|
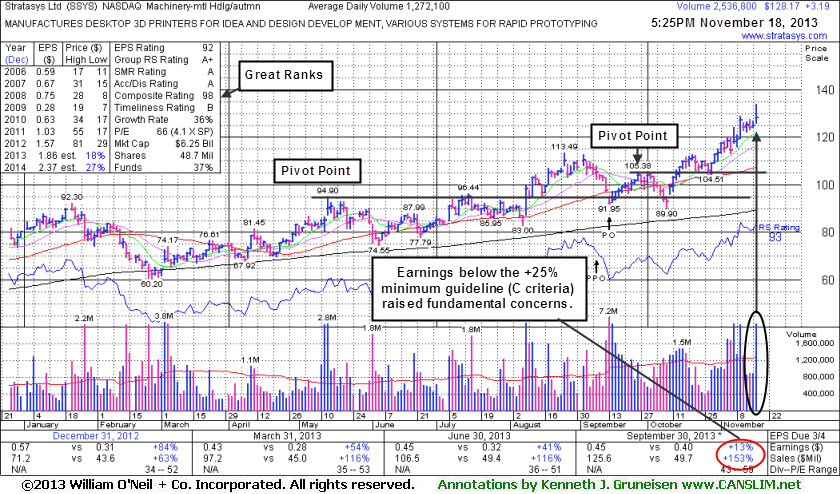
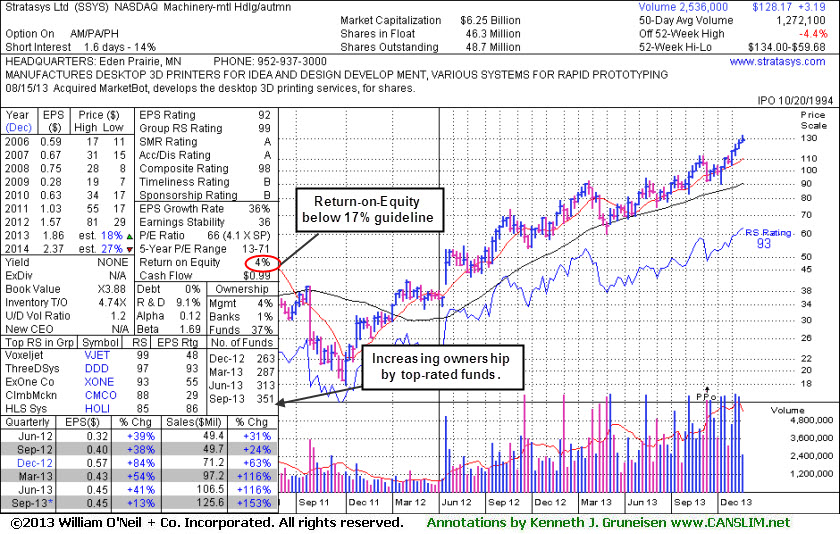
SSYS
-
NASDAQ
Stratasys Ltd
COMPUTER HARDWARE - Computer Peripherals
|
$128.17
|
+3.19
2.55% |
$134.00
|
2,536,845
199.42% of 50 DAV
50 DAV is 1,272,100
|
$128.75
-0.45%
|
10/11/2013
|
$102.94
|
PP = $105.38
|
|
MB = $110.65
|
Most Recent Note - 11/18/2013 5:52:26 PM
G - Ended in the lower half of the session's range after hitting a new 52-week high with today's volume-driven gain, getting more extended from a sound base. Reported earnings +13% on +153% sales revenues, below the +25% minimum earnings guideline (C criteria) raising fundamental concerns. See the latest FSU analysis for more details and a new annotated graph.
>>> FEATURED STOCK ARTICLE : Rallying For New Highs Despite Fundamental Flaw Raising Concern - 11/18/2013
View all notes |
Set NEW NOTE alert |
CANSLIM.net Company Profile |
SEC
News |
Chart |
Request a new note
C
A N
S L
I M
|
STMP
-
NASDAQ
Stamps.Com Inc
INTERNET - Internet Software and Services
|
$47.86
|
-0.43
-0.89% |
$49.00
|
144,577
131.67% of 50 DAV
50 DAV is 109,800
|
$49.40
-3.12%
|
9/24/2013
|
$45.54
|
PP = $46.57
|
|
MB = $48.90
|
Most Recent Note - 11/18/2013 1:24:03 PM
G - Challenging its 52-week high today. Recently held its ground at its 50 DMA line, where more damaging losses would raise greater concerns. Fundamental concerns were raised by waning sales revenues and earnings increases. Reported earnings +24% on +7% sales revenues for the Sep '13 quarter, just below the +25% minimum earnings guideline (C criteria).
>>> FEATURED STOCK ARTICLE : Fundamental Flaw May Prompt Disciplined Investors to Look Elsewhere - 10/31/2013
View all notes |
Set NEW NOTE alert |
CANSLIM.net Company Profile |
SEC
News |
Chart |
Request a new note
C
A N
S L
I M
|
ULTI
-
NASDAQ
Ultimate Software Group
INTERNET - Internet Software and Services
|
$156.17
|
-1.33
-0.84% |
$158.00
|
152,663
103.85% of 50 DAV
50 DAV is 147,000
|
$162.88
-4.12%
|
10/16/2013
|
$142.95
|
PP = $151.18
|
|
MB = $158.74
|
Most Recent Note - 11/18/2013 1:26:52 PM
Y - Volume totals have been cooling while still holding its ground near its 52-week high yet below its "max buy" level, remaining above prior highs defining initial support.
>>> FEATURED STOCK ARTICLE : Hovering Less Than -5% From 52-Week High - 10/17/2013
View all notes |
Set NEW NOTE alert |
CANSLIM.net Company Profile |
SEC
News |
Chart |
Request a new note
C
A N
S L
I M
|
Symbol/Exchange
Company Name
Industry Group |
PRICE |
CHANGE
(%Change) |
Day High |
Volume
(% DAV)
(% 50 day avg vol) |
52 Wk Hi
% From Hi |
Featured
Date |
Price
Featured |
Pivot Featured |
|
Max Buy |
VRX
-
NYSE
Valeant Pharmaceuticals
DRUGS - Drug Manufacturers - Other
|
$106.74
|
-0.38
-0.35% |
$108.26
|
897,745
76.10% of 50 DAV
50 DAV is 1,179,700
|
$115.40
-7.50%
|
9/11/2013
|
$100.26
|
PP = $105.50
|
|
MB = $110.78
|
Most Recent Note - 11/15/2013 5:50:12 PM
Y- Recent lows define near-term support below its 50 DMA line. More damaging volume-driven losses may trigger technical sell signals. Recently reported earnings +24% on +74% sales revenues for the Sep '13 quarter, a notch below the +25% minimum guideline (C criteria). See the latest FSU analysis for more details and new annotated daily and weekly graphs.
>>> FEATURED STOCK ARTICLE : Recent Lows Define Support to Watch Below 50 Day Average - 11/15/2013
View all notes |
Set NEW NOTE alert |
CANSLIM.net Company Profile |
SEC
News |
Chart |
Request a new note
C
A N
S L
I M
|
YNDX
-
NASDAQ
Yandex N V Class A
INTERNET - Internet Information Providers
|
$38.78
|
+0.25
0.65% |
$39.85
|
2,621,673
99.24% of 50 DAV
50 DAV is 2,641,800
|
$42.00
-7.67%
|
9/5/2013
|
$34.24
|
PP = $34.79
|
|
MB = $36.53
|
Most Recent Note - 11/14/2013 6:34:37 PM
G - Rebounded above its 50 DMA line with a solid gain on higher (near average) volume helping its technical stance improve. Prior low ($34.31 on 10/08/13) defines the next chart support level to watch.
>>> FEATURED STOCK ARTICLE : Consolidating After Getting Extended From Sound Base - 10/28/2013
View all notes |
Set NEW NOTE alert |
CANSLIM.net Company Profile |
SEC
News |
Chart |
Request a new note
C
A N
S L
I M
|