You are not logged in.
This means you
CAN ONLY VIEW reports that were published prior to Friday, April 11, 2025.
You
MUST UPGRADE YOUR MEMBERSHIP if you want to see any current reports.
AFTER MARKET UPDATE - FRIDAY, NOVEMBER 14TH, 2014
Previous After Market Report Next After Market Report >>>
|
|
|
|
DOW |
-18.05 |
17,634.74 |
-0.10% |
|
Volume |
688,881,450 |
-0% |
|
Volume |
1,616,570,400 |
-6% |
|
NASDAQ |
+8.40 |
4,688.54 |
+0.18% |
|
Advancers |
1,629 |
51% |
|
Advancers |
1,394 |
47% |
|
S&P 500 |
+0.49 |
2,039.82 |
+0.02% |
|
Decliners |
1,468 |
46% |
|
Decliners |
1,417 |
48% |
|
Russell 2000 |
-1.61 |
1,173.81 |
-0.14% |
|
52 Wk Highs |
130 |
|
|
52 Wk Highs |
68 |
|
|
S&P 600 |
-0.77 |
679.36 |
-0.11% |
|
52 Wk Lows |
51 |
|
|
52 Wk Lows |
57 |
|
|
 |
Major Averages Finished 4th Consecutive Week With Gains
Kenneth J. Gruneisen - Passed the CAN SLIM® Master's Exam
The major averages finished mixed on Friday but posted their fourth straight week of gains. The Dow and the S&P 500 trimmed their weekly advance to +0.4%, as the Dow fell 18 points to 17,634, and the S&P was up less than a point to 2,039. The NASDAQ gained 8 points to 4,688 and climbed +1.2% on the week. Friday's volume totals were reported lighter than the prior session totals on the NYSE and on the Nasdaq exchange. Decliners led advancers by a narrow margin on the Nasdaq exchange while advancers led decliners by an 8-7 margin on the NYSE. There were 42 high-ranked companies from the CANSLIM.net Leaders List that made new 52-week highs and appeared on the CANSLIM.net BreakOuts Page, down from the prior session total of 98 stocks. New 52-week highs outnumbered new 52-week lows on the NYSE and on the Nasdaq exchange. There were gains for 8 of the 12 high-ranked companies currently on the Featured Stocks Page. Disciplined investors know that new buying efforts may be made under the fact-based investment system only in stocks meeting all key criteria.
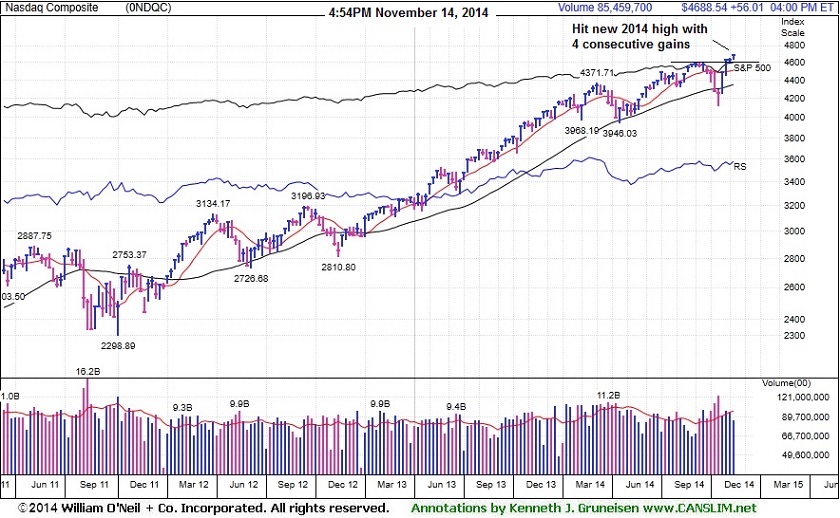
PICTURED: The Nasdaq Composite Index hit new 2014 highs with its 4th consecutive gain.
Stocks toggled between gains and losses as investors digested economic data. A measure of import prices declined the most in more than 25 months, while a gauge of retail sales for October surprisingly rose by +0.3%. The University of Michigan's consumer confidence survey increased for the third straight month to a seven-year high. Turning to monetary policy, regional president Jim Bullard said low inflation should not prevent the Fed from raising rates in 2015.
At the close six of 10 sectors in the S&P 500 advanced. Energy gained the most as the price of WTI crude on the NYMEX climbed +2.3% to $75.88 from a three-year low yesterday. Exxon Mobil (XOM +0.45%) rose. Baker Hughes (BHI +1.94%) rose after confirming it is in advanced talks to be purchased by Halliburton (HAL +2.40%). Health stocks were relative underperformers and Gilead (GILD -2.05%) fell.
Treasuries finished higher. The benchmark 10-year note climbed 6/32 to yield 2.32%.
Large gains on 10/21/14 backed by higher volume totals while leadership (stocks hitting new 52-week highs) expanded met the definition of a "follow-through day" confirming a new uptrend for the market (M criteria). The S&P 500 Index, Nasdaq Composite Index, and the Dow Jones Industrial Average have collectively rebounded above their respective 50-day and 200-day moving average (DMA) lines, technically putting the market in a healthier stance.
The CANSLIM.net Featured Stocks Page shows the most action-worthy candidates and their latest notes and a Headline Link directs members to the latest detailed analysis with data-packed graphs annotated by a Certified expert along with links to additional resources. The Premium Member Homepage includes "dynamic archives" to all prior pay reports published.
|
 Kenneth J. Gruneisen started out as a licensed stockbroker in August 1987, a couple of months prior to the historic stock market crash that took the Dow Jones Industrial Average down -22.6% in a single day. He has published daily fact-based fundamental and technical analysis on high-ranked stocks online for two decades. Through FACTBASEDINVESTING.COM, Kenneth provides educational articles, news, market commentary, and other information regarding proven investment systems that work in good times and bad.
Comments contained in the body of this report are technical opinions only and are not necessarily those of Gruneisen Growth Corp. The material herein has been obtained from sources believed to be reliable and accurate, however, its accuracy and completeness cannot be guaranteed. Our firm, employees, and customers may effect transactions, including transactions contrary to any recommendation herein, or have positions in the securities mentioned herein or options with respect thereto. Any recommendation contained in this report may not be suitable for all investors and it is not to be deemed an offer or solicitation on our part with respect to the purchase or sale of any securities. |
|
 |
Retail, Energy, Networking, Semiconductor, and Commodity-Linked Groups Rose
Kenneth J. Gruneisen - Passed the CAN SLIM® Master's Exam
The Retail Index ($RLX +0.46%) was a positive influence on the major averages. The Biotechnology Index ($BTK -2.28%) created a drag on the tech sector while the Networking Index ($NWX +1.57%) and the Semiconductor Index ($SOX +0.90%) rose. The Broker/Dealer Index ($XBD -0.15%) and the Bank Index ($BKX -0.22%) both finished with small losses. Energy-related shares bounced back as the Oil Services Index ($OSX +0.71%) and the Integrated Oil Index ($XOI +1.00%) tallied gains. The Gold & Silver Index ($XAU +6.18%) was a standout gainer.
Charts courtesy www.stockcharts.com
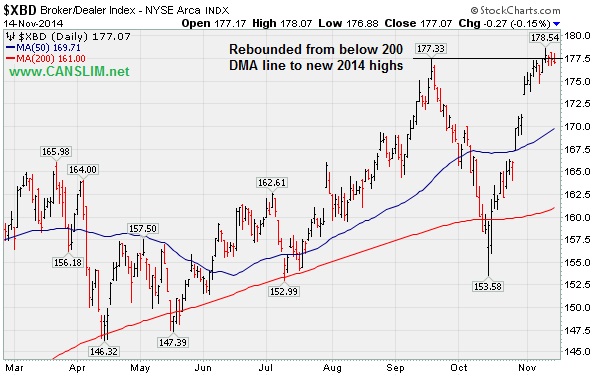
PICTURED: The Broker/Dealer Index ($XBD -0.15%) is consolidating after rebounding from below its 200-day moving average (DMA) line to reach new 2014 highs.
| Oil Services |
$OSX |
243.69 |
+1.72 |
+0.71% |
-13.29% |
| Integrated Oil |
$XOI |
1,438.32 |
+14.24 |
+1.00% |
-4.31% |
| Semiconductor |
$SOX |
645.56 |
+5.76 |
+0.90% |
+20.66% |
| Networking |
$NWX |
337.49 |
+5.21 |
+1.57% |
+4.18% |
| Broker/Dealer |
$XBD |
177.07 |
-0.27 |
-0.15% |
+10.28% |
| Retail |
$RLX |
978.76 |
+4.50 |
+0.46% |
+4.15% |
| Gold & Silver |
$XAU |
70.82 |
+4.12 |
+6.18% |
-15.84% |
| Bank |
$BKX |
70.82 |
+4.12 |
+6.18% |
+2.25% |
| Biotech |
$BTK |
3,254.45 |
-76.02 |
-2.28% |
+39.65% |
|
|
|
 |
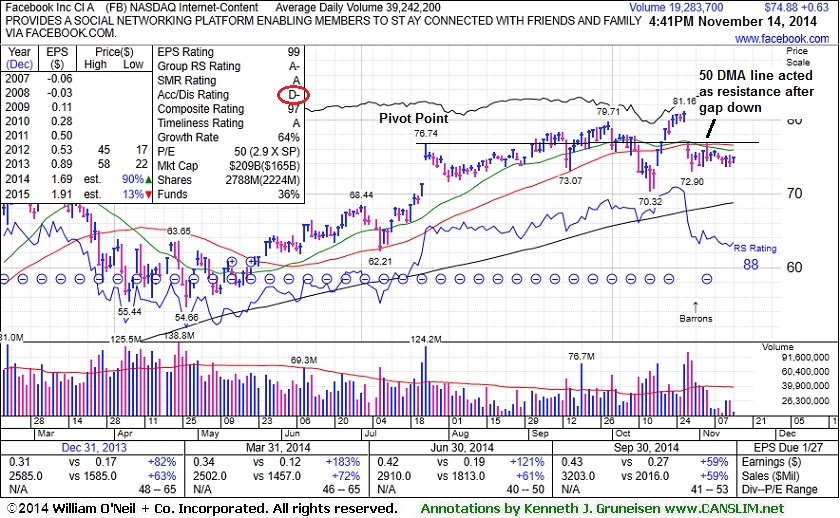
Following Violation 50-Day Average Acted as Resistance
Kenneth J. Gruneisen - Passed the CAN SLIM® Master's Exam
Facebook Inc (FB +$0.63 or +0.85% to $74.88) encountered resistance at its 50-day moving average (DMA) line following a violation on 3 times average volume on 10/29/14 that raised concerns and triggered a technical sell signal. Recent gains have lacked volume conviction. A rebound above the 50 DMA line is needed for its outlook to improve.
The high-ranked Internet - Content firm was last shown in this FSU section on 10/29/14 with annotated graphs under the headline, "Gapped Down Following Latest Strong Earnings Report". The company reported earnings +59% on +59% sales revenues for the Sep '14 quarter but warned of rising costs. That marked its 6th consecutive quarterly comparison with earnings increasing well above the +25% minimum (C criteria).
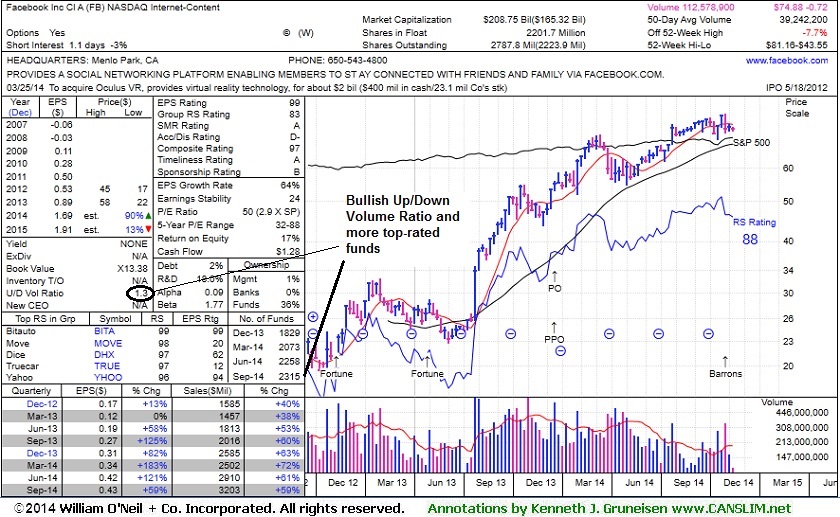
Disciplined investors avoid chasing stocks more than +5% above their pivot point and always limit losses by selling any stock that falls more than -7% from their purchase price. Its current Up/Down Volume Ratio of 1.3 is still an unbiased indication its shares have been under accumulation over the past 50 days. The high-ranked Internet - Content group leader has seen the number of top-rated funds owning its shares rise from 1,116 in Dec '12 to 2,315 in Sep '14, a reassuring sign concerning the I criteria. Members were previously warned - "Keep in mind that its large supply of 2.54 billion shares in the public float makes it an unlikely sprinter, especially as it is already well known by the institutional crowd and the general public."
|
|
|
Color Codes Explained :
Y - Better candidates highlighted by our
staff of experts.
G - Previously featured
in past reports as yellow but may no longer be buyable under the
guidelines.
***Last / Change / Volume data in this table is the closing quote data***
Symbol/Exchange
Company Name
Industry Group |
PRICE |
CHANGE
(%Change) |
Day High |
Volume
(% DAV)
(% 50 day avg vol) |
52 Wk Hi
% From Hi |
Featured
Date |
Price
Featured |
Pivot Featured |
|
Max Buy |
ACT
-
NYSE
Actavis plc
Medical-Generic Drugs
|
$243.77
|
+2.14
0.89% |
$245.49
|
1,836,527
76.84% of 50 DAV
50 DAV is 2,390,000
|
$254.41
-4.18%
|
6/20/2014
|
$216.53
|
PP = $230.87
|
|
MB = $242.41
|
Most Recent Note - 11/12/2014 1:05:02 PM
Y - Color code is changed to yellow after pulling back below its "max buy" level. Recent lows near $208 define initial support to watch below its nearby 50 DMA line ($237.90) where damaging violations would raise concerns.
>>> FEATURED STOCK ARTICLE : New Highs Following Deep "V" Shaped Pullback - Not a Sound Base - 11/6/2014
View all notes |
Set NEW NOTE alert |
CANSLIM.net Company Profile |
SEC
News |
Chart |
Request a new note
C
A N
S L
I M


|
AFSI
-
NASDAQ
Amtrust Financial Svcs
INSURANCE - Property and; Casualty Insurance
|
$52.48
|
+0.32
0.61% |
$52.93
|
838,823
86.12% of 50 DAV
50 DAV is 974,000
|
$53.80
-2.45%
|
10/17/2014
|
$45.24
|
PP = $46.02
|
|
MB = $48.32
|
 Most Recent Note - 11/14/2014 6:16:10 PM
G - Posted a 5th consecutive gain today on near average volume, finishing near its 52-week high. Recent lows near $42 and its 50 DMA line define important near-term support.
>>> FEATURED STOCK ARTICLE : 50-Day Average Acted as Support Following Analyst Downgrade - 11/5/2014
View all notes |
Set NEW NOTE alert |
CANSLIM.net Company Profile |
SEC
News |
Chart |
Request a new note
C
A N
S L
I M
|
ALXN
-
NASDAQ
Alexion Pharmaceuticals
DRUGS - Drug Manufacturers - Other
|
$188.76
|
-4.83
-2.49% |
$193.95
|
974,614
80.08% of 50 DAV
50 DAV is 1,217,000
|
$197.64
-4.49%
|
10/23/2014
|
$184.01
|
PP = $185.53
|
|
MB = $194.81
|
Most Recent Note - 11/14/2014 6:14:22 PM
Y - Pulled back today on higher volume but below average volume, still trading above its pivot point and below its "max buy" level. Prior highs in the $180 area define initial support to watch on pullbacks.
>>> FEATURED STOCK ARTICLE : New High Close With Gain on Light Volume - 11/10/2014
View all notes |
Set NEW NOTE alert |
CANSLIM.net Company Profile |
SEC
News |
Chart |
Request a new note
C
A N
S L
I M
|
BIDU
-
NASDAQ
Baidu Inc Ads
INTERNET - Internet Information Providers
|
$249.70
|
+5.61
2.30% |
$251.22
|
3,637,551
95.70% of 50 DAV
50 DAV is 3,801,000
|
$251.99
-0.91%
|
10/30/2014
|
$234.08
|
PP = $231.51
|
|
MB = $243.09
|
Most Recent Note - 11/14/2014 6:18:43 PM
G - Finished near the session high and perched near its all-time high, extended from its prior base. Prior highs near $230 define near-term support to watch on pullbacks.
>>> FEATURED STOCK ARTICLE : Technical Breakout on Triple Average Volume Following Strong Earnings - 10/30/2014
View all notes |
Set NEW NOTE alert |
CANSLIM.net Company Profile |
SEC
News |
Chart |
Request a new note
C
A N
S L
I M
|
EPAM
-
NYSE
Epam Systems Inc
COMPUTER SOFTWARE and SERVICES - Information Technology Service
|
$49.64
|
+0.47
0.96% |
$49.70
|
288,726
69.41% of 50 DAV
50 DAV is 416,000
|
$50.00
-0.72%
|
10/23/2014
|
$45.21
|
PP = $46.09
|
|
MB = $48.39
|
Most Recent Note - 11/13/2014 6:06:17 PM
G - Rallied with +24% above average volume today for a new high close. Color code is changed to green after rising above its "max buy" level. Prior highs in the $44 area defining initial support above its 50 DMA line ($43.12).
>>> FEATURED STOCK ARTICLE : Consolidating Above Prior Highs Following Technical Breakout - 11/11/2014
View all notes |
Set NEW NOTE alert |
CANSLIM.net Company Profile |
SEC
News |
Chart |
Request a new note
C
A N
S L
I M
|
Symbol/Exchange
Company Name
Industry Group |
PRICE |
CHANGE
(%Change) |
Day High |
Volume
(% DAV)
(% 50 day avg vol) |
52 Wk Hi
% From Hi |
Featured
Date |
Price
Featured |
Pivot Featured |
|
Max Buy |
FB
-
NASDAQ
Facebook Inc Cl A
INTERNET
|
$74.88
|
+0.63
0.85% |
$74.93
|
19,427,356
49.51% of 50 DAV
50 DAV is 39,242,000
|
$81.16
-7.74%
|
9/9/2014
|
$76.67
|
PP = $76.84
|
|
MB = $80.68
|
Most Recent Note - 11/14/2014 6:09:43 PM
G - Recent gains have lacked volume conviction and it encountered resistance at its 50 DMA line following a violation on 3 times average volume on 10/29/14 that raised concerns and triggered a technical sell signal. See the latest FSU analysis for more details and new annotated graphs.
>>> FEATURED STOCK ARTICLE : Following Violation 50-Day Average Acted as Resistance - 11/14/2014
View all notes |
Set NEW NOTE alert |
CANSLIM.net Company Profile |
SEC
News |
Chart |
Request a new note
C
A N
S L
I M
|
FLT
-
NYSE
Fleetcor Technologies
DIVERSIFIED SERVICES - Business/Management Services
|
$146.72
|
-0.94
-0.64% |
$148.09
|
290,740
41.01% of 50 DAV
50 DAV is 709,000
|
$153.52
-4.43%
|
10/31/2014
|
$148.50
|
PP = $146.29
|
|
MB = $153.60
|
Most Recent Note - 11/14/2014 6:21:27 PM
Y - Consolidating with volume totals cooling after highlighted in yellow in the 10/31/14 mid-day report (read here) clinching a convincing technical buy signal. It remains trading above its pivot point and below its "max buy" level.
>>> FEATURED STOCK ARTICLE : Strong Finish Following Gap Up After Earnings News - 10/31/2014
View all notes |
Set NEW NOTE alert |
CANSLIM.net Company Profile |
SEC
News |
Chart |
Request a new note
C
A N
S L
I M
|
ILMN
-
NASDAQ
Illumina Inc
DRUGS - Biotechnology
|
$180.50
|
-4.50
-2.43% |
$186.00
|
1,833,612
146.92% of 50 DAV
50 DAV is 1,248,000
|
$197.37
-8.55%
|
10/22/2014
|
$188.77
|
PP = $182.27
|
|
MB = $191.38
|
Most Recent Note - 11/12/2014 1:09:12 PM
Y - Still consolidating above its pivot point and below its "max buy" level. Prior highs near $182 define initial support to watch on pullbacks.
>>> FEATURED STOCK ARTICLE : Consolidating Above Prior Highs Which Define Initial Support - 11/7/2014
View all notes |
Set NEW NOTE alert |
CANSLIM.net Company Profile |
SEC
News |
Chart |
Request a new note
C
A N
S L
I M
|
NBCB
-
NASDAQ
First N B C Bank Hldg
Banks-Southeast
|
$37.49
|
-0.17
-0.45% |
$38.13
|
84,669
102.01% of 50 DAV
50 DAV is 83,000
|
$38.18
-1.81%
|
10/31/2014
|
$36.31
|
PP = $35.93
|
|
MB = $37.73
|
Most Recent Note - 11/13/2014 12:24:15 PM
G - Touching another new 52-week high today, rising further above its "max buy" level. Held its ground stubbornly following a streak of volume-driven gains. No resistance remains due to overhead supply. Prior highs near $34 define near-term support to watch on pullbacks.
>>> FEATURED STOCK ARTICLE : Financial Firm at 52-Week High Tallied 8th Consecutive Gain - 11/3/2014
View all notes |
Set NEW NOTE alert |
CANSLIM.net Company Profile |
SEC
News |
Chart |
Request a new note
C
A N
S L
I M
|
PANW
-
NYSE
Palo Alto Networks
Computer Sftwr-Security
|
$110.78
|
+1.18
1.08% |
$110.91
|
1,124,681
51.22% of 50 DAV
50 DAV is 2,195,900
|
$111.45
-0.60%
|
7/30/2014
|
$84.21
|
PP = $85.88
|
|
MB = $90.17
|
Most Recent Note - 11/13/2014 6:00:37 PM
G - Hit a new all-time high today but finished near the session low with a small gain on light volume. Its 50 DMA line ($100.71) defines near-term support to watch. It has not formed a sound base. See the latest FSU analysis for more details and new annotated graphs.
>>> FEATURED STOCK ARTICLE : Finished Near Session Low With Small Gain on Light Volume - 11/13/2014
View all notes |
Set NEW NOTE alert |
CANSLIM.net Company Profile |
SEC
News |
Chart |
Request a new note
C
A N
S L
I M
|
Symbol/Exchange
Company Name
Industry Group |
PRICE |
CHANGE
(%Change) |
Day High |
Volume
(% DAV)
(% 50 day avg vol) |
52 Wk Hi
% From Hi |
Featured
Date |
Price
Featured |
Pivot Featured |
|
Max Buy |
SNCR
-
NASDAQ
Synchronoss Technologies
COMPUTER SOFTWARE andamp; SERVICES - Application Software
|
$48.38
|
+0.42
0.88% |
$49.15
|
526,891
92.93% of 50 DAV
50 DAV is 567,000
|
$54.05
-10.49%
|
10/27/2014
|
$46.40
|
PP = $47.81
|
|
MB = $50.20
|
Most Recent Note - 11/12/2014 5:51:44 PM
G - Gapped down today for a loss on higher volume, a sign of distributional pressure. Prior highs in the $47 area define initial support to watch above its 50 DMA line ($46.17) on pullbacks. See the latest FSU analysis for more details and new annotated graphs.
>>> FEATURED STOCK ARTICLE : Loss on Heavy Volume a Sign of Distributional Pressure - 11/12/2014
View all notes |
Set NEW NOTE alert |
CANSLIM.net Company Profile |
SEC
News |
Chart |
Request a new note
C
A N
S L
I M
|
STRT
-
NASDAQ
Strattec Security Corp
AUTOMOTIVE - Auto Parts
|
$103.76
|
+0.52
0.50% |
$104.57
|
25,738
98.99% of 50 DAV
50 DAV is 26,000
|
$109.44
-5.19%
|
9/19/2014
|
$86.06
|
PP = $89.97
|
|
MB = $94.47
|
Most Recent Note - 11/13/2014 12:44:03 PM
G - Still stubbornly holding its ground near its 52-week high, possibly forming an advanced "3-weeks tight" base. Prior highs in the $88 area coincide with its 50 DMA line ($88.50) defining important near-term support to watch on pullbacks.
>>> FEATURED STOCK ARTICLE : Stock With Small Supply Quickly Got Extended From Prior Base - 11/4/2014
View all notes |
Set NEW NOTE alert |
CANSLIM.net Company Profile |
SEC
News |
Chart |
Request a new note
C
A N
S L
I M
|
|
|
|
THESE ARE NOT BUY RECOMMENDATIONS!
Comments contained in the body of this report are technical
opinions only. The material herein has been obtained
from sources believed to be reliable and accurate, however,
its accuracy and completeness cannot be guaranteed.
This site is not an investment advisor, hence it does
not endorse or recommend any securities or other investments.
Any recommendation contained in this report may not
be suitable for all investors and it is not to be deemed
an offer or solicitation on our part with respect to
the purchase or sale of any securities. All trademarks,
service marks and trade names appearing in this report
are the property of their respective owners, and are
likewise used for identification purposes only.
This report is a service available
only to active Paid Premium Members.
You may opt-out of receiving report notifications
at any time. Questions or comments may be submitted
by writing to Premium Membership Services 665 S.E. 10 Street, Suite 201 Deerfield Beach, FL 33441-5634 or by calling 1-800-965-8307
or 954-785-1121.
|
|
|

