***Last / Change / Volume data in this table is the closing quote data***
Symbol/Exchange
Company Name
Industry Group |
PRICE |
CHANGE
(%Change) |
Day High |
Volume
(% DAV)
(% 50 day avg vol) |
52 Wk Hi
% From Hi |
Featured
Date |
Price
Featured |
Pivot Featured |
|
Max Buy |
BITA
-
NYSE
Bitauto Hldgs Ltd Ads
INTERNET - Internet Information Providers
|
$23.40
|
-0.60
-2.50% |
$25.75
|
1,945,449
226.00% of 50 DAV
50 DAV is 860,800
|
$28.48
-17.84%
|
9/24/2013
|
$16.40
|
PP = $17.31
|
|
MB = $18.18
|
 Most Recent Note - 11/7/2013 9:16:41 PM
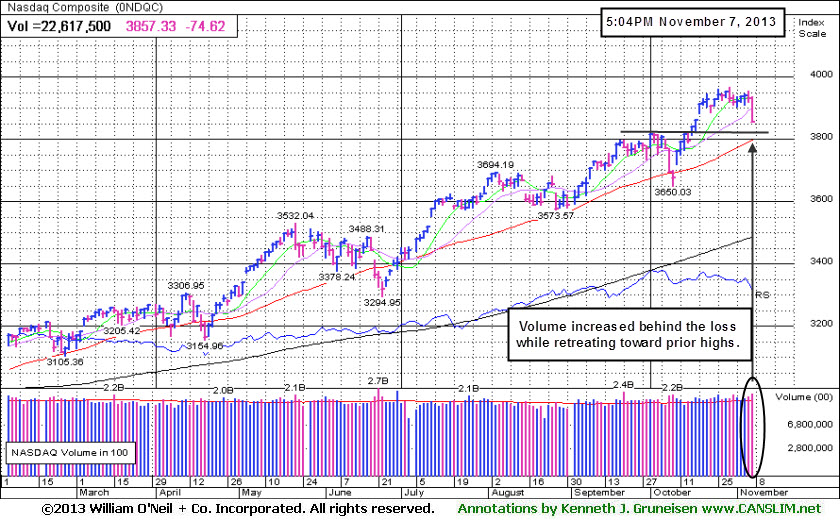
G - Reversed into the red for a loss today with above average volume. Its 50 DMA line and prior highs define important support to watch on pullbacks.
>>> FEATURED STOCK ARTICLE : Volume-Driven Gains Cleared Latest Pivot Point - 10/2/2013
View all notes |
Set NEW NOTE alert |
CANSLIM.net Company Profile |
SEC
News |
Chart |
Request a new note
C
A N
S L
I M


|
BLOX
-
NYSE
Infoblox Inc
COMPUTER HARDWARE - Networking and Communication Dev
|
$42.31
|
-2.21
-4.96% |
$45.29
|
904,253
109.59% of 50 DAV
50 DAV is 825,100
|
$48.97
-13.59%
|
10/11/2013
|
$43.02
|
PP = $45.60
|
|
MB = $47.88
|
Most Recent Note - 11/7/2013 9:05:01 PM
Y - Slumped near its 50 DMA line with today's damaging loss on slightly above average volume. Disciplined investors limit losses by selling any stock that falls more than -7% from their purchase price.
>>> FEATURED STOCK ARTICLE : Finished Another Week Higher With Volume Behind Gains - 10/11/2013
View all notes |
Set NEW NOTE alert |
CANSLIM.net Company Profile |
SEC
News |
Chart |
Request a new note
C
A N
S L
I M
|
CELG
-
NASDAQ
Celgene Corp
DRUGS - Drug Manufacturers - Major
|
$144.99
|
+0.50
0.35% |
$149.68
|
5,680,666
202.87% of 50 DAV
50 DAV is 2,800,100
|
$161.64
-10.30%
|
9/12/2013
|
$149.50
|
PP = $150.02
|
|
MB = $157.52
|
Most Recent Note - 11/6/2013 4:01:21 PM
G - Slumping further below its 50 DMA line with today's damaging volume-driven loss raising more concerns. Earnings +21% on +18% sales revenues for the Sep '13 quarter were below the +25% minimum guideline (C criteria) raising concerns. The prior low ($143.13 on 10/09/13) is the next technical support level where a subsequent violation may trigger a more worrisome technical sell signal.
>>> FEATURED STOCK ARTICLE : Testing 50-Day Average Following Sub Par Earnings Increase - 11/1/2013
View all notes |
Set NEW NOTE alert |
CANSLIM.net Company Profile |
SEC
News |
Chart |
Request a new note
C
A N
S L
I M
|
EGOV
-
NASDAQ
N I C Inc
INTERNET - Internet Software and Services
|
$23.05
|
+0.08
0.35% |
$23.41
|
502,740
167.64% of 50 DAV
50 DAV is 299,900
|
$25.99
-11.31%
|
10/18/2013
|
$25.17
|
PP = $23.66
|
|
MB = $24.84
|
Most Recent Note - 11/6/2013 4:02:34 PM
Y - Down again today, still testing its 50 DMA line. It stalled following a technical breakout from a "double bottom" base on 10/18/13. Disciplined investors always limit losses by selling any stock that falls more than -7% from their purchase price.
>>> FEATURED STOCK ARTICLE : Technical Breakout From "Double Bottom" Base on 3 Times Average Volume - 10/18/2013
View all notes |
Set NEW NOTE alert |
CANSLIM.net Company Profile |
SEC
News |
Chart |
Request a new note
C
A N
S L
I M
|
FLT
-
NYSE
Fleetcor Technologies
DIVERSIFIED SERVICES - Business/Management Services
|
$111.18
|
-3.53
-3.08% |
$115.38
|
715,011
94.39% of 50 DAV
50 DAV is 757,500
|
$120.51
-7.74%
|
8/19/2013
|
$99.01
|
PP = $100.97
|
|
MB = $106.02
|
Most Recent Note - 11/6/2013 4:13:01 PM
G - Stubbornly holding its ground near its 52-week high following a considerable volume-driven gain on 10/31/13. Endured distributional pressure in recent weeks and has not formed a sound base. Reported earnings +30% on +20% sales revenues for the Sep '13 quarter.
>>> FEATURED STOCK ARTICLE : Extended After 13 Weekly Gains in Span of 14 Weeks - 10/7/2013
View all notes |
Set NEW NOTE alert |
CANSLIM.net Company Profile |
SEC
News |
Chart |
Request a new note
C
A N
S L
I M
|
Symbol/Exchange
Company Name
Industry Group |
PRICE |
CHANGE
(%Change) |
Day High |
Volume
(% DAV)
(% 50 day avg vol) |
52 Wk Hi
% From Hi |
Featured
Date |
Price
Featured |
Pivot Featured |
|
Max Buy |
GNRC
-
NYSE
Generac Hldgs Inc
CONSUMER DURABLES - Electronic Equipment
|
$47.07
|
-0.72
-1.51% |
$48.25
|
699,672
85.16% of 50 DAV
50 DAV is 821,600
|
$52.32
-10.03%
|
10/24/2013
|
$47.46
|
PP = $44.24
|
|
MB = $46.45
|
Most Recent Note - 11/6/2013 4:14:20 PM
G - Consolidating -9.0% off its 52-week high with volume totals cooling in recent weeks following volume-driven gains. Prior highs in the $44 area define near-term support to watch on pullbacks.
>>> FEATURED STOCK ARTICLE : Consolidating After "Breakway Gap" With 4 Times Average Volume - 10/30/2013
View all notes |
Set NEW NOTE alert |
CANSLIM.net Company Profile |
SEC
News |
Chart |
Request a new note
C
A N
S L
I M
|
JAZZ
-
NASDAQ
Jazz Pharmaceuticals Plc
DRUGS - Biotechnology
|
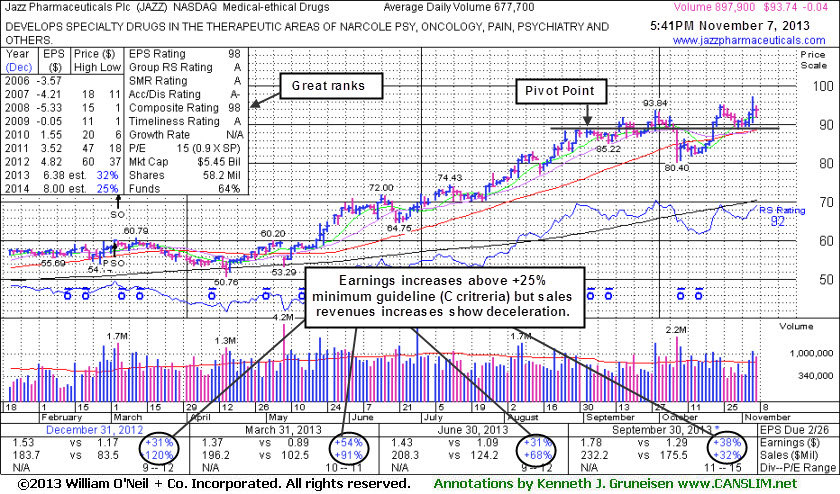
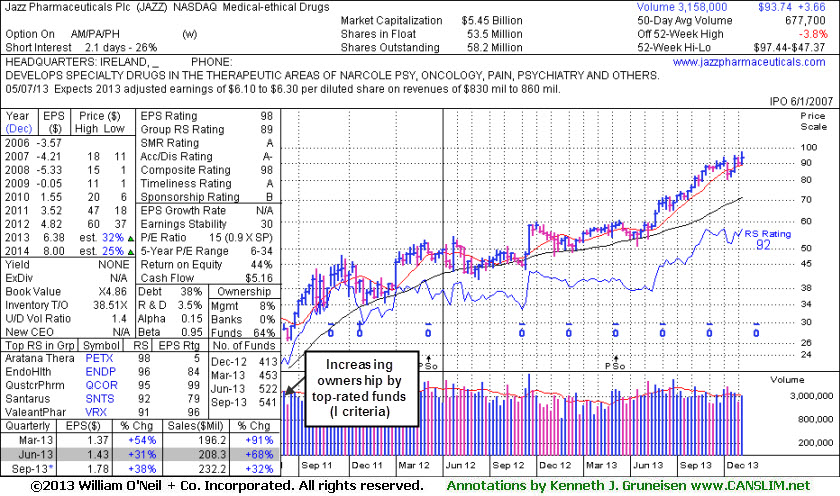
$93.74
|
-0.04
-0.04% |
$94.97
|
898,244
132.54% of 50 DAV
50 DAV is 677,700
|
$95.24
-1.58%
|
9/30/2013
|
$93.20
|
PP = $89.10
|
|
MB = $93.56
|
Most Recent Note - 11/7/2013 9:03:04 PM
G- Perched near its 52-week high after recent volume-driven gains, and its color code is changed to green . Disciplined investors avoid chasing stocks more than +5% above prior highs and always limit losses by selling any stock that falls more than -7% from their purchase price. See the latest FSU analysis for more details and new annotated daily and weekly graphs.
>>> FEATURED STOCK ARTICLE : Hovering Near All-Time Highs Following Volume-Driven Gains - 11/7/2013
View all notes |
Set NEW NOTE alert |
CANSLIM.net Company Profile |
SEC
News |
Chart |
Request a new note
C
A N
S L
I M
|
KORS
-
NYSE
Michael Kors Hldgs Ltd
RETAIL - Apparel Stores
|
$77.91
|
-1.58
-1.99% |
$80.16
|
4,575,592
119.29% of 50 DAV
50 DAV is 3,835,800
|
$80.00
-2.61%
|
8/6/2013
|
$69.66
|
PP = $66.28
|
|
MB = $69.59
|
Most Recent Note - 11/6/2013 5:23:06 PM
G - Rose further into new high territory today after a 11/05/13 gap up and rally above prior highs in the $78 area with above average volume. It has not formed a sound base pattern. See the latest FSU analysis for more details and new annotated daily and weekly graphs.
>>> FEATURED STOCK ARTICLE : Hitting New Highs After Choppy Consolidation - 11/6/2013
View all notes |
Set NEW NOTE alert |
CANSLIM.net Company Profile |
SEC
News |
Chart |
Request a new note
C
A N
S L
I M
|
LOPE
-
NASDAQ
Grand Canyon Education
DIVERSIFIED SERVICES - Education and; Training Services
|
$46.31
|
-1.29
-2.71% |
$47.97
|
335,109
82.56% of 50 DAV
50 DAV is 405,900
|
$50.48
-8.26%
|
6/19/2013
|
$31.47
|
PP = $34.17
|
|
MB = $35.88
|
Most Recent Note - 11/6/2013 4:08:10 PM
G - Still perched near its all-time high, stubbornly holding its ground following a considerable volume-driven gain on 10/30/13. Reported earnings +17% on +14% sales revenues for the Sep '13 quarter, its 2nd quarterly comparison with an earnings increase below the +25% minimum guideline (C criteria). Repeatedly noted - "Fundamental concerns remain while technical action has been reassuring."
>>> FEATURED STOCK ARTICLE : Formed Advanced Base But Fundamental Concerns Remain - 10/14/2013
View all notes |
Set NEW NOTE alert |
CANSLIM.net Company Profile |
SEC
News |
Chart |
Request a new note
C
A N
S L
I M
|
MRLN
-
NASDAQ
Marlin Business Services
DIVERSIFIED SERVICES - Rental and Leasing Services
|
$25.45
|
-1.75
-6.43% |
$27.32
|
15,411
48.77% of 50 DAV
50 DAV is 31,600
|
$28.64
-11.14%
|
9/9/2013
|
$23.75
|
PP = $24.03
|
|
MB = $25.23
|
Most Recent Note - 11/7/2013 9:06:43 PM
G - Pulled back today on light volume, slumping below prior highs in the $26 area and raising concerns. Testing support at its 50 DMA line where more damaging losses would raise greater concerns.
>>> FEATURED STOCK ARTICLE : Faring Better Than Others While Testing 50-Day Average Line - 10/8/2013
View all notes |
Set NEW NOTE alert |
CANSLIM.net Company Profile |
SEC
News |
Chart |
Request a new note
C
A N
S L
I M
|
Symbol/Exchange
Company Name
Industry Group |
PRICE |
CHANGE
(%Change) |
Day High |
Volume
(% DAV)
(% 50 day avg vol) |
52 Wk Hi
% From Hi |
Featured
Date |
Price
Featured |
Pivot Featured |
|
Max Buy |
NOAH
-
NYSE
Noah Holdings Ltd Ads
FINANCIAL SERVICES - Asset Management
|
$18.78
|
-1.76
-8.57% |
$20.88
|
941,367
126.60% of 50 DAV
50 DAV is 743,600
|
$22.99
-18.31%
|
10/15/2013
|
$19.10
|
PP = $18.33
|
|
MB = $19.25
|
Most Recent Note - 11/7/2013 5:27:51 PM
Y - Down considerably today with higher and above average volume indicating distributional pressure. Color code is changed to yellow after slumping below its "max buy" level. Disciplined investors avoid chasing extended stocks and always limit losses by selling if any stock falls more than -7% from their purchase price.
>>> FEATURED STOCK ARTICLE : Finished Strong With Gain on 4 Times Average Volume - 10/15/2013
View all notes |
Set NEW NOTE alert |
CANSLIM.net Company Profile |
SEC
News |
Chart |
Request a new note
C
A N
S L
I M
|
OII
-
NYSE
Oceaneering Intl Inc
ENERGY - Oil and Gas Drilling and Explorati
|
$82.45
|
-3.46
-4.03% |
$86.52
|
813,593
123.80% of 50 DAV
50 DAV is 657,200
|
$87.64
-5.92%
|
10/16/2013
|
$83.08
|
PP = $84.74
|
|
MB = $88.98
|
Most Recent Note - 11/7/2013 5:29:29 PM
Y - Slumped near its 50 DMA line and recent lows today with a loss on higher volume testing near-term support in the $82 area. Recently reported earnings +23% on +16% sales revenues, below the +25% minimum earnings guideline (C criteria) raising concerns.
>>> FEATURED STOCK ARTICLE : Forming Set-Up Above 50-Day Moving Average Line - 10/16/2013
View all notes |
Set NEW NOTE alert |
CANSLIM.net Company Profile |
SEC
News |
Chart |
Request a new note
C
A N
S L
I M
|
PCLN
-
NASDAQ
Priceline.Com Inc
INTERNET - Internet Software and Services
|
$1,022.89
|
-35.15
-3.32% |
$1,062.60
|
1,328,854
243.42% of 50 DAV
50 DAV is 545,900
|
$1,098.70
-6.90%
|
9/13/2013
|
$966.82
|
PP = $995.08
|
|
MB = $1,044.83
|
Most Recent Note - 11/7/2013 9:15:32 PM
G - Slumped near its 50 DMA line with a damaging loss today with above average volume. More damaging losses would raise concerns and trigger technical sell signals.
>>> FEATURED STOCK ARTICLE : Rallied to New Highs Following Pullback to 50-day Average - 10/29/2013
View all notes |
Set NEW NOTE alert |
CANSLIM.net Company Profile |
SEC
News |
Chart |
Request a new note
C
A N
S L
I M
|
PRAA
-
NASDAQ
Portfolio Recovery Assoc
DIVERSIFIED SERVICES - Business/Management Services
|
$57.40
|
-0.77
-1.32% |
$58.70
|
558,956
129.48% of 50 DAV
50 DAV is 431,700
|
$63.96
-10.26%
|
10/17/2013
|
$60.75
|
PP = $61.70
|
|
MB = $64.79
|
Most Recent Note - 11/5/2013 6:31:53 PM
G - Was down for a 5th consecutive loss today with above average volume. Slumped further below prior highs and finished below its 50 DMA line raising concerns and its color code is changed to green. See the latest FSU analysis for more details and new annotated daily and weekly graphs.
>>> FEATURED STOCK ARTICLE : Near 50-Day Moving Average Enduring Distributional Pressure - 11/5/2013
View all notes |
Set NEW NOTE alert |
CANSLIM.net Company Profile |
SEC
News |
Chart |
Request a new note
C
A N
S L
I M
|
PRLB
-
NYSE
Proto Labs Inc
MANUFACTURING - Small Tools and Accessories
|
$78.98
|
-4.68
-5.59% |
$85.35
|
615,535
153.85% of 50 DAV
50 DAV is 400,100
|
$88.63
-10.89%
|
7/29/2013
|
$64.86
|
PP = $67.50
|
|
MB = $70.88
|
Most Recent Note - 11/7/2013 12:14:59 PM
G - Slumping toward its 50 DMA line today. Found prompt support last week after undercutting its 50 DMA line again briefly. Prior low $68.29 on 10/09/13 defines the next important near-term support level.
>>> FEATURED STOCK ARTICLE : Undercut 50-Day Moving Average Yet Found Prompt Support - 11/4/2013
View all notes |
Set NEW NOTE alert |
CANSLIM.net Company Profile |
SEC
News |
Chart |
Request a new note
C
A N
S L
I M
|
Symbol/Exchange
Company Name
Industry Group |
PRICE |
CHANGE
(%Change) |
Day High |
Volume
(% DAV)
(% 50 day avg vol) |
52 Wk Hi
% From Hi |
Featured
Date |
Price
Featured |
Pivot Featured |
|
Max Buy |
SFUN
-
NYSE
Soufun Hldgs Ltd Ads A
INTERNET - Internet Information Providers
|
$51.40
|
-2.19
-4.09% |
$56.93
|
3,046,555
210.85% of 50 DAV
50 DAV is 1,444,900
|
$59.50
-13.61%
|
10/17/2013
|
$58.02
|
PP = $53.87
|
|
MB = $56.56
|
Most Recent Note - 11/7/2013 9:13:38 PM
Y - Undercut its 50 DMA line and low ($48.30 on 10/19/13) intra-day yet rebounded to finish above that important short-term average and in the middle of the session's wider than usual range. More damaging losses would raise greater concerns.
>>> FEATURED STOCK ARTICLE : Following Great Rally No New Base Has Been Formed - 10/1/2013
View all notes |
Set NEW NOTE alert |
CANSLIM.net Company Profile |
SEC
News |
Chart |
Request a new note
C
A N
S L
I M
|
SSNC
-
NASDAQ
S S & C Technologies
COMPUTER SOFTWARE and SERVICES - Application Software
|
$40.13
|
-1.24
-3.00% |
$41.50
|
389,520
87.14% of 50 DAV
50 DAV is 447,000
|
$41.75
-3.88%
|
10/22/2013
|
$39.17
|
PP = $40.04
|
|
MB = $42.04
|
Most Recent Note - 11/4/2013 12:38:17 PM
Y - Rallying for a new 52-week high today with volume running at a slightly above average pace while rising above the pivot point. Managed an impressive "positive reversal" on the prior session after testing support at its 50 DMA line. Reported earnings +33% on +8% sales revenues for the Sep '13 quarter. Prior reports noted - "Subsequent volume-driven gains above the pivot point may trigger a new (or add-on) technical buy signal."
>>> FEATURED STOCK ARTICLE : Finding Support Near 50-Day Average After Secondary Offering - 10/4/2013
View all notes |
Set NEW NOTE alert |
CANSLIM.net Company Profile |
SEC
News |
Chart |
Request a new note
C
A N
S L
I M
|
SSYS
-
NASDAQ
Stratasys Ltd
COMPUTER HARDWARE - Computer Peripherals
|
$118.15
|
+3.80
3.32% |
$124.16
|
2,935,318
249.37% of 50 DAV
50 DAV is 1,177,100
|
$120.25
-1.75%
|
10/11/2013
|
$102.94
|
PP = $105.38
|
|
MB = $110.65
|
Most Recent Note - 11/7/2013 12:26:18 PM
G - Gapped up today for a considerable gain and new 52-week high, getting more extended from prior highs. Reported earnings +13% on +153% sales revenues, below the +25% minimum earnings guideline (C criteria) raising fundamental concerns.
>>> FEATURED STOCK ARTICLE : Faltering and Relative Strength Waning After Offering - 10/9/2013
View all notes |
Set NEW NOTE alert |
CANSLIM.net Company Profile |
SEC
News |
Chart |
Request a new note
C
A N
S L
I M
|
STMP
-
NASDAQ
Stamps.Com Inc
INTERNET - Internet Software and Services
|
$45.72
|
-0.43
-0.92% |
$46.92
|
93,229
81.85% of 50 DAV
50 DAV is 113,900
|
$49.40
-7.46%
|
9/24/2013
|
$45.54
|
PP = $46.57
|
|
MB = $48.90
|
Most Recent Note - 11/4/2013 6:14:26 PM
G - Halted its slide today at its 50 DMA line, where more damaging losses would raise greater concerns. Fundamental concerns were raised by waning sales revenues and earnings increases. Reported earnings +24% on +7% sales revenues for the Sep '13 quarter, just below the +25% minimum earnings guideline (C criteria).
>>> FEATURED STOCK ARTICLE : Fundamental Flaw May Prompt Disciplined Investors to Look Elsewhere - 10/31/2013
View all notes |
Set NEW NOTE alert |
CANSLIM.net Company Profile |
SEC
News |
Chart |
Request a new note
C
A N
S L
I M
|
ULTI
-
NASDAQ
Ultimate Software Group
INTERNET - Internet Software and Services
|
$153.45
|
-1.87
-1.20% |
$156.64
|
205,070
138.75% of 50 DAV
50 DAV is 147,800
|
$162.88
-5.79%
|
10/16/2013
|
$142.95
|
PP = $151.18
|
|
MB = $158.74
|
Most Recent Note - 11/5/2013 6:46:51 PM
Y - Color code is changed to yellow while consolidating in an orderly fashion below its "max buy" level, remaining above prior highs defining initial support.
>>> FEATURED STOCK ARTICLE : Hovering Less Than -5% From 52-Week High - 10/17/2013
View all notes |
Set NEW NOTE alert |
CANSLIM.net Company Profile |
SEC
News |
Chart |
Request a new note
C
A N
S L
I M
|
Symbol/Exchange
Company Name
Industry Group |
PRICE |
CHANGE
(%Change) |
Day High |
Volume
(% DAV)
(% 50 day avg vol) |
52 Wk Hi
% From Hi |
Featured
Date |
Price
Featured |
Pivot Featured |
|
Max Buy |
VRX
-
NYSE
Valeant Pharmaceuticals
DRUGS - Drug Manufacturers - Other
|
$103.04
|
-3.41
-3.20% |
$107.63
|
1,399,433
119.16% of 50 DAV
50 DAV is 1,174,400
|
$115.40
-10.71%
|
9/11/2013
|
$100.26
|
PP = $105.50
|
|
MB = $110.78
|
Most Recent Note - 11/6/2013 4:03:50 PM
Y- Reported earnings +24% on +74% sales revenues for the Sep '13 quarter, a notch below the +25% minimum guideline (C criteria). Down today with slightly above average volume testing support near prior highs in the $105 area and its 50 DMA line. Subsequent violations may trigger technical sell signals.
>>> FEATURED STOCK ARTICLE : Found Support Above Prior Highs on Pullback - 10/10/2013
View all notes |
Set NEW NOTE alert |
CANSLIM.net Company Profile |
SEC
News |
Chart |
Request a new note
C
A N
S L
I M
|
YNDX
-
NASDAQ
Yandex N V Class A
INTERNET - Internet Information Providers
|
$36.09
|
-2.18
-5.70% |
$38.58
|
3,302,734
119.76% of 50 DAV
50 DAV is 2,757,800
|
$42.00
-14.07%
|
9/5/2013
|
$34.24
|
PP = $34.79
|
|
MB = $36.53
|
Most Recent Note - 11/7/2013 9:10:37 PM
G - Violated its 50 DMA line with today's loss on above average volume raising concerns and triggering a technical sell signal. It also violated an upward trendline connecting its April - October lows, finishing near the session low with the deterioration raising more serious concerns. Prior low ($34.31 on 10/08/13) defines the next chart support level to watch.
>>> FEATURED STOCK ARTICLE : Consolidating After Getting Extended From Sound Base - 10/28/2013
View all notes |
Set NEW NOTE alert |
CANSLIM.net Company Profile |
SEC
News |
Chart |
Request a new note
C
A N
S L
I M
|