You are not logged in.
This means you
CAN ONLY VIEW reports that were published prior to Monday, April 7, 2025.
You
MUST UPGRADE YOUR MEMBERSHIP if you want to see any current reports.
AFTER MARKET UPDATE - WEDNESDAY, SEPTEMBER 3RD, 2014
Previous After Market Report Next After Market Report >>>
|
|
|
|
DOW |
+10.72 |
17,078.28 |
+0.06% |
|
Volume |
604,007,660 |
+5% |
|
Volume |
1,739,667,660 |
+2% |
|
NASDAQ |
-25.62 |
4,572.57 |
-0.56% |
|
Advancers |
1,400 |
44% |
|
Advancers |
999 |
35% |
|
S&P 500 |
-1.56 |
2,000.72 |
-0.08% |
|
Decliners |
1,671 |
52% |
|
Decliners |
1,758 |
62% |
|
Russell 2000 |
-7.27 |
1,172.20 |
-0.62% |
|
52 Wk Highs |
186 |
|
|
52 Wk Highs |
124 |
|
|
S&P 600 |
-3.11 |
672.48 |
-0.46% |
|
52 Wk Lows |
17 |
|
|
52 Wk Lows |
31 |
|
|
 |
Indices Finished Off Session Highs After Early Gains
Kenneth J. Gruneisen - Passed the CAN SLIM® Master's Exam
Stocks finished mixed on Wednesday and the session's volume totals were reported higher on the NYSE and on the Nasdaq exchange. Breadth was negative as decliners led advancers by an 8-7 margin on the NYSE and a 9-5 margin on the NASDAQ exchange. There were 78 high-ranked companies from the CANSLIM.net Leaders List that made new 52-week highs and appeared on the CANSLIM.net BreakOuts Page, down from the prior session total of 88 stocks. New 52-week highs still solidly outnumbered new 52-week lows on the NYSE and on the Nasdaq exchange. There were gains for only 4 of the 13 high-ranked companies currently included on the Featured Stocks Page. The broader market (M criteria) has been in a "confirmed uptrend" while leadership (stocks hitting new 52-week highs) has remained healthy. Remember that disciplined investors buy stocks with superior fundamentals only after they have triggered a proper technical buy signal.
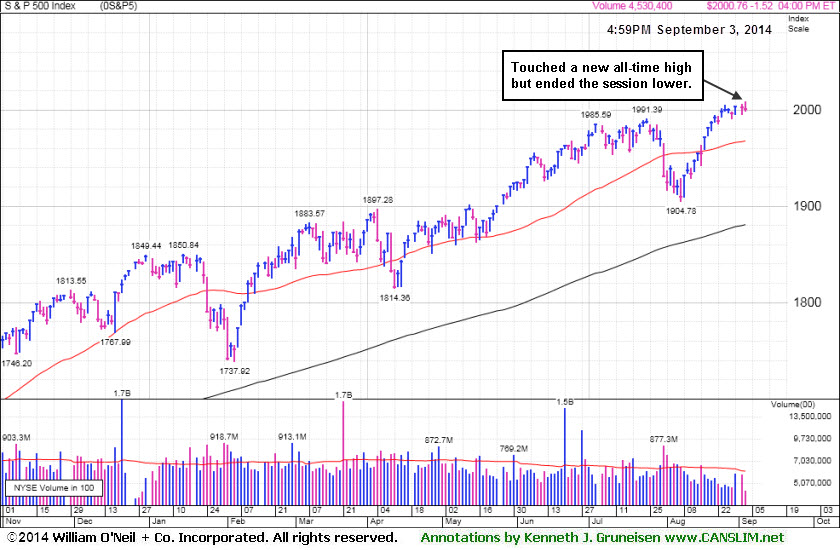
PICTURED: The S&P 500 Index touched a new all-time high but ended the session lower.
The major averages initially gained ground amid easing geopolitical tensions as Russia and Ukraine agreed on steps toward a cease-fire. Positive economic data added to the upside as factory orders increased by a record 10.5% in July.
In other action, the Fed garnered some attention as the Beige Book showed the U.S. economy strengthened in all regions in July and August. However, stocks erased early gains as investors grew cautious ahead of Thursday's European Central Bank meeting and Friday's non-farm payrolls report.
A drop in technology shares also weighed on the market. Apple (AAPL -4.2%) fell following the unveiling of new smartphones by Samsung. Shares of Facebook (FB -1.1%) edged lower. Gains in utilities and energy limited losses. Edison International (EIX +1.3%) and ConocoPhillips (COP +0.8%) gained.
Treasuries erased early losses and finished higher. The 10-year note rose 6/32 to yield 2.40%. The 30-year bond gained 20/32 to yield 3.14%.
The CANSLIM.net Featured Stocks Page shows the most action-worthy candidates and their latest notes and a Headline Link directs members to the latest detailed analysis with data-packed graphs annotated by a Certified expert along with links to additional resources. The Premium Member Homepage includes "dynamic archives" to all prior pay reports published.
|
 Kenneth J. Gruneisen started out as a licensed stockbroker in August 1987, a couple of months prior to the historic stock market crash that took the Dow Jones Industrial Average down -22.6% in a single day. He has published daily fact-based fundamental and technical analysis on high-ranked stocks online for two decades. Through FACTBASEDINVESTING.COM, Kenneth provides educational articles, news, market commentary, and other information regarding proven investment systems that work in good times and bad.
Comments contained in the body of this report are technical opinions only and are not necessarily those of Gruneisen Growth Corp. The material herein has been obtained from sources believed to be reliable and accurate, however, its accuracy and completeness cannot be guaranteed. Our firm, employees, and customers may effect transactions, including transactions contrary to any recommendation herein, or have positions in the securities mentioned herein or options with respect thereto. Any recommendation contained in this report may not be suitable for all investors and it is not to be deemed an offer or solicitation on our part with respect to the purchase or sale of any securities. |
|
 |
Weak Finish for Financial and Retail Indexes Dragged on Market
Kenneth J. Gruneisen - Passed the CAN SLIM® Master's Exam
The Broker/Dealer Index ($XBD -0.89%) and the Bank Index ($BKX -0.28%) lost ground and weakness in the Retail Index ($RLX -0.62%) was also a negative influence on the major averages on Wednesday. The Semiconductor Index ($SOX +0.24%) eked out a small gain while the Biotechnology Index ($BTK -0.05%) finished flat and the Networking Index ($NWX -0.27%) edged lower. Commodity-linked groups were mixed as the Gold & Silver Index ($XAU -0.53%) suffered a modest loss while the Oil Services Index ($OSX +0.27%) and the Integrated Oil Index ($XOI +0.35%) edged lower.
Charts courtesy www.stockcharts.com
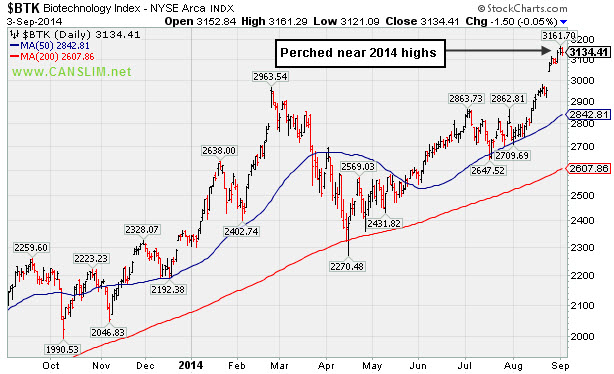
PICTURED: The Biotechnology Index ($BTK -0.05%) is perched at 2014 highs.
| Oil Services |
$OSX |
292.79 |
+0.79 |
+0.27% |
+4.18% |
| Integrated Oil |
$XOI |
1,680.15 |
+5.88 |
+0.35% |
+11.78% |
| Semiconductor |
$SOX |
644.08 |
+1.55 |
+0.24% |
+20.38% |
| Networking |
$NWX |
337.64 |
-0.92 |
-0.27% |
+4.23% |
| Broker/Dealer |
$XBD |
166.55 |
-1.50 |
-0.89% |
+3.73% |
| Retail |
$RLX |
950.62 |
-5.92 |
-0.62% |
+1.15% |
| Gold & Silver |
$XAU |
98.20 |
-0.52 |
-0.53% |
+16.70% |
| Bank |
$BKX |
71.70 |
-0.20 |
-0.28% |
+3.52% |
| Biotech |
$BTK |
3,134.41 |
-1.50 |
-0.05% |
+34.50% |
|
|
|
 |
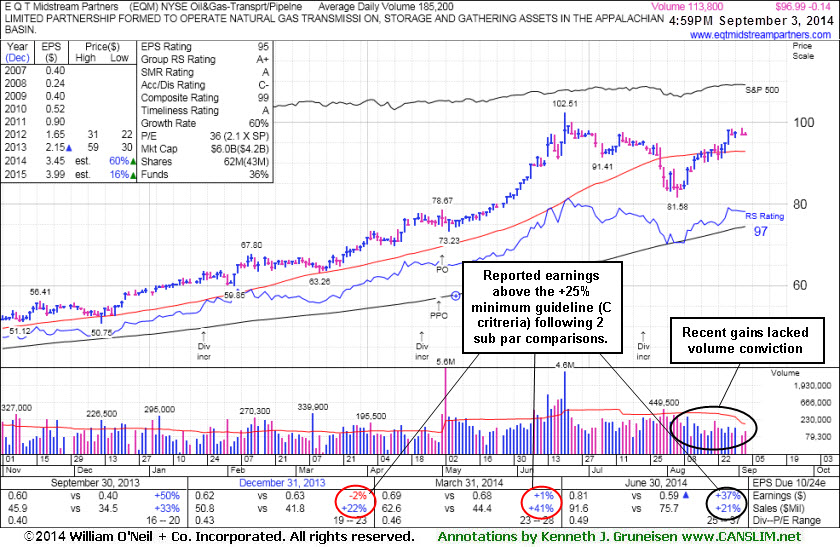
Forming New Base But Fundamental Flaws Remain a Concern
Kenneth J. Gruneisen - Passed the CAN SLIM® Master's Exam
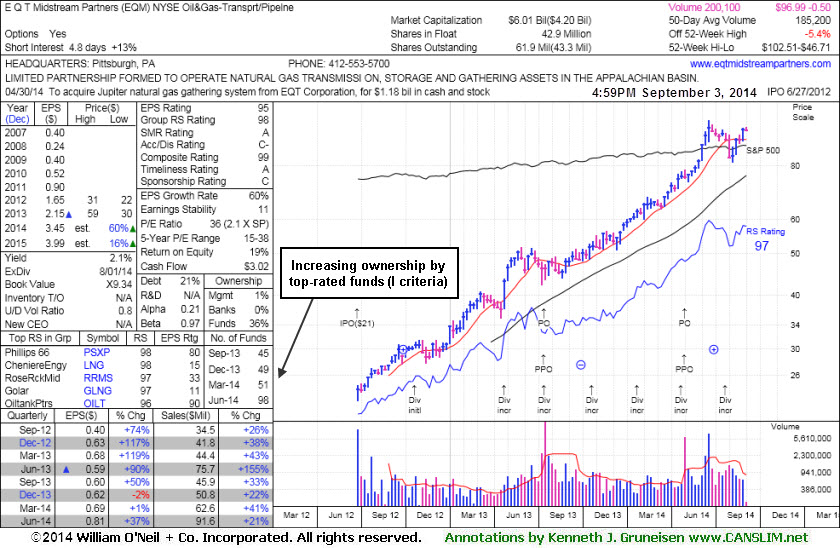
E Q T Midstream Partners' (EQM -$0.14 or -0.14% to $96.99) has very little resistance remaining due to overhead supply while perched -5.4% off its 52-week high. It has only tallied gains with light volume in recent weeks. Technically it is in good shape but no new pivot point is being cited due to previously noted fundamental shortcomings. It reported earnings +37% on +21% sales revenues for the Jun '14 quarter, an improvement after 2 sub par quarterly earnings comparisons.
It was last shown in this FSU section on 8/07/14 with annotated graphs under the headline, "Following 50-Day Moving Average Violation Gains Lacked Volume". Recent gains above its 50-day moving average (DMA) line helped its outlook to improve. It completed a new Public Offering of 10.75 Million common units on 5/01/14. It traded up as much as +92.8% since first highlighted in yellow in the 12/12/13 mid-day report (read here) with pivot point based on its 11/18/13 high plus 10 cents. It completed a new Public Offering on 7/16/13, then made gradual progress afterward.
This MLP in the Natural Gas business has seen the number of top-rated funds owning its shares rise from 20 in Jun '12 to 98 in Jun '14, a reassuring sign concerning the I criteria. However, its Up/Down Volume Ratio of 0.8 is an unbiased indication its shares have been under slight distributional pressure over the past 50 days.
|
|
|
Color Codes Explained :
Y - Better candidates highlighted by our
staff of experts.
G - Previously featured
in past reports as yellow but may no longer be buyable under the
guidelines.
***Last / Change / Volume data in this table is the closing quote data***
Symbol/Exchange
Company Name
Industry Group |
PRICE |
CHANGE
(%Change) |
Day High |
Volume
(% DAV)
(% 50 day avg vol) |
52 Wk Hi
% From Hi |
Featured
Date |
Price
Featured |
Pivot Featured |
|
Max Buy |
ACT
-
NYSE
Actavis plc
Medical-Generic Drugs
|
$229.07
|
+2.09
0.92% |
$229.41
|
1,511,894
61.61% of 50 DAV
50 DAV is 2,454,000
|
$230.77
-0.74%
|
6/20/2014
|
$216.53
|
PP = $230.87
|
|
MB = $242.41
|
Most Recent Note - 8/28/2014 6:16:40 PM
Y - Quietly perched near its 52-week high today trading very light volume. Subsequent volume-driven gains to new highs may trigger a technical buy signal. See the latest FSU analysis for more details and new annotated graphs.
>>> FEATURED STOCK ARTICLE : Quietly Perched Within Striking Distance of 52-Week High - 8/28/2014
View all notes |
Set NEW NOTE alert |
CANSLIM.net Company Profile |
SEC
News |
Chart |
Request a new note
C
A N
S L
I M


|
AFSI
-
NASDAQ
Amtrust Financial Svcs
INSURANCE - Property and; Casualty Insurance
|
$44.90
|
+0.87
1.98% |
$45.43
|
653,500
134.58% of 50 DAV
50 DAV is 485,600
|
$47.10
-4.67%
|
5/21/2014
|
$44.85
|
PP = $44.85
|
|
MB = $47.09
|
Most Recent Note - 8/28/2014 6:18:32 PM
G - Consolidating above support at its 50 DMA line, still only -6.5% off its 52-week high. Relative Strength Rating has slumped to 69, below the 80+ minimum guideline for buy candidates. Faces resistance due to overhead supply up through the $47 level.
>>> FEATURED STOCK ARTICLE : Relative Strength Rating Slumped While Building Longer Base - 8/18/2014
View all notes |
Set NEW NOTE alert |
CANSLIM.net Company Profile |
SEC
News |
Chart |
Request a new note
C
A N
S L
I M
|
BITA
-
NYSE
Bitauto Hldgs Ltd Ads
Internet-Content
|
$88.88
|
+1.05
1.20% |
$89.00
|
2,351,948
174.22% of 50 DAV
50 DAV is 1,350,000
|
$98.28
-9.56%
|
6/26/2014
|
$46.20
|
PP = $47.03
|
|
MB = $49.38
|
 Most Recent Note - 9/2/2014 6:39:57 PM
G - Finished near the session high today for a small gain with above average volume. Fundamentals remain strong, however recently enduring distributional pressure and noted repeatedly with caution - "Has the look of a 'climax run' with volume-driven gains getting very extended from its prior base."
>>> FEATURED STOCK ARTICLE : Finished Near Session Low - Noted With Look of "Climax Run" - 8/27/2014
View all notes |
Set NEW NOTE alert |
CANSLIM.net Company Profile |
SEC
News |
Chart |
Request a new note
C
A N
S L
I M
|
EQM
-
NYSE
E Q T Midstream Partners
ENERGY - Oil and Gas Pipelines
|
$97.13
|
-0.36
-0.37% |
$98.68
|
82,802
30.11% of 50 DAV
50 DAV is 275,000
|
$102.51
-5.25%
|
12/12/2013
|
$53.17
|
PP = $56.51
|
|
MB = $59.34
|
Most Recent Note - 9/2/2014 6:34:11 PM
G - Little resistance remains due to overhead supply while perched within close striking distance of its 52-week high with volume totals cooling in recent weeks. Reported earnings +37% on +21% sales revenues for the Jun '14 quarter, an improvement after 2 sub par quarterly earnings comparisons.
>>> FEATURED STOCK ARTICLE : Following 50-Day Moving Average Violation Gains Lacked Volume - 8/7/2014
View all notes |
Set NEW NOTE alert |
CANSLIM.net Company Profile |
SEC
News |
Chart |
Request a new note
C
A N
S L
I M
|
FB
-
NASDAQ
Facebook Inc Cl A
INTERNET
|
$76.68
|
+1.86
2.49% |
$76.70
|
34,720,521
90.26% of 50 DAV
50 DAV is 38,467,000
|
$76.74
-0.08%
|
7/24/2014
|
$76.00
|
PP = $72.69
|
|
MB = $76.32
|
Most Recent Note - 9/2/2014 6:36:55 PM
G - Color code is changed to green after it rallied for a best-ever close and finished near the session high with today's gain on higher volume but below average volume. Prior highs in the $72 area define initial support above its 50 DMA line ($70.98).
>>> FEATURED STOCK ARTICLE : Making Limited Headway But Holding Ground Since Gap Up - 8/20/2014
View all notes |
Set NEW NOTE alert |
CANSLIM.net Company Profile |
SEC
News |
Chart |
Request a new note
C
A N
S L
I M
|
Symbol/Exchange
Company Name
Industry Group |
PRICE |
CHANGE
(%Change) |
Day High |
Volume
(% DAV)
(% 50 day avg vol) |
52 Wk Hi
% From Hi |
Featured
Date |
Price
Featured |
Pivot Featured |
|
Max Buy |
NXPI
-
NASDAQ
Nxp Semiconductors N V
ELECTRONICS - Semiconductor - Broad Line
|
$69.07
|
+0.55
0.80% |
$70.00
|
4,400,949
153.77% of 50 DAV
50 DAV is 2,862,000
|
$69.50
-0.62%
|
8/29/2014
|
$68.50
|
PP = $67.89
|
|
MB = $71.28
|
Most Recent Note - 8/29/2014 5:43:43 PM
Y - Was highlighted in yellow with pivot point cited based on its 7/07/14 high plus 10 cents in the earlier mid-day report (read here). Its gap up gain backed by heavy volume for a new 52-week high triggered a technical buy signal. No overhead supply remains to act as resistance. Quarterly earnings (C criteria) through Jun '14 have shown strong growth and its annual earnings (A criteria) history is a good match the investment system guidelines. See the latest FSU analysis for more details and annotated graphs.
>>> FEATURED STOCK ARTICLE : Gap Up For New High With Volume Triggered Technical Buy Signal - 8/29/2014
View all notes |
Set NEW NOTE alert |
CANSLIM.net Company Profile |
SEC
News |
Chart |
Request a new note
C
A N
S L
I M
|
PANW
-
NYSE
Palo Alto Networks
Computer Sftwr-Security
|
$89.74
|
+4.75
5.59% |
$90.00
|
4,501,694
327.63% of 50 DAV
50 DAV is 1,374,000
|
$87.79
2.22%
|
7/30/2014
|
$84.21
|
PP = $85.88
|
|
MB = $90.17
|
Most Recent Note - 9/2/2014 6:12:59 PM
Y - Hit a new 52-week high and rallied above its pivot point triggering a new (or add-on) technical buy signal with today's gain backed by more than 3 times average volume. No resistance remains due to overhead supply. Subsequent violations of the 50 DMA line or the 8/28/14 low ($79.71) would trigger technical sell signals. Reports earnings on 9/09/14 and volume and volatility often increase near earnings news.
>>> FEATURED STOCK ARTICLE : Building on New Base Pattern Above 50-Day Average - 8/11/2014
View all notes |
Set NEW NOTE alert |
CANSLIM.net Company Profile |
SEC
News |
Chart |
Request a new note
C
A N
S L
I M
|
STRT
-
NASDAQ
Strattec Security Corp
AUTOMOTIVE - Auto Parts
|
$82.25
|
+2.01
2.50% |
$89.87
|
48,898
168.61% of 50 DAV
50 DAV is 29,000
|
$81.94
0.38%
|
8/22/2014
|
$71.47
|
PP = $73.97
|
|
MB = $77.67
|
Most Recent Note - 9/2/2014 6:20:21 PM
G - Spiked to another new 52-week high today but erased much of its gain and finished in the lower third of its intra-day range, a sign of distributional pressure. Volume was +72% above average behind the gain on the prior session, however it was getting extended from its prior base by the time volume-driven gain helped clinch a technical buy signal.
>>> FEATURED STOCK ARTICLE : Small Supply of Shares and Perched Near All-Time Highs - 8/22/2014
View all notes |
Set NEW NOTE alert |
CANSLIM.net Company Profile |
SEC
News |
Chart |
Request a new note
C
A N
S L
I M
|
TARO
-
NYSE
Taro Pharmaceutical Inds
DRUGS - Drug Manufacturers - Other
|
$159.75
|
-1.41
-0.87% |
$163.98
|
235,360
294.20% of 50 DAV
50 DAV is 80,000
|
$165.30
-3.36%
|
7/30/2014
|
$144.24
|
PP = $149.99
|
|
MB = $157.49
|
Most Recent Note - 9/2/2014 6:22:56 PM
G - Churned above average volume at its 52-week high today, finishing with a loss and near the session low. Enduring distributional pressure, and it was previously noted with caution - "Extended from any sound base. Recently reported earnings for the Jun '14 quarter below the +25% minimum earnings guideline (C criteria) raising fundamental concerns." See the latest FSU analysis for more details and new annotated graphs.
>>> FEATURED STOCK ARTICLE : Churning Action Indicative of Distributional Pressure - 9/2/2014
View all notes |
Set NEW NOTE alert |
CANSLIM.net Company Profile |
SEC
News |
Chart |
Request a new note
C
A N
S L
I M
|
TRN
-
NYSE
Trinity Industries Inc
TRANSPORTATION - Railroads
|
$49.66
|
+1.28
2.65% |
$49.66
|
3,185,297
123.99% of 50 DAV
50 DAV is 2,569,000
|
$49.17
1.00%
|
4/30/2014
|
$37.79
|
PP = $38.03
|
|
MB = $39.93
|
Most Recent Note - 9/2/2014 6:26:36 PM
G - Hit another new 52-week high with today's volume-driven gain. It has not formed a sound base. Prior highs near $46-47 define near-term support above its 50 DMA line.
>>> FEATURED STOCK ARTICLE : Rallying Into New High Territory Without Forming New Base - 8/25/2014
View all notes |
Set NEW NOTE alert |
CANSLIM.net Company Profile |
SEC
News |
Chart |
Request a new note
C
A N
S L
I M
|
Symbol/Exchange
Company Name
Industry Group |
PRICE |
CHANGE
(%Change) |
Day High |
Volume
(% DAV)
(% 50 day avg vol) |
52 Wk Hi
% From Hi |
Featured
Date |
Price
Featured |
Pivot Featured |
|
Max Buy |
UA
-
NYSE
Under Armour Inc Cl A
CONSUMER NON-DURABLES - Textile - Apparel Clothing
|
$71.13
|
+2.77
4.05% |
$71.17
|
3,609,920
155.13% of 50 DAV
50 DAV is 2,327,000
|
$71.79
-0.92%
|
7/10/2014
|
$58.50
|
PP = $60.79
|
|
MB = $63.83
|
Most Recent Note - 9/2/2014 6:28:51 PM
G - Finished near the session high and at a best-ever close with today's considerable volume-driven gain. No resistance remains due to overhead supply. Fundamental concerns were raised by earnings reported +0% on +34% sales revenues for the Jun '14 quarter, below the +25% minimum earnings guideline (C criteria), yet the company raised its guidance.
>>> FEATURED STOCK ARTICLE : Holding Ground Near All-Time Highs Despite Fundamental Concerns - 8/26/2014
View all notes |
Set NEW NOTE alert |
CANSLIM.net Company Profile |
SEC
News |
Chart |
Request a new note
C
A N
S L
I M
|
WLK
-
NYSE
Westlake Chemical Corp
CHEMICALS - Specialty Chemicals
|
$97.96
|
+0.83
0.85% |
$98.35
|
530,093
104.35% of 50 DAV
50 DAV is 508,000
|
$97.16
0.82%
|
4/29/2014
|
$72.79
|
PP = $69.31
|
|
MB = $72.78
|
Most Recent Note - 9/2/2014 6:30:11 PM
G - Hit another new 52-week high with higher volume (near average) behind today's 4th consecutive gain. Its 50 DMA line defines support where a subsequent violation would raise greater concerns and trigger a technical sell signal. Technical strength has continued despite having reported earnings +11% on +6% sales revenues for the Jun '14 quarter, below the +25% minimum earnings guideline (C criteria), raising fundamental concerns.
>>> FEATURED STOCK ARTICLE : Technically Strong Despite Fundamental Concerns Raised By Most Current Quarterly Earnings - 8/21/2014
View all notes |
Set NEW NOTE alert |
CANSLIM.net Company Profile |
SEC
News |
Chart |
Request a new note
C
A N
S L
I M
|
YY
-
NASDAQ
YY Inc Ads
INTERNET - Internet Service Providers
|
$87.92
|
+3.03
3.57% |
$88.00
|
1,042,558
76.83% of 50 DAV
50 DAV is 1,357,000
|
$90.93
-3.31%
|
8/19/2014
|
$85.81
|
PP = $91.03
|
|
MB = $95.58
|
Most Recent Note - 9/2/2014 6:31:30 PM
Y - Volume was below average behind today's 2nd consecutive gain. Subsequent volume-driven gains for new highs may trigger a new technical buy signal. Its 50 DMA line defines near-term support to watch.
>>> FEATURED STOCK ARTICLE : Encountered Distributional Peressure Near Prior High - 8/19/2014
View all notes |
Set NEW NOTE alert |
CANSLIM.net Company Profile |
SEC
News |
Chart |
Request a new note
C
A N
S L
I M
|
|
|
|
THESE ARE NOT BUY RECOMMENDATIONS!
Comments contained in the body of this report are technical
opinions only. The material herein has been obtained
from sources believed to be reliable and accurate, however,
its accuracy and completeness cannot be guaranteed.
This site is not an investment advisor, hence it does
not endorse or recommend any securities or other investments.
Any recommendation contained in this report may not
be suitable for all investors and it is not to be deemed
an offer or solicitation on our part with respect to
the purchase or sale of any securities. All trademarks,
service marks and trade names appearing in this report
are the property of their respective owners, and are
likewise used for identification purposes only.
This report is a service available
only to active Paid Premium Members.
You may opt-out of receiving report notifications
at any time. Questions or comments may be submitted
by writing to Premium Membership Services 665 S.E. 10 Street, Suite 201 Deerfield Beach, FL 33441-5634 or by calling 1-800-965-8307
or 954-785-1121.
|
|
|

