You are not logged in.
This means you
CAN ONLY VIEW reports that were published prior to Thursday, April 24, 2025.
You
MUST UPGRADE YOUR MEMBERSHIP if you want to see any current reports.
AFTER MARKET UPDATE - THURSDAY, AUGUST 24TH, 2023
Previous After Market Report Next After Market Report >>>
|
|
|
|
DOW |
-373.56 |
34,099.42 |
-1.08% |
|
Volume |
1,019,432,202 |
+18% |
|
Volume |
4,469,692,600 |
+6% |
|
NASDAQ |
-257.06 |
13,463.97 |
-1.87% |
|
Advancers |
681 |
24% |
|
Advancers |
1,259 |
29% |
|
S&P 500 |
-59.70 |
4,376.31 |
-1.35% |
|
Decliners |
2,156 |
76% |
|
Decliners |
3,068 |
71% |
|
Russell 2000 |
-23.75 |
1,846.28 |
-1.27% |
|
52 Wk Highs |
46 |
|
|
52 Wk Highs |
67 |
|
|
S&P 600 |
-11.38 |
1,194.87 |
-0.94% |
|
52 Wk Lows |
87 |
|
|
52 Wk Lows |
266 |
|
|
Last week's distributional action, clearly negative breadth, and waning leadership signaled a more worrisome market correction (M criteria). Greater caution is called for and disciplined investors should be ready to reduce exposure and raise cash by selling any weakening stocks on a case-by-case basis.
|
 |
Major Indices Encountered More Distributional Pressure
Kenneth J. Gruneisen - Passed the CAN SLIM® Master's Exam
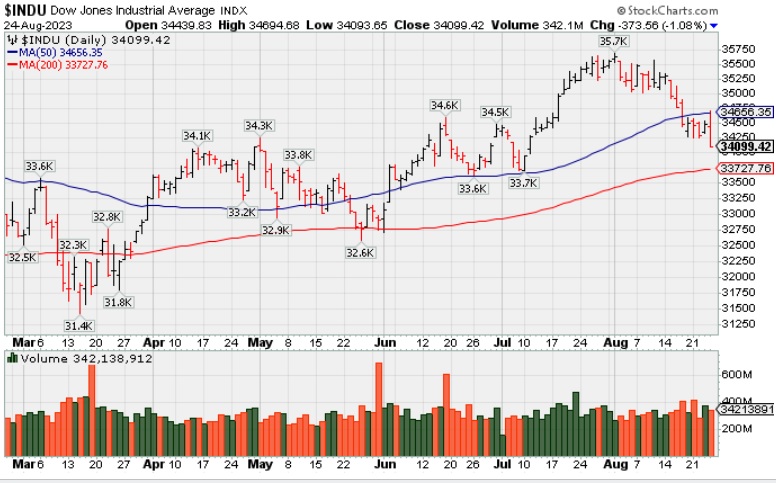
The major indices lost ground on Thursday and closed near their lows of the day, which left the S&P 500 below 4,400. Volume totals reported were higher than the prior session on the NYSE and on the Nasdaq exchange, indicative of greater institutional selling pressure termed "distribution". Breadth was negative as decliners led advancers by more than a 3-1 margin on the NYSE and by a 5-2 margin on the Nasdaq exchange. There were 14 high-ranked companies from the Leaders List that hit a new 52-week high and were listed on the BreakOuts Page, versus the total of 22 on the prior session. New 52-week lows totals expanded and solidly outnumbered new 52-week highs totals on both the NYSE and on the Nasdaq exchange. The major indices are in a correction (M criteria). New buying efforts should be avoided until a new confirmed rally marked by a solid follow-through day.
PICTURED: The Dow Jones Industrial Average slumped further below its 50-day moving average (DMA) line toward its 200 DMA line.
All 11 S&P 500 sectors closed in the red with losses ranging from 0.2% (financials) to 2.2% (information technology). Weak semiconductor stocks were a big influence as the PHLX Semiconductor Index sank 3.4%. Even NVIDIA (NVDA +0.10%) finished flat after trading up as much 6.6%.
Notable laggards included Dow component Boeing (BA -4.93%) as a new flaw found in the 737 MAX will slow deliveries. T-Mobile (TMUS -2.21%) fell after planning to cut approximately 7% of its staff. Dollar Tree Stores (DLTR -12.90%) disappointed with its Q3 outlook.
Treasury yields settled slightly higher. The 2-yr note yield rose eight basis points to 5.01% and the 10-yr note yield rose four basis points to 4.24%. There was another encouraging initial jobless claims report and ahead of Fed Chair Powell's speech at the Jackson Hole Symposium on Friday. |
 Kenneth J. Gruneisen started out as a licensed stockbroker in August 1987, a couple of months prior to the historic stock market crash that took the Dow Jones Industrial Average down -22.6% in a single day. He has published daily fact-based fundamental and technical analysis on high-ranked stocks online for two decades. Through FACTBASEDINVESTING.COM, Kenneth provides educational articles, news, market commentary, and other information regarding proven investment systems that work in good times and bad.
Comments contained in the body of this report are technical opinions only and are not necessarily those of Gruneisen Growth Corp. The material herein has been obtained from sources believed to be reliable and accurate, however, its accuracy and completeness cannot be guaranteed. Our firm, employees, and customers may effect transactions, including transactions contrary to any recommendation herein, or have positions in the securities mentioned herein or options with respect thereto. Any recommendation contained in this report may not be suitable for all investors and it is not to be deemed an offer or solicitation on our part with respect to the purchase or sale of any securities. |
|
 |
Retail, Tech, and Commodity-Linked Groups Led Decliners
Kenneth J. Gruneisen - Passed the CAN SLIM® Master's Exam
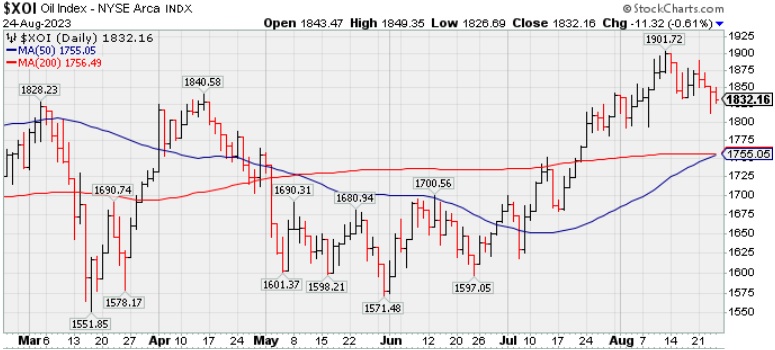
The Retail Index ($RLX -2.21%) created a drag on the major averages. The Bank Index ($BKX +0.10%) was little changed and the Broker/Dealer Index ($XBD -0.29%) edged lower. The Semiconductor Index ($SOX -3.35%) led the tech sector lower and the Networking Index ($NWX -2.43%) also slumped while the Biotech Index ($BTK -0.77%) suffered a smaller loss. Commodity-linked groups also had a negative bias as Gold & Silver Index ($XAU -0.62%), Oil Services Index ($OSX -1.22%) and the Integrated Oil Index ($XOI -0.61%) lost ground.
PICTURED: The Integrated Oil Index ($XOI -0.61%) is consolidating well above its 50-day and 200-day moving average (DMA) lines.
| Oil Services |
$OSX |
89.81 |
-1.11 |
-1.22% |
+7.09% |
| Integrated Oil |
$XOI |
1,832.16 |
-11.32 |
-0.61% |
+2.51% |
| Semiconductor |
$SOX |
3,481.30 |
-120.71 |
-3.35% |
+37.49% |
| Networking |
$NWX |
770.54 |
-19.16 |
-2.43% |
-1.63% |
| Broker/Dealer |
$XBD |
496.77 |
-1.45 |
-0.29% |
+10.61% |
| Retail |
$RLX |
3,499.12 |
-79.26 |
-2.21% |
+27.06% |
| Gold & Silver |
$XAU |
115.62 |
-0.72 |
-0.62% |
-4.34% |
| Bank |
$BKX |
80.41 |
+0.08 |
+0.10% |
-20.27% |
| Biotech |
$BTK |
5,213.55 |
-40.39 |
-0.77% |
-1.28% |
|
|
|
 |
Rebounded Near 50-Day Moving Average Line
Kenneth J. Gruneisen - Passed the CAN SLIM® Master's Exam
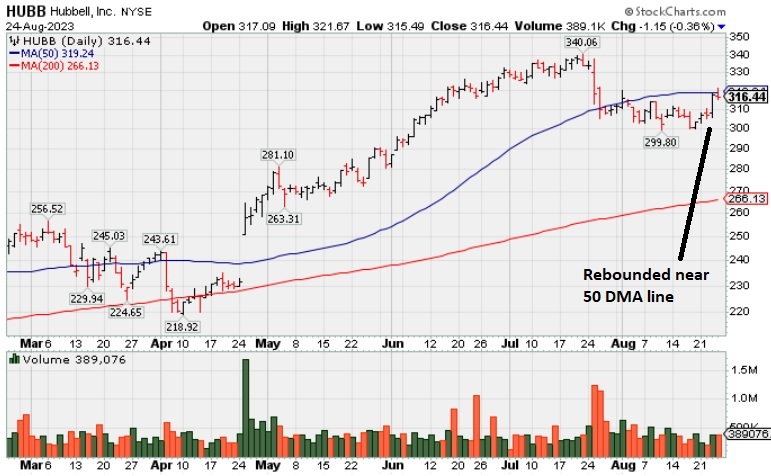
Hubbell (HUBB -$1.15 or -0.36% to $316.44) pulled back after rebounding near its 50-day moving average (DMA) line ($319.27) and perched only -6.9% off its all-time high. A rebound above the 50 DMA line is needed for its outlook to improve. Fundamentals remain strong after Jun '23 earnings rose +45% on +9% sales revenues versus the year-ago period.
HUBB was highlighted yellow in the 4/25/23 mid-day report (read here) with pivot point cited based on its 3/06/23 high as it gapped up after a 4-month "double bottom" base. It was last shown in great detail in this FSU section on 7/26/23 with an annotated graph under the headline "Pulled Back Undercutting 50 Day Moving Average Line". Quarterly earnings increases have been above the +25% minimum (C criteria). Annual earnings history (A criteria) had a downturn in FY '20 like many companies during the pandemic. It has a 95 Earnings Per Share Rating, well above the 80+ minimum for buy candidates.The high-ranked Electrical-Power/Equipmt firm has 53.6 million shares outstanding (S criteria) which can contribute to greater price volatility in the event of institutional buying or selling. The number of top-rated funds owning its shares rose from 805 in Jun '22 to 1,409 in Jun '23, a reassuring sign concerning the I criteria. The current Up/Down Volume Ratio of 0.8 is an unbiased indication it has been under distributional pressure over the past 50 days. It has an A Timeliness Rating and a B Sponsorship Rating.
|
|
|
Color Codes Explained :
Y - Better candidates highlighted by our
staff of experts.
G - Previously featured
in past reports as yellow but may no longer be buyable under the
guidelines.
***Last / Change / Volume data in this table is the closing quote data***
|
|
|
THESE ARE NOT BUY RECOMMENDATIONS!
Comments contained in the body of this report are technical
opinions only. The material herein has been obtained
from sources believed to be reliable and accurate, however,
its accuracy and completeness cannot be guaranteed.
This site is not an investment advisor, hence it does
not endorse or recommend any securities or other investments.
Any recommendation contained in this report may not
be suitable for all investors and it is not to be deemed
an offer or solicitation on our part with respect to
the purchase or sale of any securities. All trademarks,
service marks and trade names appearing in this report
are the property of their respective owners, and are
likewise used for identification purposes only.
This report is a service available
only to active Paid Premium Members.
You may opt-out of receiving report notifications
at any time. Questions or comments may be submitted
by writing to Premium Membership Services 665 S.E. 10 Street, Suite 201 Deerfield Beach, FL 33441-5634 or by calling 1-800-965-8307
or 954-785-1121.
|
|
|