You are not logged in.
This means you
CAN ONLY VIEW reports that were published prior to Monday, March 24, 2025.
You
MUST UPGRADE YOUR MEMBERSHIP if you want to see any current reports.
AFTER MARKET UPDATE - FRIDAY, AUGUST 5TH, 2022
Previous After Market Report Next After Market Report >>>
|
|
|
|
DOW |
+76.65 |
32,803.47 |
+0.23% |
|
Volume |
825,505,832 |
-6% |
|
Volume |
4,867,869,800 |
-10% |
|
NASDAQ |
-63.03 |
12,657.55 |
-0.50% |
|
Advancers |
1,459 |
47% |
|
Advancers |
2,389 |
54% |
|
S&P 500 |
-6.75 |
4,145.19 |
-0.16% |
|
Decliners |
1,660 |
53% |
|
Decliners |
2,038 |
46% |
|
Russell 2000 |
+15.37 |
1,921.82 |
+0.81% |
|
52 Wk Highs |
27 |
|
|
52 Wk Highs |
70 |
|
|
S&P 600 |
+6.10 |
1,239.40 |
+0.49% |
|
52 Wk Lows |
46 |
|
|
52 Wk Lows |
66 |
|
|
 |
Major Indices Ended Mixed With Breadth Also Evenly Mixed
Kenneth J. Gruneisen - Passed the CAN SLIM® Master's Exam
The S&P 500 slipped 0.2%, eking out a weekly advance of 0.4%. The Nasdaq Composite shed 0.5%, still logging a five-session gain of 2.2%. Both benchmarks notched their first three-week winning stretch since the very beginning of April. The Dow added 76 points in a late-session rebound, paring its weekly decline to 0.1%..The volume totals reported were lighter than the prior session on the NYSE and on the Nasdaq exchange. Advancers led decliners by a narrow margin on the Nasdaq exchange but decliners narrowly outnumbered advancers on the NYSE. There were 25 high-ranked companies from the Leaders List that hit new 52-week highs and were listed on the BreakOuts Page, versus the total of 22 on the prior session. New 52-week highs were outnumbered by new 52-week lows on the NYSE, meanwhile news highs outnumbered new lows on the Nasdaq exchange for again. The market is in a confirmed uptrend (M criteria). Any sustainable rally requires a healthy crop of leading stocks hitting new highs, so the recent improvement in leadership was a reassuring sign.
Chart courtesy of www.stockcharts.com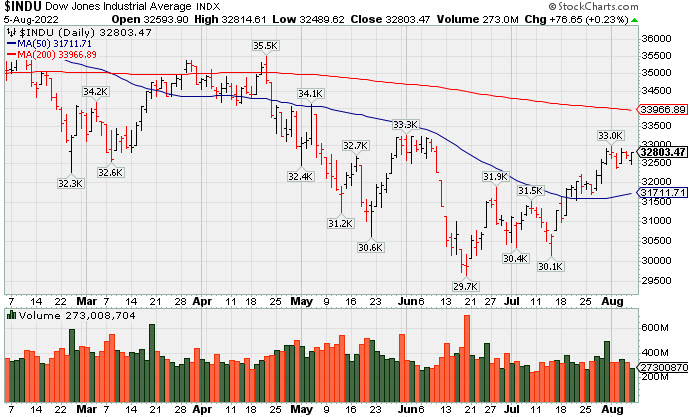 PICTURED: The Dow Jones Industrial Average posted a gain with lighter volume. It has recently been making progress above its June high but still remains well below its 200 DMA line.
U.S. equities finished mixed on Friday as Wall Street assessed the likely path of Federal Reserve (Fed) rate hikes in light of the latest monthly jobs data. The Labor Department showed the U.S. economy added 528,000 non-farm payrolls in July, the most since February, and more than double estimates of a 250,000 increase. The unemployment rate ticked down to 3.5%, while average hourly earnings climbed 5.2% year-over-year, matching the prior month’s upwardly revised gain.
Stocks traded mostly lower as the update dampened optimism over a central bank policy pivot. Instead, the report bolstered expectations for another ultra-aggressive 0.75% rate hike in September as it provided evidence of economic resiliency following hawkish Fedspeak this week.
Treasuries tumbled, with the more Fed-sensitive two-year note yield closing the week 36 basis points (0.36%) higher at 3.24%. The yield on the 10-year note jumped to 2.83%, but remained well below the shorter-term yield as the inversion of this part of the yield curve deepened amid recessionary concerns. In FOREX trading, a gauge of the U.S. dollar surged 0.8%. In commodities, West Texas Intermediate crude retreated over 10% for the week, closing at $88.35/barrel.
In earnings, Warner Bros Discovery Inc. (WBD -16.53%) fell following a quarterly loss and reduction to its forward guidance. In other corporate news, Tesla Inc. (TSLA -6.53%) after its shareholders approved a three-for-one stock split.
|
 Kenneth J. Gruneisen started out as a licensed stockbroker in August 1987, a couple of months prior to the historic stock market crash that took the Dow Jones Industrial Average down -22.6% in a single day. He has published daily fact-based fundamental and technical analysis on high-ranked stocks online for two decades. Through FACTBASEDINVESTING.COM, Kenneth provides educational articles, news, market commentary, and other information regarding proven investment systems that work in good times and bad.
Comments contained in the body of this report are technical opinions only and are not necessarily those of Gruneisen Growth Corp. The material herein has been obtained from sources believed to be reliable and accurate, however, its accuracy and completeness cannot be guaranteed. Our firm, employees, and customers may effect transactions, including transactions contrary to any recommendation herein, or have positions in the securities mentioned herein or options with respect thereto. Any recommendation contained in this report may not be suitable for all investors and it is not to be deemed an offer or solicitation on our part with respect to the purchase or sale of any securities. |
|
 |
Bank, Biotech, and Energy-Linked Groups Rose
Kenneth J. Gruneisen - Passed the CAN SLIM® Master's Exam
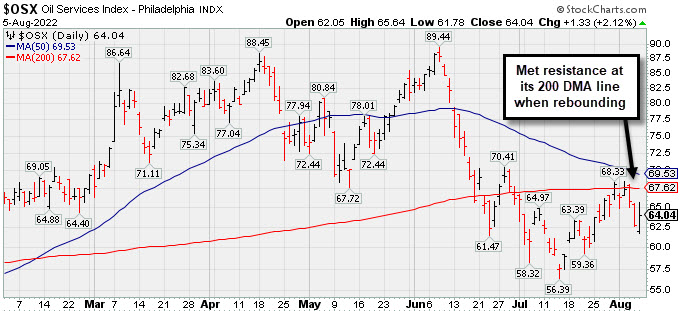
The Bank Index ($BKX +1.29%) rose, the Broker/Dealer Index ($XBD +0.06%) finished flat, and the Retail Index ($RLX -0.45%) edged lower on Friday. The tech sector was mixed as the Semiconductor Index ($SOX -0.91%) lost ground, the Networking Index ($NWX +0.08%) finished flat, and the Biotech Index ($BTK +0.61%) edged higher. The Oil Services Index ($OSX +2.12%) and Integrated Oil Index ($XOI +2.17%) both posted solid gains while the Gold & Silver Index ($XAU -0.17%) edged lower.
PICTURED: The Oil Services Index ($OSX +2.12%) met resistance when recently rebounding to its 200-day moving average (DMA) line.
| Oil Services |
$OSX |
64.04 |
+1.33 |
+2.12% |
+21.48% |
| Integrated Oil |
$XOI |
1,502.55 |
+31.87 |
+2.17% |
+27.53% |
| Semiconductor |
$SOX |
3,053.39 |
-28.01 |
-0.91% |
-22.62% |
| Networking |
$NWX |
807.50 |
+0.67 |
+0.08% |
-16.85% |
| Broker/Dealer |
$XBD |
451.19 |
+0.28 |
+0.06% |
-7.33% |
| Retail |
$RLX |
3,480.01 |
-15.59 |
-0.45% |
-17.66% |
| Gold & Silver |
$XAU |
108.00 |
-0.19 |
-0.17% |
-18.46% |
| Bank |
$BKX |
108.57 |
+1.38 |
+1.29% |
-17.89% |
| Biotech |
$BTK |
5,096.78 |
+30.94 |
+0.61% |
-7.64% |
|
|
|
 |
Featured Stocks
Kenneth J. Gruneisen - Passed the CAN SLIM® Master's Exam
See the Featured Stocks page. |
|
|
Color Codes Explained :
Y - Better candidates highlighted by our
staff of experts.
G - Previously featured
in past reports as yellow but may no longer be buyable under the
guidelines.
***Last / Change / Volume data in this table is the closing quote data***
|
|
|
THESE ARE NOT BUY RECOMMENDATIONS!
Comments contained in the body of this report are technical
opinions only. The material herein has been obtained
from sources believed to be reliable and accurate, however,
its accuracy and completeness cannot be guaranteed.
This site is not an investment advisor, hence it does
not endorse or recommend any securities or other investments.
Any recommendation contained in this report may not
be suitable for all investors and it is not to be deemed
an offer or solicitation on our part with respect to
the purchase or sale of any securities. All trademarks,
service marks and trade names appearing in this report
are the property of their respective owners, and are
likewise used for identification purposes only.
This report is a service available
only to active Paid Premium Members.
You may opt-out of receiving report notifications
at any time. Questions or comments may be submitted
by writing to Premium Membership Services 665 S.E. 10 Street, Suite 201 Deerfield Beach, FL 33441-5634 or by calling 1-800-965-8307
or 954-785-1121.
|
|
|