You are not logged in.
This means you
CAN ONLY VIEW reports that were published prior to Friday, April 11, 2025.
You
MUST UPGRADE YOUR MEMBERSHIP if you want to see any current reports.
AFTER MARKET UPDATE - THURSDAY, JUNE 30TH, 2016
Previous After Market Report Next After Market Report >>>
|
|
|
|
DOW |
+235.31 |
17,929.99 |
+1.33% |
|
Volume |
1,337,907,380 |
+30% |
|
Volume |
1,972,982,050 |
+3% |
|
NASDAQ |
+63.42 |
4,842.67 |
+1.33% |
|
Advancers |
2,436 |
79% |
|
Advancers |
2,193 |
72% |
|
S&P 500 |
+28.09 |
2,098.86 |
+1.36% |
|
Decliners |
629 |
21% |
|
Decliners |
868 |
28% |
|
Russell 2000 |
+20.31 |
1,151.92 |
+1.79% |
|
52 Wk Highs |
379 |
|
|
52 Wk Highs |
103 |
|
|
S&P 600 |
+14.49 |
708.36 |
+2.09% |
|
52 Wk Lows |
17 |
|
|
52 Wk Lows |
27 |
|
|
 |
Indices Posted Solid Gains on Higher Volume With More Leadership
Kenneth J. Gruneisen - Passed the CAN SLIM® Master's Exam
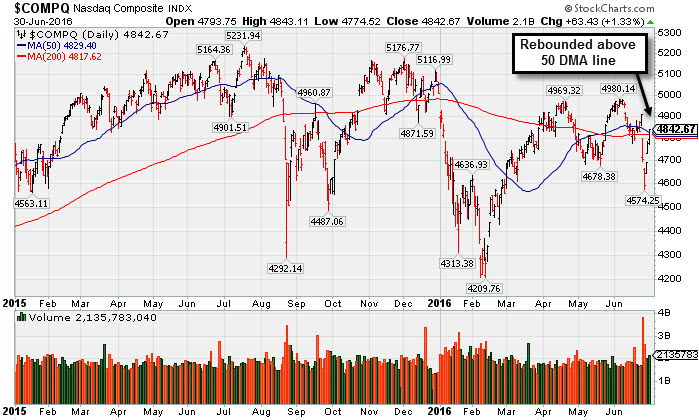
Stocks finished firmly higher on Thursday. The Dow was up 235 points to 17929. The S&P 500 added 28 points to 2098 and the Nasdaq Composite gained 63 points to 4842. Volume totals were higher than the prior session on the NYSE and on the Nasdaq exchange as the indices further rebounded from a high-volume downdraft. Advancers led decliners by nearly a 4-1 margin on the NYSE and more than 2-1 on the Nasdaq exchange. Leadership improved as there were 66 high-ranked companies from the Leaders List that made new 52-week highs and were listed on the BreakOuts Page, versus the total of 43 on the prior session. New 52-week highs more solidly outnumbered new 52-week lows on both the NYSE and the Nasdaq exchange. PICTURED: The Nasdaq Composite Index rebounded above its 50-day moving average (DMA) line on higher volume than the prior session.
The S&P 500 Index, Dow Jones Industrial Average and Nasdaq Composite Index have unanimously rebounded above their 50-day moving average (DMA) lines following recent damaging losses on much heavy volume. The weak market (M criteria) action was labeled a "correction" in prior commentaries. With that in mind, investors would be wise to watch for further improvements and wait for a considerable follow-through day from at least one of the major averages as a reassurance that a new confirmed uptrend has begun. On the Featured Stocks Page a few noteworthy candidates remain, however in recent weeks few have made meaningful headway. The major averages advanced with international shares as investors digested easing “Brexit” concerns. European stocks edged higher in late trading as Bank of England Governor Mark Carney provided mostly dovish commentary on the U.K. referendum. On the data front, initial jobless claims came in at 268,000, slightly above the expected 267,000. In M&A news, Hershey (HSY +16.83%) rose after rejecting a $23 billion takeover offer from Mondelez International. All 10 sectors of the S&P 500 finished higher with Financials advancing after 31 of 33 banks passed the Fed’s CCAR stress test. Morgan Stanley (MS +2.97%) rose with positive CCAR results. Deutsche Bank (DB -2.56%) fell after failing the stress test and receiving negative commentary from the International Monetary Fund. In earnings, Constellation Brands (STZ +3.77%) after reporting a 15% jump in quarterly net sales. Tractor Supply (TSC -4.19%) with news the company released a negative pre-announcement. Treasuries finished higher with the benchmark 10-year note up 11/32 to yield 1.47%. In commodities, NYMEX WTI crude retreated 2.8% to $48.48/barrel. COMEX gold slipped 0.2% to $1324.00/ounce. In FOREX, the dollar gained 1% against the British pound. |
 Kenneth J. Gruneisen started out as a licensed stockbroker in August 1987, a couple of months prior to the historic stock market crash that took the Dow Jones Industrial Average down -22.6% in a single day. He has published daily fact-based fundamental and technical analysis on high-ranked stocks online for two decades. Through FACTBASEDINVESTING.COM, Kenneth provides educational articles, news, market commentary, and other information regarding proven investment systems that work in good times and bad.
Comments contained in the body of this report are technical opinions only and are not necessarily those of Gruneisen Growth Corp. The material herein has been obtained from sources believed to be reliable and accurate, however, its accuracy and completeness cannot be guaranteed. Our firm, employees, and customers may effect transactions, including transactions contrary to any recommendation herein, or have positions in the securities mentioned herein or options with respect thereto. Any recommendation contained in this report may not be suitable for all investors and it is not to be deemed an offer or solicitation on our part with respect to the purchase or sale of any securities. |
|
 |
Financial, Tech, Energy and Retail Indexes Rebounded Further
Kenneth J. Gruneisen - Passed the CAN SLIM® Master's Exam
The Broker/Dealer Index ($XBD +1.29%) and the Bank Index ($BKX +1.84%) both posted gains which helped underpin the major averages' further rebound on Thursday. The Retail Index ($RLX +0.39%) edged higher. The Biotechnology Index ($BTK +0.71%), Networking Index ($NWX +1.97%) and Semiconductor Index ($SOX +1.81%) posted unanimous gains. Commodity-linked shares also had a positive bias as the Oil Services Index ($OSX +1.37%) and the Integrated Oil Index ($XOI +0.75%) both rose along with the Gold & Silver Index ($XAU +1.92%). Charts courtesy www.stockcharts.com

PICTURED: The Retail Index ($RLX +0.39%) found prompt support after undercutting its 200-day moving average (DMA) line and rebounded above its 50 DMA line. After the ugliest start to a new year in market history, the healthy recovery from the RLX's February lows has been a reassuring sign. Healthy action from the retail index is important, since consumer spending accounts for nearly 2/3 of the US economy.
| Oil Services |
$OSX |
168.32 |
+2.27 |
+1.37% |
+6.71% |
| Integrated Oil |
$XOI |
1,145.44 |
+8.49 |
+0.75% |
+6.78% |
| Semiconductor |
$SOX |
691.67 |
+12.30 |
+1.81% |
+4.25% |
| Networking |
$NWX |
361.90 |
+7.01 |
+1.97% |
-3.73% |
| Broker/Dealer |
$XBD |
150.42 |
+1.91 |
+1.29% |
-15.54% |
| Retail |
$RLX |
1,285.35 |
+5.05 |
+0.39% |
+0.15% |
| Gold & Silver |
$XAU |
97.64 |
+1.84 |
+1.92% |
+115.54% |
| Bank |
$BKX |
64.86 |
+1.17 |
+1.84% |
-11.25% |
| Biotech |
$BTK |
3,024.63 |
+21.19 |
+0.71% |
-20.70% |
|
|
|
 |
Perched Near Highs After Rebound Above 50-Day Average
Kenneth J. Gruneisen - Passed the CAN SLIM® Master's Exam
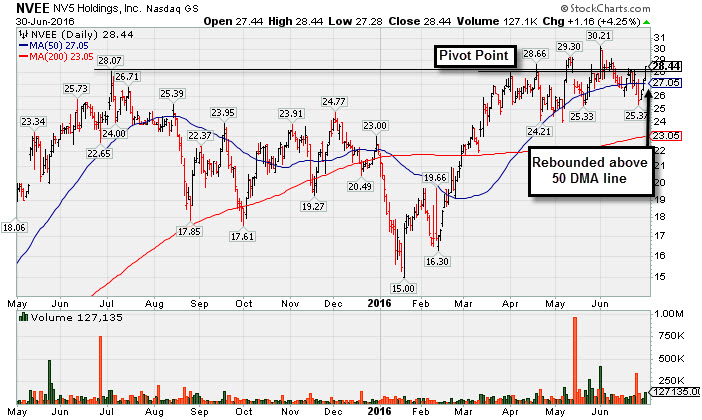
N V 5 Global Inc (NVEE +$1.16 or +4.25% to $28.44) has rebounded above its 50-day moving average (DMA) line and now faces little resistance due to overhead supply. On any pullbacks the recent lows in the $24 area define the important support to watch.
NVEE was last shown in this FSU section on 5/31/16 with an annotated graph under the headline, "Consolidating Near Highs After Completing New Public Offering". It completed a new Public Offering on 5/13/16. Members were cautioned - "Such offerings often hinder near-term price progress yet help companies to attract more institutional owners (I criteria). Remember that any stock that was previously sold can be bought again when strength returns."
The high-ranked Commercial Services - Consulting firm reported earnings +39% on +54% sales revenues for the Mar '16 quarter, continuing its strong earnings track record. It reported earnings +32% on +47% sales revenues for the Dec '15 quarter and prior quarterly earnings comparisons have been mostly above the +25% minimum guideline (C criteria). Its strong annual earnings (A criteria) history helps it match the fundamental guidelines of the fact-based investment system. The number of top-rated funds owning its shares rose from 13 in Mar '15 to to 124 in Mar '16, a reassuring sign concerning the I criteria. It completed a new Public Offering on 5/22/15.
It was first highlighted with a pivot point based on its 12/02/15 high in the 3/14/16 mid-day report (read here) and then finished strong and triggered a technical buy signal while rising from an 8-month double bottom base with +142% above average volume. |
|
|
Color Codes Explained :
Y - Better candidates highlighted by our
staff of experts.
G - Previously featured
in past reports as yellow but may no longer be buyable under the
guidelines.
***Last / Change / Volume data in this table is the closing quote data***
Symbol/Exchange
Company Name
Industry Group |
PRICE |
CHANGE
(%Change) |
Day High |
Volume
(% DAV)
(% 50 day avg vol) |
52 Wk Hi
% From Hi |
Featured
Date |
Price
Featured |
Pivot Featured |
|
Max Buy |
TDG
-
NYSE
Transdigm Group Inc
AEROSPACE/DEFENSE - Aerospace/Defense Products and; Services
|
$263.69
|
+2.79
1.07% |
$263.89
|
550,032
63.29% of 50 DAV
50 DAV is 869,000
|
$268.00
-1.61%
|
5/11/2016
|
$248.33
|
PP = $245.00
|
|
MB = $257.25
|
 Most Recent Note - 6/30/2016 5:42:58 PM
G - Color code is changed to green rebounding above its "max buy" level. Recent lows and its 50 DMA line ($249.73) define near-term support to watch on pullbacks.
>>> FEATURED STOCK ARTICLE : Getting Extended From Prior Base After More Volume-Driven Gains - 6/1/2016 |
View all notes |
Set NEW NOTE alert |
Company Profile |
SEC
News |
Chart |
Request a new note
C
A
S
I |
NTES
-
NASDAQ
Netease Inc Adr
INTERNET - Internet Information Providers
|
$193.22
|
+11.74
6.47% |
$193.27
|
2,492,212
188.09% of 50 DAV
50 DAV is 1,325,000
|
$186.45
3.63%
|
6/29/2016
|
$182.42
|
PP = $186.55
|
|
MB = $195.88
|
Most Recent Note - 6/30/2016 12:18:38 PM
Y - Hitting a new 52-week high with today's gap up and volume-driven gain. Previously noted - "Gains into new high territory backed by heavy volume are still needed to trigger a convincing technical buy signal. It was highlighted in yellow with pivot point cited based on its 12/29/15 high plus 10 cents in the earlier mid-day report. Reported earnings +79% on +108% sales revenues for the Mar '16 quarter, marking its 3rd consecutive quarter with earnings above the +25% minimum guideline (C criteria). See the latest FSU analysis for more details and a new annotated graph."
>>> FEATURED STOCK ARTICLE : Rallying Within Striking Distance of Highs - 6/29/2016 |
View all notes |
Set NEW NOTE alert |
Company Profile |
SEC
News |
Chart |
Request a new note
C
A
S
I |
MXL
-
NYSE
Maxlinear Inc Cl A
Telecom-Infrastructure
|
$17.98
|
+0.56
3.21% |
$17.99
|
886,863
76.32% of 50 DAV
50 DAV is 1,162,000
|
$20.98
-14.29%
|
5/16/2016
|
$19.24
|
PP = $19.20
|
|
MB = $20.16
|
Most Recent Note - 6/30/2016 5:33:54 PM
G - Remains below its 50 DMA line following a gain today on lighter volume after big volume-driven losses. The 200 DMA line and prior lows in the $15-16 area define the next important support area.
>>> FEATURED STOCK ARTICLE : Extended From Latest Base After Recently Wedging Higher - 6/2/2016 |
View all notes |
Set NEW NOTE alert |
Company Profile |
SEC
News |
Chart |
Request a new note
C
A
S
I |
PATK
-
NASDAQ
Patrick Industries Inc
WHOLESALE - Building Materials Wholesale
|
$60.29
|
+1.77
3.02% |
$60.31
|
220,044
151.75% of 50 DAV
50 DAV is 145,000
|
$59.32
1.64%
|
5/24/2016
|
$53.45
|
PP = $50.68
|
|
MB = $53.21
|
Most Recent Note - 6/30/2016 5:36:53 PM
G - Finished near the session high with additional volume-driven gains for another new 52-week high, getting more extended from any sound base. Its 50 DMA line ($51.33) defines near-term support to watch on pullbacks.
>>> FEATURED STOCK ARTICLE : Extended From Base After Another Volume-Driven Gain - 6/16/2016 |
View all notes |
Set NEW NOTE alert |
Company Profile |
SEC
News |
Chart |
Request a new note
C
A
S
I |
FBHS
-
NYSE
Fortune Brands Hme & Sec
Bldg-Constr Prds/Misc
|
$57.97
|
+1.26
2.22% |
$58.00
|
1,296,078
73.59% of 50 DAV
50 DAV is 1,761,200
|
$59.98
-3.35%
|
6/22/2016
|
$57.71
|
PP = $60.08
|
|
MB = $63.08
|
Most Recent Note - 6/30/2016 5:44:58 PM
Y - Rebounded above the 50 DMA line ($57.06) helping its outlook to improve and its color code is changed to yellow. After highlighted in yellow with pivot point based on its 4/21/16 high plus 10 cents members were reminded - "It needs subsequent volume-driven gains above the pivot point to trigger a technical buy signal."
>>> FEATURED STOCK ARTICLE : Wait Continues for Technical Breakout - 6/22/2016 |
View all notes |
Set NEW NOTE alert |
Company Profile |
SEC
News |
Chart |
Request a new note
C
A
S
I |
Symbol/Exchange
Company Name
Industry Group |
PRICE |
CHANGE
(%Change) |
Day High |
Volume
(% DAV)
(% 50 day avg vol) |
52 Wk Hi
% From Hi |
Featured
Date |
Price
Featured |
Pivot Featured |
|
Max Buy |
NVEE
-
NASDAQ
N V 5 Global Inc
Comml Svcs-Consulting
|
$28.44
|
+1.16
4.25% |
$28.44
|
127,010
105.84% of 50 DAV
50 DAV is 120,000
|
$30.21
-5.86%
|
4/19/2016
|
$28.20
|
PP = $28.10
|
|
MB = $29.51
|
Most Recent Note - 6/30/2016 12:20:22 PM
Y - Rebounding above its 50 DMA line and it faces little resistance due to overhead supply. Recent lows in the $24 area define the next important support to watch.
>>> FEATURED STOCK ARTICLE : Perched Near Highs After Rebound Above 50-Day Average - 6/30/2016 |
View all notes |
Set NEW NOTE alert |
Company Profile |
SEC
News |
Chart |
Request a new note
C
A
S
I |
|
|
|
THESE ARE NOT BUY RECOMMENDATIONS!
Comments contained in the body of this report are technical
opinions only. The material herein has been obtained
from sources believed to be reliable and accurate, however,
its accuracy and completeness cannot be guaranteed.
This site is not an investment advisor, hence it does
not endorse or recommend any securities or other investments.
Any recommendation contained in this report may not
be suitable for all investors and it is not to be deemed
an offer or solicitation on our part with respect to
the purchase or sale of any securities. All trademarks,
service marks and trade names appearing in this report
are the property of their respective owners, and are
likewise used for identification purposes only.
This report is a service available
only to active Paid Premium Members.
You may opt-out of receiving report notifications
at any time. Questions or comments may be submitted
by writing to Premium Membership Services 665 S.E. 10 Street, Suite 201 Deerfield Beach, FL 33441-5634 or by calling 1-800-965-8307
or 954-785-1121.
|
|
|