You are not logged in.
This means you
CAN ONLY VIEW reports that were published prior to Sunday, February 16, 2025.
You
MUST UPGRADE YOUR MEMBERSHIP if you want to see any current reports.
AFTER MARKET UPDATE - TUESDAY, JUNE 28TH, 2016
Previous After Market Report Next After Market Report >>>
|
|
|
|
DOW |
+269.48 |
17,409.72 |
+1.57% |
|
Volume |
1,050,977,490 |
-17% |
|
Volume |
1,873,718,450 |
-23% |
|
NASDAQ |
+97.43 |
4,691.87 |
+2.12% |
|
Advancers |
2,655 |
86% |
|
Advancers |
2,581 |
81% |
|
S&P 500 |
+35.55 |
2,036.09 |
+1.78% |
|
Decliners |
447 |
14% |
|
Decliners |
587 |
19% |
|
Russell 2000 |
+17.65 |
1,107.30 |
+1.62% |
|
52 Wk Highs |
171 |
|
|
52 Wk Highs |
42 |
|
|
S&P 600 |
+8.94 |
679.84 |
+1.33% |
|
52 Wk Lows |
29 |
|
|
52 Wk Lows |
57 |
|
|
 |
Indices Posted Solid Gains With Less Volume
Kenneth J. Gruneisen - Passed the CAN SLIM® Master's Exam
Stocks finished firmly higher on Tuesday. The Dow was up 269 points to 17409. The S&P 500 added 35 points to 2036 and the Nasdaq Composite gained 97 points to 4,691. Volume totals were lighter on the NYSE and on the Nasdaq exchange, revealing a lack of serious institutional buying demand as the indices rebounded from a high-volume downdraft. Advancers led decliners by nearly a 6-1 margin on the NYSE and more than 4-1 on the Nasdaq exchange. There were 28 high-ranked companies from the Leaders List that made new 52-week highs and were listed on the BreakOuts Page, versus the total of 19 on the prior session. New 52-week highs outnumbered new 52-week lows on the NYSE but new lows outnumbered new highs on the Nasdaq exchange. PICTURED: The Dow Jones Industrial Average rebounded above its 200-day moving average (DMA) lines with a gain on lighter volume following big losses on heavy volume.
The S&P 500 Index, Dow Jones Industrial Average and Nasdaq Composite Index have unanimously violated their 50-day and 200-day moving average (DMA) lines with large losses. The technical damage signals that the prior market (M criteria) uptrend has ended and the market is in a correction. On the Featured Stocks Page a few noteworthy candidates remain, however in recent weeks few have made meaningful headway. The major averages snapped a two-day losing streak as crude rallied and European markets rebounded after a “Brexit” sell-off. The broad Euro STOXX 600 climbed 2.5% as gains in the Telecom sector boosted the index. Investors now await word on the two-day meeting between European Union leaders to discuss the U.K.’s decision to leave the trade group. On the data front, first-quarter GDP was revised up to 1.1%, from 0.8% reported previously. In a separate release, consumer sentiment rose to 98.0 in June, the highest reading since October. All 10 sectors in the S&P 500 finished higher as Energy shares and Financials paced the gains. Carnival (CCL +0.21%) inched higher after beating expectations on the top and bottom line. Nike (NKE +2.31%) rose ahead of its scheduled release after the closing bell. Lending Club (LC +7.21%) rallied with news the company announced a new CEO. DuPont (DD -2.08%) was a notable decliner. Treasuries declined with the benchmark 10-year note down 6/32 to yield 1.46%. In commodities, NYMEX WTI crude jumped 3.4% to $47.88/barrel. COMEX gold was off 0.5% to $1315.30/ounce. In FOREX, the British pound gained against the dollar. |
 Kenneth J. Gruneisen started out as a licensed stockbroker in August 1987, a couple of months prior to the historic stock market crash that took the Dow Jones Industrial Average down -22.6% in a single day. He has published daily fact-based fundamental and technical analysis on high-ranked stocks online for two decades. Through FACTBASEDINVESTING.COM, Kenneth provides educational articles, news, market commentary, and other information regarding proven investment systems that work in good times and bad.
Comments contained in the body of this report are technical opinions only and are not necessarily those of Gruneisen Growth Corp. The material herein has been obtained from sources believed to be reliable and accurate, however, its accuracy and completeness cannot be guaranteed. Our firm, employees, and customers may effect transactions, including transactions contrary to any recommendation herein, or have positions in the securities mentioned herein or options with respect thereto. Any recommendation contained in this report may not be suitable for all investors and it is not to be deemed an offer or solicitation on our part with respect to the purchase or sale of any securities. |
|
 |
Financial, Tech, Retail and Energy Indexes Rebounded
Kenneth J. Gruneisen - Passed the CAN SLIM® Master's Exam
The Broker/Dealer Index ($XBD +1.73%) and the Bank Index ($BKX +3.09%) both posted gains which helped underpin the major averages on Tuesday. The Retail Index ($RLX +1.94%) rose. The Biotechnology Index ($BTK +4.42%), Networking Index ($NWX +1.72%) and Semiconductor Index ($SOX +2.69%) posted unanimous gains. Energy-related shares also had a positive bias as the Oil Services Index ($OSX +2.19%) and the Integrated Oil Index ($XOI +2.98%) both rose. The Gold & Silver Index ($XAU -0.84%) ended lower. Charts courtesy www.stockcharts.com
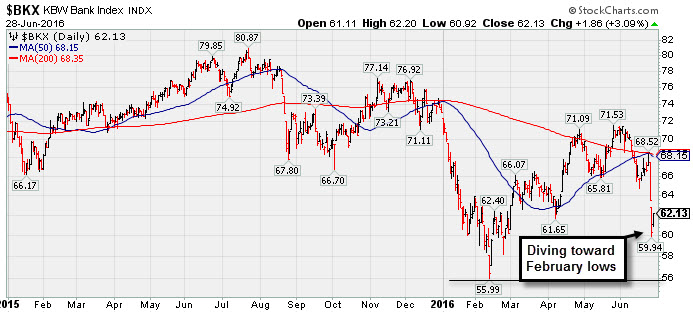
PICTURED: The Bank Index ($BKX +3.09%) abruptly dove toward its February lows yet halted its slide on Tuesday's session. A rebound above its 50-day and 200-day moving average (DMA) lines its needed for its near-term outlook to improve. Meanwhile, a violation of the February lows would bode poorly for the broader market outlook since Financials have a reliable role as "leading indicators".
| Oil Services |
$OSX |
161.69 |
+3.47 |
+2.19% |
+2.51% |
| Integrated Oil |
$XOI |
1,108.06 |
+32.09 |
+2.98% |
+3.30% |
| Semiconductor |
$SOX |
665.75 |
+17.43 |
+2.69% |
+0.34% |
| Networking |
$NWX |
346.91 |
+5.86 |
+1.72% |
-7.72% |
| Broker/Dealer |
$XBD |
145.06 |
+2.47 |
+1.73% |
-18.54% |
| Retail |
$RLX |
1,264.80 |
+24.12 |
+1.94% |
-1.45% |
| Gold & Silver |
$XAU |
93.27 |
-0.79 |
-0.84% |
+105.89% |
| Bank |
$BKX |
62.13 |
+1.86 |
+3.09% |
-14.98% |
| Biotech |
$BTK |
2,943.42 |
+124.72 |
+4.42% |
-22.83% |
|
|
|
 |
Seriously Applying the Fact-Based System Now
Kenneth J. Gruneisen - Passed the CAN SLIM® Master's Exam
Asset Management Services Using the Winning Fact-Based Investment System - Inquire Now! You can have professional help in limiting your losses and maximizing your gains in all market environments. For help with how your portfolio is managed in 2016 and beyond click here and indicate "Find a Broker". *Accounts over $250,000 please. **Serious inquires only, please. |
|
|
Color Codes Explained :
Y - Better candidates highlighted by our
staff of experts.
G - Previously featured
in past reports as yellow but may no longer be buyable under the
guidelines.
***Last / Change / Volume data in this table is the closing quote data***
Symbol/Exchange
Company Name
Industry Group |
PRICE |
CHANGE
(%Change) |
Day High |
Volume
(% DAV)
(% 50 day avg vol) |
52 Wk Hi
% From Hi |
Featured
Date |
Price
Featured |
Pivot Featured |
|
Max Buy |
TDG
-
NYSE
Transdigm Group Inc
AEROSPACE/DEFENSE - Aerospace/Defense Products and; Services
|
$257.13
|
+5.27
2.09% |
$257.52
|
429,613
49.15% of 50 DAV
50 DAV is 874,000
|
$268.00
-4.06%
|
5/11/2016
|
$248.33
|
PP = $245.00
|
|
MB = $257.25
|
Most Recent Note - 6/27/2016 5:21:12 PM
Y - Color code is changed to yellow after retreating below its "max buy" level with a loss on light volume. Slumped toward its 50 DMA line ($247.73) defining near-term support above prior highs ($244). More damaging losses would raise concerns.
>>> FEATURED STOCK ARTICLE : Getting Extended From Prior Base After More Volume-Driven Gains - 6/1/2016 |
View all notes |
Set NEW NOTE alert |
Company Profile |
SEC
News |
Chart |
Request a new note
C
A
S
I |
MXL
-
NYSE
Maxlinear Inc Cl A
Telecom-Infrastructure
|
$17.51
|
+0.48
2.82% |
$17.94
|
1,807,787
145.55% of 50 DAV
50 DAV is 1,242,000
|
$20.98
-16.53%
|
5/16/2016
|
$19.24
|
PP = $19.20
|
|
MB = $20.16
|
Most Recent Note - 6/27/2016 5:17:22 PM
G - Sank further below its 50 DMA line with another big volume-driven loss. The 200 DMA line and prior lows in the $15-16 area define the next important support area.
>>> FEATURED STOCK ARTICLE : Extended From Latest Base After Recently Wedging Higher - 6/2/2016 |
View all notes |
Set NEW NOTE alert |
Company Profile |
SEC
News |
Chart |
Request a new note
C
A
S
I |
PATK
-
NASDAQ
Patrick Industries Inc
WHOLESALE - Building Materials Wholesale
|
$57.63
|
+1.24
2.20% |
$58.82
|
223,302
158.37% of 50 DAV
50 DAV is 141,000
|
$58.31
-1.17%
|
5/24/2016
|
$53.45
|
PP = $50.68
|
|
MB = $53.21
|
 Most Recent Note - 6/28/2016 12:40:28 PM
G - Endured recent distributional pressure yet hit another new high today, getting more extended from any sound base. Prior highs define near term support in the $50 area along with its 50 DMA line ($50.86).
>>> FEATURED STOCK ARTICLE : Extended From Base After Another Volume-Driven Gain - 6/16/2016 |
View all notes |
Set NEW NOTE alert |
Company Profile |
SEC
News |
Chart |
Request a new note
C
A
S
I |
FBHS
-
NYSE
Fortune Brands Hme & Sec
Bldg-Constr Prds/Misc
|
$56.15
|
+1.04
1.89% |
$56.31
|
1,863,270
106.66% of 50 DAV
50 DAV is 1,746,900
|
$59.98
-6.39%
|
6/22/2016
|
$57.71
|
PP = $60.08
|
|
MB = $63.08
|
Most Recent Note - 6/28/2016 5:44:55 PM
G - Posted a gain with average volume today following consecutive volume-driven losses violating its 50 DMA line which is now downward sloping. A rebound above the 50 DMA line ($57.06) is needed for its outlook to improve. After highlighted in yellow with pivot point based on its 4/21/16 high plus 10 cents members were reminded - "It needs subsequent volume-driven gains above the pivot point to trigger a technical buy signal."
>>> FEATURED STOCK ARTICLE : Wait Continues for Technical Breakout - 6/22/2016 |
View all notes |
Set NEW NOTE alert |
Company Profile |
SEC
News |
Chart |
Request a new note
C
A
S
I |
NVEE
-
NASDAQ
N V 5 Global Inc
Comml Svcs-Consulting
|
$26.18
|
+0.51
1.99% |
$26.51
|
45,222
37.07% of 50 DAV
50 DAV is 122,000
|
$30.21
-13.34%
|
4/19/2016
|
$28.20
|
PP = $28.10
|
|
MB = $29.51
|
Most Recent Note - 6/27/2016 5:15:21 PM
G - Slumped below its 50 DMA line raising concerns. Recent lows in the $24 area define the next important support to watch.
>>> FEATURED STOCK ARTICLE : Consolidating Near Highs After Completing New Public Offering - 5/31/2016 |
View all notes |
Set NEW NOTE alert |
Company Profile |
SEC
News |
Chart |
Request a new note
C
A
S
I |
Symbol/Exchange
Company Name
Industry Group |
PRICE |
CHANGE
(%Change) |
Day High |
Volume
(% DAV)
(% 50 day avg vol) |
52 Wk Hi
% From Hi |
Featured
Date |
Price
Featured |
Pivot Featured |
|
Max Buy |
|
|
|
THESE ARE NOT BUY RECOMMENDATIONS!
Comments contained in the body of this report are technical
opinions only. The material herein has been obtained
from sources believed to be reliable and accurate, however,
its accuracy and completeness cannot be guaranteed.
This site is not an investment advisor, hence it does
not endorse or recommend any securities or other investments.
Any recommendation contained in this report may not
be suitable for all investors and it is not to be deemed
an offer or solicitation on our part with respect to
the purchase or sale of any securities. All trademarks,
service marks and trade names appearing in this report
are the property of their respective owners, and are
likewise used for identification purposes only.
This report is a service available
only to active Paid Premium Members.
You may opt-out of receiving report notifications
at any time. Questions or comments may be submitted
by writing to Premium Membership Services 665 S.E. 10 Street, Suite 201 Deerfield Beach, FL 33441-5634 or by calling 1-800-965-8307
or 954-785-1121.
|
|
|


