You are not logged in.
This means you
CAN ONLY VIEW reports that were published prior to Thursday, April 10, 2025.
You
MUST UPGRADE YOUR MEMBERSHIP if you want to see any current reports.
AFTER MARKET UPDATE - FRIDAY, JUNE 24TH, 2016
Previous After Market Report Next After Market Report >>>
|
|
|
|
DOW |
-610.32 |
17,400.75 |
-3.39% |
|
Volume |
2,463,095,950 |
+197% |
|
Volume |
3,498,120,000 |
+120% |
|
NASDAQ |
-202.06 |
4,707.98 |
-4.12% |
|
Advancers |
479 |
15% |
|
Advancers |
472 |
13% |
|
S&P 500 |
-76.02 |
2,037.30 |
-3.60% |
|
Decliners |
2,617 |
85% |
|
Decliners |
3,078 |
87% |
|
Russell 2000 |
-44.68 |
1,127.54 |
-3.81% |
|
52 Wk Highs |
171 |
|
|
52 Wk Highs |
66 |
|
|
S&P 600 |
-27.18 |
692.01 |
-3.78% |
|
52 Wk Lows |
53 |
|
|
52 Wk Lows |
126 |
|
|
 |
Market Falls After UK Votes to Leave European Union
Kenneth J. Gruneisen - Passed the CAN SLIM® Master's Exam
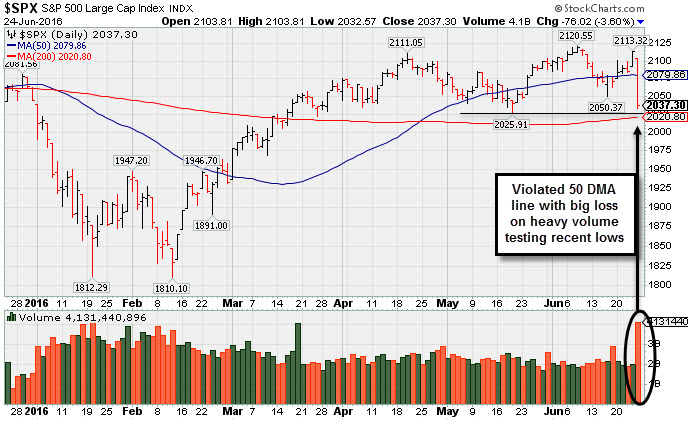
For the week, the Dow and S&P 500 lost 1.6% and the Nasdaq declined 1.9%. Stocks sold-off by the most since January on Friday. The Dow was down 611 points to 17399. The S&P 500 tumbled 76 points to 2037 and the Nasdaq Composite dropped 202 points to 4707. The volume totals were much higher on the NYSE and on the Nasdaq exchange amid international volatility and the annual Russell rebalance. Decliners led advancers by a 5-1 margin on the NYSE and 6-1 on the Nasdaq exchange. Leadership contracted as there were 22 high-ranked companies from the Leaders List that made new 52-week highs and were listed on the BreakOuts Page, versus the total of 56 on the prior session. New 52-highs outnumbered new 52-week lows on the NYSE but new lows outnumbered new highs on the Nasdaq exchange. PICTURED: The S&P 500 Index violated its 50-day moving average line with Friday's big loss on heavy volume nearly testing recent lows.
The S&P 500 Index, Dow Jones Industrial Average and Nasdaq Composite Index all violated their 50-day moving average (DMA) lines with large losses, raising concerns as the market's uptrend (M criteria) clearly encountered heavy pressure. When leadership recently improved some new stocks were added to the Featured Stocks Page as noteworthy buy candidates, however few have made meaningful headway. The major averages retreated along with risk assets around the global while perceived “safe havens” from Treasuries to gold advanced after the U.K. voted to leave the European Union. Overseas, the Stoxx Europe 600 declined 8.6% for its worst session since the financial crises. The U.K.’s FTSE actually outperformed its continental peers, sliding only 2.8%. Nine of 10 sectors in the S&P 500 finished the session in negative territory. Financials were the worst performing group, shedding more than 5%. Citigroup (C -9.4%) and Morgan Stanley (MS -10.2%) both tumbled. Industrials and Technology also paced the market’s descent while Utilities outperformed. Treasuries rallied as investors sought perceived safety in U.S. government debt. The 10-year surged a point and 18/32 to yield 1.57%. In commodities, NYMEX WTI crude tumbled 4.8% to $47.69/barrel. COMEX gold jumped 4.7% to $1320.00/ounce. In FOREX, the British pound slid 8.2% for its worst performance against the dollar on record while the yen strengthened 3.6%. Overall, the U.S. Dollar Index added 2%. |
 Kenneth J. Gruneisen started out as a licensed stockbroker in August 1987, a couple of months prior to the historic stock market crash that took the Dow Jones Industrial Average down -22.6% in a single day. He has published daily fact-based fundamental and technical analysis on high-ranked stocks online for two decades. Through FACTBASEDINVESTING.COM, Kenneth provides educational articles, news, market commentary, and other information regarding proven investment systems that work in good times and bad.
Comments contained in the body of this report are technical opinions only and are not necessarily those of Gruneisen Growth Corp. The material herein has been obtained from sources believed to be reliable and accurate, however, its accuracy and completeness cannot be guaranteed. Our firm, employees, and customers may effect transactions, including transactions contrary to any recommendation herein, or have positions in the securities mentioned herein or options with respect thereto. Any recommendation contained in this report may not be suitable for all investors and it is not to be deemed an offer or solicitation on our part with respect to the purchase or sale of any securities. |
|
 |
Financial, Tech, Energy and Retail Indexes Suffered Large Losses
Kenneth J. Gruneisen - Passed the CAN SLIM® Master's Exam
The Broker/Dealer Index ($XBD -7.89%) and the Bank Index ($BKX -7.30%) both weighed heavily on the major averages on Friday. The Retail Index ($RLX -2.82%) fell. The Biotechnology Index ($BTK -5.07%), Networking Index ($NWX -5.63%) and Semiconductor Index ($SOX -5.76%) posted unanimous losses of greater than -5%. Energy-related shares also had a negative bias as the Oil Services Index ($OSX -5.06%) and the Integrated Oil Index ($XOI -4.58%) both sank. The Gold & Silver Index ($XAU +3.62%) clearly was a standout gainer. Charts courtesy www.stockcharts.com
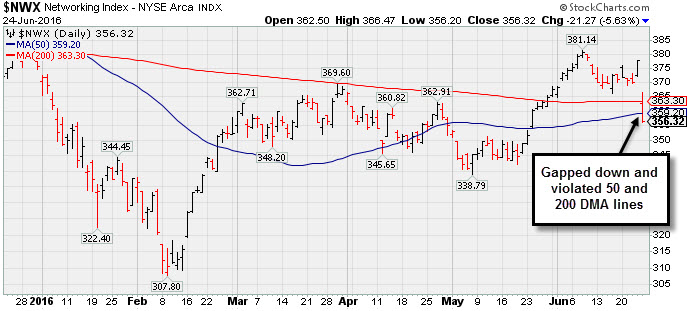
PICTURED: The Networking Index ($NWX -5.63%) gapped down and violated its 50-day and 200-day moving average (DMA) lines amid widespread market weakness.
| Oil Services |
$OSX |
166.97 |
-8.90 |
-5.06% |
+5.86% |
| Integrated Oil |
$XOI |
1,109.46 |
-53.20 |
-4.58% |
+3.43% |
| Semiconductor |
$SOX |
675.40 |
-41.27 |
-5.76% |
+1.80% |
| Networking |
$NWX |
356.32 |
-21.27 |
-5.63% |
-5.22% |
| Broker/Dealer |
$XBD |
149.56 |
-12.81 |
-7.89% |
-16.02% |
| Retail |
$RLX |
1,257.86 |
-36.51 |
-2.82% |
-2.00% |
| Gold & Silver |
$XAU |
93.70 |
+3.27 |
+3.62% |
+106.84% |
| Bank |
$BKX |
63.51 |
-5.00 |
-7.30% |
-13.10% |
| Biotech |
$BTK |
2,932.96 |
-156.53 |
-5.07% |
-23.10% |
|
|
|
 |
Seriously Applying the Fact-Based System Now
Kenneth J. Gruneisen - Passed the CAN SLIM® Master's Exam
Asset Management Services Using the Winning Fact-Based Investment System - Inquire Now! You can have professional help in limiting your losses and maximizing your gains in all market environments. For help with how your portfolio is managed in 2016 and beyond click here and indicate "Find a Broker". *Accounts over $250,000 please. **Serious inquires only, please. |
|
|
Color Codes Explained :
Y - Better candidates highlighted by our
staff of experts.
G - Previously featured
in past reports as yellow but may no longer be buyable under the
guidelines.
***Last / Change / Volume data in this table is the closing quote data***
Symbol/Exchange
Company Name
Industry Group |
PRICE |
CHANGE
(%Change) |
Day High |
Volume
(% DAV)
(% 50 day avg vol) |
52 Wk Hi
% From Hi |
Featured
Date |
Price
Featured |
Pivot Featured |
|
Max Buy |
TDG
-
NYSE
Transdigm Group Inc
AEROSPACE/DEFENSE - Aerospace/Defense Products and; Services
|
$257.65
|
-7.70
-2.90% |
$264.26
|
944,392
110.58% of 50 DAV
50 DAV is 854,000
|
$268.00
-3.86%
|
5/11/2016
|
$248.33
|
PP = $245.00
|
|
MB = $257.25
|
 Most Recent Note - 6/24/2016 6:05:41 PM
G - Slumped today with higher (near average) volume and ended near its "max buy" level and recent lows. Prior highs and its 50 DMA line define near-term support in the $242-244 area.
>>> FEATURED STOCK ARTICLE : Getting Extended From Prior Base After More Volume-Driven Gains - 6/1/2016 |
View all notes |
Set NEW NOTE alert |
Company Profile |
SEC
News |
Chart |
Request a new note
C
A
S
I |
MXL
-
NYSE
Maxlinear Inc Cl A
Telecom-Infrastructure
|
$18.09
|
-1.31
-6.75% |
$18.77
|
1,934,469
159.48% of 50 DAV
50 DAV is 1,213,000
|
$20.98
-13.77%
|
5/16/2016
|
$19.24
|
PP = $19.20
|
|
MB = $20.16
|
Most Recent Note - 6/24/2016 2:28:09 PM
G - Gapped down today violating its 50 DMA line ($18.71) raising concerns and triggering a technical sell signal. Color code is change to green. Only a prompt rebound above the 50 DMA line would help its outlook improve.
>>> FEATURED STOCK ARTICLE : Extended From Latest Base After Recently Wedging Higher - 6/2/2016 |
View all notes |
Set NEW NOTE alert |
Company Profile |
SEC
News |
Chart |
Request a new note
C
A
S
I |
PATK
-
NASDAQ
Patrick Industries Inc
WHOLESALE - Building Materials Wholesale
|
$56.56
|
-1.56
-2.68% |
$57.02
|
392,450
295.08% of 50 DAV
50 DAV is 133,000
|
$58.31
-3.00%
|
5/24/2016
|
$53.45
|
PP = $50.68
|
|
MB = $53.21
|
Most Recent Note - 6/24/2016 6:11:24 PM
G - Endured distributional pressure today. After getting extended from any sound base, prior highs define near term support in the $50 area along with its 50 DMA line ($50.47).
>>> FEATURED STOCK ARTICLE : Extended From Base After Another Volume-Driven Gain - 6/16/2016 |
View all notes |
Set NEW NOTE alert |
Company Profile |
SEC
News |
Chart |
Request a new note
C
A
S
I |
FBHS
-
NYSE
Fortune Brands Hme & Sec
Bldg-Constr Prds/Misc
|
$55.74
|
-1.10
-1.94% |
$56.79
|
4,567,855
277.45% of 50 DAV
50 DAV is 1,646,400
|
$59.98
-7.07%
|
6/22/2016
|
$57.71
|
PP = $60.08
|
|
MB = $63.08
|
Most Recent Note - 6/24/2016 6:13:33 PM
G - Suffered a third consecutive volume-driven loss today. Color code is changed to green after slumping below its 50 DMA line and testing prior lows. After highlighted in yellow with pivot point based on its 4/21/16 high plus 10 cents members were reminded - "It needs subsequent volume-driven gains above the pivot point to trigger a technical buy signal. Strong earnings increases through the Mar '16 quarter helped it better match with the fact-based investment system's fundamental guidelines. See the latest FSU analysis for more details and a new annotated graph."
>>> FEATURED STOCK ARTICLE : Wait Continues for Technical Breakout - 6/22/2016 |
View all notes |
Set NEW NOTE alert |
Company Profile |
SEC
News |
Chart |
Request a new note
C
A
S
I |
NVEE
-
NASDAQ
N V 5 Global Inc
Comml Svcs-Consulting
|
$27.07
|
-0.72
-2.59% |
$27.09
|
329,905
289.39% of 50 DAV
50 DAV is 114,000
|
$30.21
-10.39%
|
4/19/2016
|
$28.20
|
PP = $28.10
|
|
MB = $29.51
|
Most Recent Note - 6/24/2016 6:09:31 PM
G - Sputtering near its 50 DMA line ($27.07). Recent lows define the next important support to watch.
>>> FEATURED STOCK ARTICLE : Consolidating Near Highs After Completing New Public Offering - 5/31/2016 |
View all notes |
Set NEW NOTE alert |
Company Profile |
SEC
News |
Chart |
Request a new note
C
A
S
I |
Symbol/Exchange
Company Name
Industry Group |
PRICE |
CHANGE
(%Change) |
Day High |
Volume
(% DAV)
(% 50 day avg vol) |
52 Wk Hi
% From Hi |
Featured
Date |
Price
Featured |
Pivot Featured |
|
Max Buy |
|
|
|
THESE ARE NOT BUY RECOMMENDATIONS!
Comments contained in the body of this report are technical
opinions only. The material herein has been obtained
from sources believed to be reliable and accurate, however,
its accuracy and completeness cannot be guaranteed.
This site is not an investment advisor, hence it does
not endorse or recommend any securities or other investments.
Any recommendation contained in this report may not
be suitable for all investors and it is not to be deemed
an offer or solicitation on our part with respect to
the purchase or sale of any securities. All trademarks,
service marks and trade names appearing in this report
are the property of their respective owners, and are
likewise used for identification purposes only.
This report is a service available
only to active Paid Premium Members.
You may opt-out of receiving report notifications
at any time. Questions or comments may be submitted
by writing to Premium Membership Services 665 S.E. 10 Street, Suite 201 Deerfield Beach, FL 33441-5634 or by calling 1-800-965-8307
or 954-785-1121.
|
|
|