You are not logged in.
This means you
CAN ONLY VIEW reports that were published prior to Sunday, April 20, 2025.
You
MUST UPGRADE YOUR MEMBERSHIP if you want to see any current reports.
AFTER MARKET UPDATE - TUESDAY, JUNE 14TH, 2022
Previous After Market Report Next After Market Report >>>
|
|
|
|
DOW |
-151.91 |
30,364.83 |
-0.50% |
|
Volume |
1,118,625,190 |
-9% |
|
Volume |
4,787,302,100 |
-19% |
|
NASDAQ |
+19.12 |
10,828.35 |
+0.18% |
|
Advancers |
1,177 |
37% |
|
Advancers |
1,907 |
43% |
|
S&P 500 |
-14.15 |
3,735.48 |
-0.38% |
|
Decliners |
1,980 |
63% |
|
Decliners |
2,547 |
57% |
|
Russell 2000 |
-6.77 |
1,707.83 |
-0.39% |
|
52 Wk Highs |
4 |
|
|
52 Wk Highs |
15 |
|
|
S&P 600 |
-3.06 |
1,133.48 |
-0.27% |
|
52 Wk Lows |
850 |
|
|
52 Wk Lows |
1,033 |
|
|
The market remains in a correction (M criteria). Discipline and patience remain paramount until a new rally with confirmation marked by a solid follow-through day.
|
 |
Major Indices Fell With Less Conviction
Kenneth J. Gruneisen - Passed the CAN SLIM® Master's Exam
The Dow shed 151 points, while the S&P 500 slid 0.4% a day after closing in bear market territory (defined as a 20% drawdown from a record) for the first time since 2020. The Nasdaq Composite added 0.2%, though remains 30.8% lower this year. Volume totals reported were lighter than the prior session on the NYSE and on the Nasdaq exchange. Breadth was negative as decliners led advancers by almost a 2-1 margin on the NYSE and by 5-4 on the Nasdaq exchange. There were 3 high-ranked companies from the Leaders List that hit new 52-week highs and were listed on the BreakOuts Page, up from the total of zero on the 2 prior sessions. New 52-week lows totals again solidly outnumbered new 52-week highs on the NYSE and on the Nasdaq exchange. The major indices have been in a noted market correction (M criteria).
Chart courtesy of www.stockcharts.com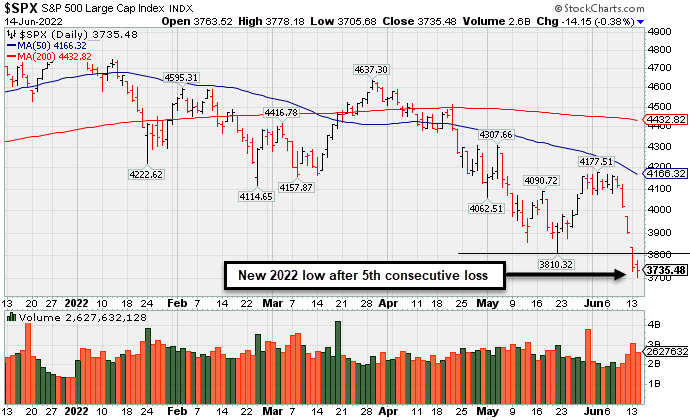 PICTURED: The Dow Jones Industrial Average slumped to a new 2022 low with its 4th consecutive loss backed by higher volume. With Monday's losses the May 20th lows were violated for all 3 major market averages.
U.S. stocks fluctuated on Tuesday as Wall Street monitored another backup in Treasury yields and awaited tomorrow’s Federal Reserve (Fed) policy decision. Sentiment remained fragile amid heightened worries that aggressive tightening by the Fed could push the U.S. economy into a recession. Bond markets began pricing in a 0.75% rate hike at the conclusion of the Federal Open Market Committee (FOMC) meeting as a hotter-than-anticipated inflation reading provided credence that Fed officials could deviate from their widely telegraphed 0.50% increase. Meanwhile, a rout in Treasuries deepened with the yield on the 10-year note gaining nine basis points (0.09%) to 3.47%, perched at its highest level since 2011 after capping a three-day jump of 0.42%. The two-year note yield rose to 3.42%, 0.60% higher from where it settled last Thursday.
Economic data continued to underscore persisting inflation pressures. The Producer Price Index (PPI) climbed 0.8% in May, in-line with expectations but doubling April’s 0.4% uptick. Year-over-year, PPI eased for a second month to 10.8% after hitting a record 11.5% annual gain in March.
Nine of 11 S&P 500 sectors finished in negative territory. Technology stocks bucked the downtrend, helped by a jump in Oracle Corp. (ORCL +10.41%) following upbeat quarterly results. FedEx Corp. (FDX +14.41%) provided another bright spot, with shares jumping after the company raised its quarterly dividend by 53%.
|
 Kenneth J. Gruneisen started out as a licensed stockbroker in August 1987, a couple of months prior to the historic stock market crash that took the Dow Jones Industrial Average down -22.6% in a single day. He has published daily fact-based fundamental and technical analysis on high-ranked stocks online for two decades. Through FACTBASEDINVESTING.COM, Kenneth provides educational articles, news, market commentary, and other information regarding proven investment systems that work in good times and bad.
Comments contained in the body of this report are technical opinions only and are not necessarily those of Gruneisen Growth Corp. The material herein has been obtained from sources believed to be reliable and accurate, however, its accuracy and completeness cannot be guaranteed. Our firm, employees, and customers may effect transactions, including transactions contrary to any recommendation herein, or have positions in the securities mentioned herein or options with respect thereto. Any recommendation contained in this report may not be suitable for all investors and it is not to be deemed an offer or solicitation on our part with respect to the purchase or sale of any securities. |
|
 |
Semiconductor, Broker/Dealer, and Integrated Oil Indexes Rose
Kenneth J. Gruneisen - Passed the CAN SLIM® Master's Exam
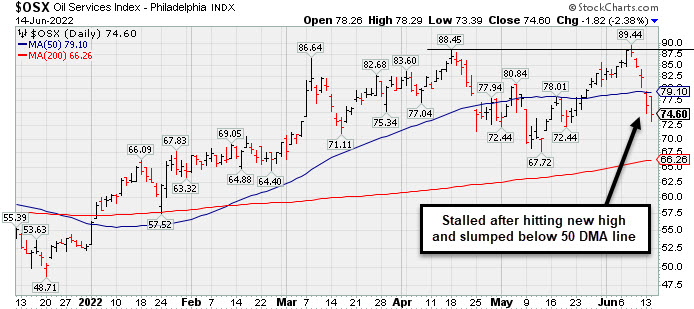
The Semiconductor Index ($SOX +0.63%) eked out a small gain while the Biotech Index ($BTK -0.24%) and Networking Index ($NWX -0.49%) both edged lower. The Broker/Dealer Index ($XBD +1.00%) posted a gain while the Bank Index ($BKX -0.82%) and Retail Index ($RLX -1.10%) created a drag. Commodity-linked groups had a negative bias as the Gold & Silver Index ($XAU -2.53%) and Oil Services Index ($OSX -2.38%) both lost ground while the Integrated Oil Index ($XOI +0.47%) edged higher.
PICTURED: The Oil Services Index ($OSX -2.38%) stalled after touching a new 2022 high and suffered 5 consecutive losses as it slumped below its 50-day moving average (DMA) line.
| Oil Services |
$OSX |
74.60 |
-1.82 |
-2.38% |
+41.51% |
| Integrated Oil |
$XOI |
1,747.85 |
+8.16 |
+0.47% |
+48.35% |
| Semiconductor |
$SOX |
2,689.89 |
+16.89 |
+0.63% |
-31.84% |
| Networking |
$NWX |
679.74 |
-3.37 |
-0.49% |
-30.00% |
| Broker/Dealer |
$XBD |
374.14 |
+3.72 |
+1.00% |
-23.15% |
| Retail |
$RLX |
2,797.64 |
-30.99 |
-1.10% |
-33.81% |
| Gold & Silver |
$XAU |
120.61 |
-3.14 |
-2.53% |
-8.94% |
| Bank |
$BKX |
100.93 |
-0.84 |
-0.82% |
-23.66% |
| Biotech |
$BTK |
4,208.43 |
-10.32 |
-0.24% |
-23.74% |
|
|
|
 |
Featured Stocks
Kenneth J. Gruneisen - Passed the CAN SLIM® Master's Exam
|
|
|
Color Codes Explained :
Y - Better candidates highlighted by our
staff of experts.
G - Previously featured
in past reports as yellow but may no longer be buyable under the
guidelines.
***Last / Change / Volume data in this table is the closing quote data***
Symbol/Exchange
Company Name
Industry Group |
PRICE |
CHANGE
(%Change) |
Day High |
Volume
(% DAV)
(% 50 day avg vol) |
52 Wk Hi
% From Hi |
Featured
Date |
Price
Featured |
Pivot Featured |
|
Max Buy |
 PAG
-
NYSE
PAG
-
NYSE
Penske Automotive Grp
Retail/Whlsle-Automobile
|
$113.06
|
+2.91
2.64% |
$115.41
|
362,849
101.64% of 50 DAV
50 DAV is 357,000
|
$123.60
-8.53%
|
5/13/2022
|
$114.88
|
PP = $114.57
|
|
MB = $120.30
|
 Most Recent Note - 6/14/2022 5:14:22 PM
Y - Posted a gain today with higher volume. Its slump below prior highs in the $114 area raised concerns. Its 50 DMA line ($107.30) defines important near term support to watch.
>>> FEATURED STOCK ARTICLE : Penske Perched at High With No Resistance Remaining - 6/2/2022 |
View all notes |
Set NEW NOTE alert |
Company Profile |
SEC
News |
Chart |
Request a new note
C
A
S
I |
LLY
-
NYSE
Eli Lilly & Co
Medical-Diversified
|
$290.79
|
-0.49
-0.17% |
$292.00
|
2,420,787
80.59% of 50 DAV
50 DAV is 3,004,000
|
$324.08
-10.27%
|
5/16/2022
|
$302.46
|
PP = $314.10
|
|
MB = $329.81
|
Most Recent Note - 6/14/2022 5:13:04 PM
G - Suffered a 4th consecutive loss today with below average volume while slumping further below its 50 DMA line ($298). A rebound above the 50 DMA line is needed for its outlook to improve. Subsequent gains above the pivot point backed by at least +40% above average volume may help clinch a convincing technical buy signal. Fundamentals remain strong.
>>> FEATURED STOCK ARTICLE : Encountering Distributional Pressure After Reaching New Highs - 6/6/2022 |
View all notes |
Set NEW NOTE alert |
Company Profile |
SEC
News |
Chart |
Request a new note
C
A
S
I |
WCC
-
NYSE
Wesco International Inc
WHOLESALE - Electronics Wholesale
|
$120.21
|
-0.04
-0.03% |
$121.83
|
468,760
93.38% of 50 DAV
50 DAV is 502,000
|
$144.43
-16.77%
|
6/1/2022
|
$128.79
|
PP = $139.10
|
|
MB = $146.06
|
Most Recent Note - 6/14/2022 5:15:17 PM
G - Today's 5th consecutive loss was backed by lighter volume. Prior losses violated its 50 DMA line and 200 DMA lines triggering a technical sell signal and its color code was changed to green. Fundamentals remain strong. A rebound above the 50 DMA line ($126) is needed for its outlook to improve.
>>> FEATURED STOCK ARTICLE : Big Volume-Driven Gain Helped Technical Stance Improve - 6/1/2022 |
View all notes |
Set NEW NOTE alert |
Company Profile |
SEC
News |
Chart |
Request a new note
C
A
S
I |
COKE
-
NASDAQ
Coca-Cola Consolidated
FOOD and BEVERAGE - Beverages - Soft Drinks
|
$569.92
|
+17.94
3.25% |
$569.92
|
47,847
119.62% of 50 DAV
50 DAV is 40,000
|
$656.11
-13.14%
|
6/6/2022
|
$629.97
|
PP = $637.49
|
|
MB = $669.36
|
Most Recent Note - 6/14/2022 5:12:01 PM
G - Posted a gain today, halting a slide after 5 consecutive losses with above average volume raised concerns and its color code was changed to green. Prior mid-day reports repeatedly noted - "A strong gain and close above the pivot point backed by at least +40% above average volume may trigger a technical buy signal."
>>> FEATURED STOCK ARTICLE : Paused After Hitting New High With Volume-Driven Gains - 6/7/2022 |
View all notes |
Set NEW NOTE alert |
Company Profile |
SEC
News |
Chart |
Request a new note
C
A
S
I |
|
|
|
THESE ARE NOT BUY RECOMMENDATIONS!
Comments contained in the body of this report are technical
opinions only. The material herein has been obtained
from sources believed to be reliable and accurate, however,
its accuracy and completeness cannot be guaranteed.
This site is not an investment advisor, hence it does
not endorse or recommend any securities or other investments.
Any recommendation contained in this report may not
be suitable for all investors and it is not to be deemed
an offer or solicitation on our part with respect to
the purchase or sale of any securities. All trademarks,
service marks and trade names appearing in this report
are the property of their respective owners, and are
likewise used for identification purposes only.
This report is a service available
only to active Paid Premium Members.
You may opt-out of receiving report notifications
at any time. Questions or comments may be submitted
by writing to Premium Membership Services 665 S.E. 10 Street, Suite 201 Deerfield Beach, FL 33441-5634 or by calling 1-800-965-8307
or 954-785-1121.
|
|
|