You are not logged in.
This means you
CAN ONLY VIEW reports that were published prior to Wednesday, April 9, 2025.
You
MUST UPGRADE YOUR MEMBERSHIP if you want to see any current reports.
AFTER MARKET UPDATE - TUESDAY, JUNE 7TH, 2022
Previous After Market Report Next After Market Report >>>
|
|
|
|
DOW |
+264.36 |
33,180.14 |
+0.80% |
|
Volume |
945,197,261 |
+6% |
|
Volume |
4,362,266,700 |
-5% |
|
NASDAQ |
+113.86 |
12,175.23 |
+0.94% |
|
Advancers |
2,176 |
69% |
|
Advancers |
2,764 |
60% |
|
S&P 500 |
+39.25 |
4,160.68 |
+0.95% |
|
Decliners |
977 |
31% |
|
Decliners |
1,811 |
40% |
|
Russell 2000 |
+29.68 |
1,919.56 |
+1.57% |
|
52 Wk Highs |
98 |
|
|
52 Wk Highs |
55 |
|
|
S&P 600 |
+13.74 |
1,265.26 |
+1.10% |
|
52 Wk Lows |
66 |
|
|
52 Wk Lows |
180 |
|
|
The market remains in a correction (M criteria), as arguably the rally still needs a solid confirmation. An opportunity for a valid follow-through day remains open unless the recent lows or May 20th lows are violated.
|
 |
Breadth Positive and Leadership Improved as Major Indices Rose
Kenneth J. Gruneisen - Passed the CAN SLIM® Master's Exam
The Dow rallied 264 points, while the S&P 500 climbed nearly 1%. The Nasdaq Composite rose 0.9%. Volume totals for Tuesday were reported mixed, higher than the prior session on the NYSE and lower on the Nasdaq exchange. Breadth was positive as advancers led decliners by more than a 2-1 margin on the NYSE and 3-2 on the Nasdaq exchange. Leadership improved as there were 37 high-ranked companies from the Leaders List that hit new 52-week highs and were listed on the BreakOuts Page, versus the total of 33 on the prior session. New 52-week highs outnumbered new 52-week lows on the NYSE, but new lows still outnumbered new 52-week highs on the Nasdaq exchange. The major indices have been in a noted market correction (M criteria). Sources at the newspaper, following the Thursday 5/26/22 session, relabeled it a "confirmed uptrend" despite flaws noted in our ongoing market commentaries. Followers of the fact-based investment system know to watch for a follow-through day backed by higher volume which could signal a new confirmed uptrend.Chart courtesy of www.stockcharts.com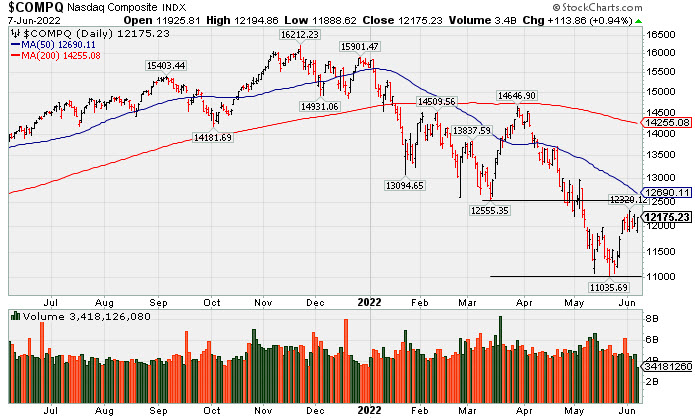 PICTURED: The Nasdaq Composite Index posted a gain with lighter volume. The 3 major indexes cannot be said to be in "healthy" technical shape while all of them are sputtering well below both their 50-day and 200-day moving average (DMA) lines.
Regular readers of this commentary know to be watching closely for signs of truly increasing institutional buying demand. Arguably, the rally still needs confirmation, and an opportunity for a valid follow-through day remains open unless the recent lows or May 20th lows are violated.
U.S. stocks finished firmly higher during a volatile session Tuesday as investors continued to weigh economic uncertainty ahead of Friday’s update on U.S. inflation. Treasuries strengthened, recouping some of yesterday’s sell-off. The yield on the 10-year note slid six basis points (0.06%) to 2.98% after reclaiming the 3.00% level for the first time in nearly a month on Monday. In commodities, West Texas Intermediate crude climbed 1.3% to $120.01/barrel.
Ten of 11 S&P 500 sectors finished in positive territory, with Energy pacing the gains. The Consumer Discretionary group was the lone laggard with Target Corp. (TGT -2.31%) fell after the retailer slashed its profit forecast for a second time in just three weeks amid excess inventory. In earnings, J.M. Smucker Co. (SJM +5.72%) rose as analyst commentary leaned positive despite the company providing lower-than-expected full-year earnings estimates.
Global central bank tightening remained in focus. The Reserve Bank of Australia increased its benchmark rate by a larger-than-expected 0.50%, while the European Central Bank is widely anticipated to announce the end of its bond buying program this week, setting the stage for rate hikes in July. Meanwhile, Federal Reserve officials are in their quiet period ahead of next week’s June 14-15 meeting.
On the data front, the U.S. trade deficit narrowed the most on record (in dollar terms) in April to $87.1 billion from the prior month’s $107.7 billion shortfall as COVID-19 lockdowns in China pressured imports. An update on consumer credit showed borrowing surged by a bigger-than-expected $38.1 billion in April.
|
 Kenneth J. Gruneisen started out as a licensed stockbroker in August 1987, a couple of months prior to the historic stock market crash that took the Dow Jones Industrial Average down -22.6% in a single day. He has published daily fact-based fundamental and technical analysis on high-ranked stocks online for two decades. Through FACTBASEDINVESTING.COM, Kenneth provides educational articles, news, market commentary, and other information regarding proven investment systems that work in good times and bad.
Comments contained in the body of this report are technical opinions only and are not necessarily those of Gruneisen Growth Corp. The material herein has been obtained from sources believed to be reliable and accurate, however, its accuracy and completeness cannot be guaranteed. Our firm, employees, and customers may effect transactions, including transactions contrary to any recommendation herein, or have positions in the securities mentioned herein or options with respect thereto. Any recommendation contained in this report may not be suitable for all investors and it is not to be deemed an offer or solicitation on our part with respect to the purchase or sale of any securities. |
|
 |
Financial, Tech, and Energy Linked Groups Led Gainers
Kenneth J. Gruneisen - Passed the CAN SLIM® Master's Exam
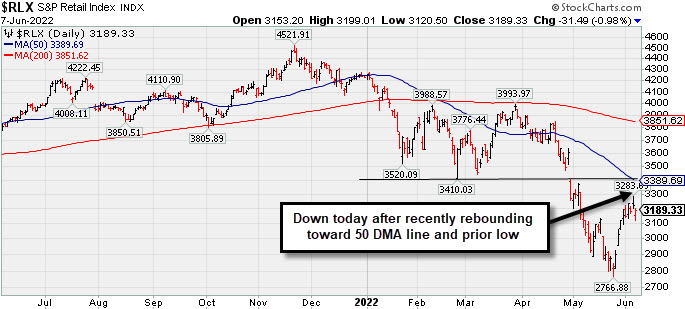
The Bank Index ($BKX +0.83%) and Broker/Dealer Index ($XBD +0.21%) both had a positive influence on the major averages, meanwhile weakness for the Retail Index ($RLX -0.98%) created a drag. The Biotech Index ($BTK +2.36%) led the tech sector higher while the Semiconductor Index ($SOX +0.99%) and Networking Index ($NWX +0.74%) both posted smaller gains. The Oil Services Index ($OSX +3.27%) and Integrated Oil Index ($XOI +2.95%) both posted solid gains while the Gold & Silver Index ($XAU +0.55%) also edged higher.
PICTURED: The Retail Index ($RLX -0.98%) pulled back today after recently rebounding toward its 50-day moving average (DMA) line and prior low.
| Oil Services |
$OSX |
88.37 |
+2.80 |
+3.27% |
+67.62% |
| Integrated Oil |
$XOI |
1,899.84 |
+54.46 |
+2.95% |
+61.25% |
| Semiconductor |
$SOX |
3,092.97 |
+30.23 |
+0.99% |
-21.62% |
| Networking |
$NWX |
764.31 |
+5.63 |
+0.74% |
-21.29% |
| Broker/Dealer |
$XBD |
416.97 |
+0.86 |
+0.21% |
-14.36% |
| Retail |
$RLX |
3,189.33 |
-31.49 |
-0.98% |
-24.54% |
| Gold & Silver |
$XAU |
132.99 |
+0.73 |
+0.55% |
+0.41% |
| Bank |
$BKX |
115.73 |
+0.96 |
+0.83% |
-12.47% |
| Biotech |
$BTK |
4,651.74 |
+107.14 |
+2.36% |
-15.71% |
|
|
|
 |
Paused After Hitting New High With Volume-Driven Gains
Kenneth J. Gruneisen - Passed the CAN SLIM® Master's Exam
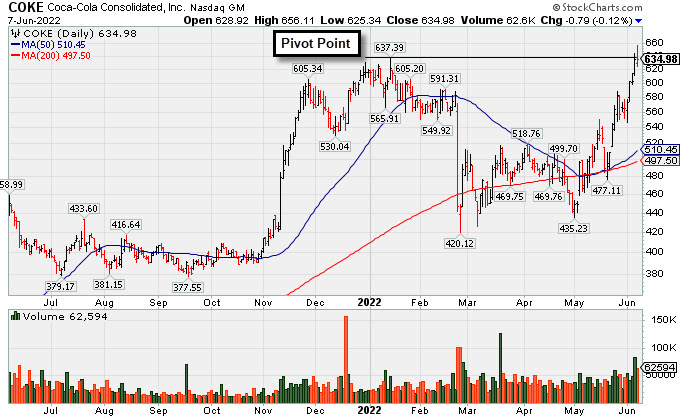
Coca-Cola Consolidated (COKE -$0.79 or -0.12% to $634.98) paused today after reaching a new all-time high following 4 consecutive volume-driven gains. Confirming gains for new highs with at least +40% above average volume would be a reassuring sign of fresh institutional buying demand. It was highlighted in yellow in the 6/06/22 mid-day report (read here) with a pivot point cited based on its 1/13/22 high plus 10 cents and it was noted - "A strong gain and close above the pivot point backed by at least +40% above average volume may trigger a technical buy signal."
Fundamentals have been strong. COKE has a 93 Earnings Per Share Rating, well above the 80+ minimum for buy candidates. It reported Mar '22 quarterly earnings +29% on +11% sales revenues versus the year ago period. Three of the past 4 quarterly comparisons were well above the +25% minimum earnings guideline (C criteria). Annual earnings (A criteria) growth has been very strong after a slight downturn in FY '18.
The number of top-rated funds owning its shares rose from 379 in Jun '21 to 425 in Mar '22, a reassuring sign concerning the I criteria. Its current Up/Down Volume Ratio of 1.3 is an unbiased indication its shares have been under accumulation over the past 50 days. It has a Timeliness Rating of A and a Sponsorship Rating of C. There are only 4.6 million shares in the public float which can contribute to greater price volatility due to any buying or selling by the institutional crowd. |
|
|
Color Codes Explained :
Y - Better candidates highlighted by our
staff of experts.
G - Previously featured
in past reports as yellow but may no longer be buyable under the
guidelines.
***Last / Change / Volume data in this table is the closing quote data***
Symbol/Exchange
Company Name
Industry Group |
PRICE |
CHANGE
(%Change) |
Day High |
Volume
(% DAV)
(% 50 day avg vol) |
52 Wk Hi
% From Hi |
Featured
Date |
Price
Featured |
Pivot Featured |
|
Max Buy |
 CI
-
NYSE
CI
-
NYSE
Cigna Corp
Medical-Managed Care
|
$262.28
|
+5.08
1.98% |
$262.82
|
1,792,267
118.38% of 50 DAV
50 DAV is 1,514,000
|
$273.58
-4.13%
|
5/6/2022
|
$263.52
|
PP = $269.97
|
|
MB = $283.47
|
 Most Recent Note - 6/7/2022 5:19:07 PM
Y - Posted a gain today with slightly higher volume. Color code was changed to yellow after rebounding back above its 50 DMA line ($257) helping its outlook to improve. More damaging losses would raise greater concerns. Fundamentals remain strong.
>>> FEATURED STOCK ARTICLE : Consolidating Above 50-Day Moving Average Near All-Time High - 5/25/2022 |
View all notes |
Set NEW NOTE alert |
Company Profile |
SEC
News |
Chart |
Request a new note
C
A
S
I |
PAG
-
NYSE
Penske Automotive Grp
Retail/Whlsle-Automobile
|
$120.87
|
+0.72
0.60% |
$121.19
|
310,701
88.77% of 50 DAV
50 DAV is 350,000
|
$121.18
-0.26%
|
5/13/2022
|
$114.88
|
PP = $114.57
|
|
MB = $120.30
|
Most Recent Note - 6/7/2022 5:24:32 PM
Y - Posted a 5th consecutive gain today and inched to another new all-time high with below average volume behind its gain. No overhead supply remains to act as resistance. Rebounded back above the previously cited pivot point following a recent pullback. Its 50 DMA line ($105.52) defines important near term support to watch.
>>> FEATURED STOCK ARTICLE : Penske Perched at High With No Resistance Remaining - 6/2/2022 |
View all notes |
Set NEW NOTE alert |
Company Profile |
SEC
News |
Chart |
Request a new note
C
A
S
I |
LLY
-
NYSE
Eli Lilly & Co
Medical-Diversified
|
$312.10
|
+8.74
2.88% |
$312.15
|
3,647,967
123.12% of 50 DAV
50 DAV is 2,963,000
|
$324.08
-3.70%
|
5/16/2022
|
$302.46
|
PP = $314.10
|
|
MB = $329.81
|
Most Recent Note - 6/7/2022 5:23:14 PM
Y - Posted a 2nd consecutive volume-driven gain today. Pulled back last week from a new high yet found support above its 50 DMA line ($297). Pivot point cited was based on its 4/07/22 high plus 10 cents. Subsequent gains above the pivot point backed by at least +40% above average volume may help clinch a convincing technical buy signal. Fundamentals remain strong. See the latest FSU analysis for more details and an annotated graph.
>>> FEATURED STOCK ARTICLE : Encountering Distributional Pressure After Reaching New Highs - 6/6/2022 |
View all notes |
Set NEW NOTE alert |
Company Profile |
SEC
News |
Chart |
Request a new note
C
A
S
I |
WCC
-
NYSE
Wesco International Inc
WHOLESALE - Electronics Wholesale
|
$143.88
|
+8.14
6.00% |
$144.29
|
765,686
160.52% of 50 DAV
50 DAV is 477,000
|
$144.43
-0.38%
|
6/1/2022
|
$128.79
|
PP = $139.10
|
|
MB = $146.06
|
Most Recent Note - 6/7/2022 5:26:17 PM
Y - Posted a big gain today for a new high close backed by +58% above average volume clinching a new technical buy signal. Fundamentals remain strong after it reported Mar '22 quarterly earnings +154% on +22% sales revenues versus the year ago period.
>>> FEATURED STOCK ARTICLE : Big Volume-Driven Gain Helped Technical Stance Improve - 6/1/2022 |
View all notes |
Set NEW NOTE alert |
Company Profile |
SEC
News |
Chart |
Request a new note
C
A
S
I |
COKE
-
NASDAQ
Coca-Cola Consolidated
FOOD and BEVERAGE - Beverages - Soft Drinks
|
$634.98
|
-0.79
-0.12% |
$656.11
|
62,593
164.72% of 50 DAV
50 DAV is 38,000
|
$644.46
-1.47%
|
6/6/2022
|
$629.97
|
PP = $637.49
|
|
MB = $669.36
|
Most Recent Note - 6/7/2022 5:21:12 PM
Y - Paused today after hitting a new all-time high. Posted 4 consecutive volume-driven gains and it was highlighted in yellow with pivot point cited based on its 1/13/22 high plus 10 cents when the 2 latest mid-day reports noted - "A strong gain and close above the pivot point backed by at least +40% above average volume may trigger a technical buy signal. Reported earnings increases above the +25% minimum in the of the past 4 quarterly comparisons through Mar '22 quarters versus the year ago periods. Annual earnings (A criteria) growth has been strong after a downturn in FY '18." See the latest FSU analysis for more details and a new annotated graph.
>>> FEATURED STOCK ARTICLE : Paused After Hitting New High With Volume-Driven Gains - 6/7/2022 |
View all notes |
Set NEW NOTE alert |
Company Profile |
SEC
News |
Chart |
Request a new note
C
A
S
I |
Symbol/Exchange
Company Name
Industry Group |
PRICE |
CHANGE
(%Change) |
Day High |
Volume
(% DAV)
(% 50 day avg vol) |
52 Wk Hi
% From Hi |
Featured
Date |
Price
Featured |
Pivot Featured |
|
Max Buy |
|
|
|
THESE ARE NOT BUY RECOMMENDATIONS!
Comments contained in the body of this report are technical
opinions only. The material herein has been obtained
from sources believed to be reliable and accurate, however,
its accuracy and completeness cannot be guaranteed.
This site is not an investment advisor, hence it does
not endorse or recommend any securities or other investments.
Any recommendation contained in this report may not
be suitable for all investors and it is not to be deemed
an offer or solicitation on our part with respect to
the purchase or sale of any securities. All trademarks,
service marks and trade names appearing in this report
are the property of their respective owners, and are
likewise used for identification purposes only.
This report is a service available
only to active Paid Premium Members.
You may opt-out of receiving report notifications
at any time. Questions or comments may be submitted
by writing to Premium Membership Services 665 S.E. 10 Street, Suite 201 Deerfield Beach, FL 33441-5634 or by calling 1-800-965-8307
or 954-785-1121.
|
|
|