You are not logged in.
This means you
CAN ONLY VIEW reports that were published prior to Sunday, April 13, 2025.
You
MUST UPGRADE YOUR MEMBERSHIP if you want to see any current reports.
AFTER MARKET UPDATE - TUESDAY, MAY 30TH, 2023
Previous After Market Report Next After Market Report >>>
|
|
|
|
DOW |
-50.56 |
33,042.78 |
-0.15% |
|
Volume |
923,258,913 |
+14% |
|
Volume |
4,941,953,200 |
+23% |
|
NASDAQ |
+41.74 |
13,017.43 |
+0.32% |
|
Advancers |
1,352 |
47% |
|
Advancers |
2,038 |
46% |
|
S&P 500 |
+0.07 |
4,205.52 |
+0.00% |
|
Decliners |
1,520 |
53% |
|
Decliners |
2,430 |
54% |
|
Russell 2000 |
-5.73 |
1,767.29 |
-0.32% |
|
52 Wk Highs |
51 |
|
|
52 Wk Highs |
129 |
|
|
S&P 600 |
-5.61 |
1,140.87 |
-0.49% |
|
52 Wk Lows |
70 |
|
|
52 Wk Lows |
146 |
|
|
 |
Major Indices Closed Mixed as Healthy Leadership Underpins Rally
Kenneth J. Gruneisen - Passed the CAN SLIM® Master's Exam
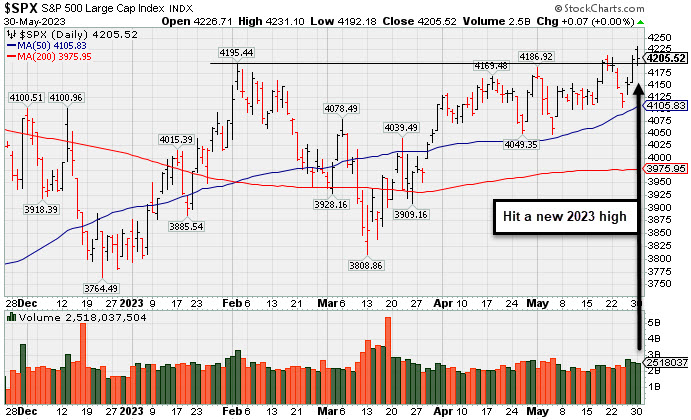
The Dow shed 51 points (-0.2%), while the Nasdaq Composite climbed 0.3%. The S&P 500 finished little changed, Volume totals reported were higher on the NYSE and on the Nasdaq exchange versus the prior session. Decliners led advancers by a narrow margin on the NYSE and on the Nasdaq exchange. There were 76 high-ranked companies from the Leaders List that hit a new 52-week high and were listed on the BreakOuts Page. New 52-week lows outnumbered new 52-week highs on the NYSE and on the Nasdaq exchange. The major indices are in a confirmed uptrend (M criteria). Appropriate new buying efforts may be considered under the fact-based investment system.
PICTURED: The benchmark S&P 500 Index hit a new 2023 high with Tuesday's 3rd consecutive gain but finished little changed.
Three of 11 sectors ended in positive territory U.S. equities finished mixed Tuesday. The rally in technology stocks lost steam and energy companies declined on falling crude oil prices.
On the data front, the Federal Housing Finance Agency House Price Index and the S&P CoreLogic Case-Shiller 20-City Composite Home Price Index rose 0.6% and 0.45%, respectively, month-over-month in March. The Conference Board Consumer Confidence Index declined to 102.3 in May, a six month low, as views about the current state of the labor market and business conditions slipped. In the central bank arena, Richmond Federal Reserve (Fed) President, Thomas Barkin, indicated that he is looking for signs that demand is cooling to be convinced that inflation will ease.
Treasuries strengthened on optimism that Congress may pass a debt ceiling deal in time to prevent a default after news that President Biden and House Speaker Kevin McCarthy reached a tentative agreement over the weekend. The yield on the 10-year note fell 12 basis points (0.12%) to 3.68%, while the 30-year bond yield fell seven basis points (0.07%) to 3.89%. Meanwhile, the yield on the two-year note declined 11 basis points (0.11%) to 4.45%. In commodities, West Texas Intermediate (WTI) crude fell 4% to $69.74/barrel as investors digest signs of weaker demand and ample short-term U.S. supplies. Concerns over China’s tepid economic recovery and its impact on global demand have also pressured prices lower.
|
 Kenneth J. Gruneisen started out as a licensed stockbroker in August 1987, a couple of months prior to the historic stock market crash that took the Dow Jones Industrial Average down -22.6% in a single day. He has published daily fact-based fundamental and technical analysis on high-ranked stocks online for two decades. Through FACTBASEDINVESTING.COM, Kenneth provides educational articles, news, market commentary, and other information regarding proven investment systems that work in good times and bad.
Comments contained in the body of this report are technical opinions only and are not necessarily those of Gruneisen Growth Corp. The material herein has been obtained from sources believed to be reliable and accurate, however, its accuracy and completeness cannot be guaranteed. Our firm, employees, and customers may effect transactions, including transactions contrary to any recommendation herein, or have positions in the securities mentioned herein or options with respect thereto. Any recommendation contained in this report may not be suitable for all investors and it is not to be deemed an offer or solicitation on our part with respect to the purchase or sale of any securities. |
|
 |
Commodity-Linked Groups, Broker/Dealer, and Biotech Indexes Fell
Kenneth J. Gruneisen - Passed the CAN SLIM® Master's Exam
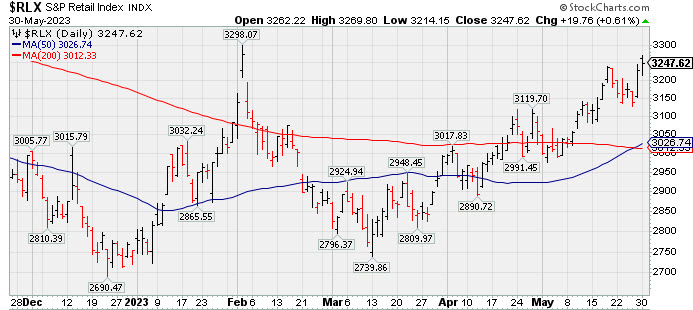
The Broker/Dealer ($XBD -0.62%) created a drag while the Bank ($BKX +0.30%) and Retail ($RLX +0.61%) both posted modest gains. The tech sector was mixed as the Biotech $BTK (-0.92%) lost ground while the Semiconductor ($SOX +0.10%) and Networking ($NWX +0.45%) posted small gains. Commodity-linked groups had a negative bias as the Oil Services ($OSX -1.90%), Integrated Oil ($XOI -1.35%), and the Gold & Silver ($XAU -0.97%) each lost ground.
PICTURED: The Retail ($RLX +0.61%) posted a gain while rebounding toward its 2023 high. Its 50-day moving average (DMA) line has risen above its 200 DMA line, a bullish technical signal termed a "golden cross".
| Oil Services |
$OSX |
71.60 |
-1.39 |
-1.90% |
-14.62% |
| Integrated Oil |
$XOI |
1,610.33 |
-21.96 |
-1.35% |
-9.90% |
| Semiconductor |
$SOX |
3,549.39 |
+3.72 |
+0.10% |
+40.18% |
| Networking |
$NWX |
798.02 |
+3.60 |
+0.45% |
+1.88% |
| Broker/Dealer |
$XBD |
444.45 |
-2.77 |
-0.62% |
-1.04% |
| Retail |
$RLX |
3,247.62 |
+19.76 |
+0.61% |
+17.92% |
| Gold & Silver |
$XAU |
120.52 |
-1.19 |
-0.97% |
-0.28% |
| Bank |
$BKX |
78.09 |
+0.23 |
+0.30% |
-22.57% |
| Biotech |
$BTK |
5,243.07 |
-48.70 |
-0.92% |
-0.72% |
|
|
|
 |
Featured Stocks
Kenneth J. Gruneisen - Passed the CAN SLIM® Master's Exam
|
|
|
Color Codes Explained :
Y - Better candidates highlighted by our
staff of experts.
G - Previously featured
in past reports as yellow but may no longer be buyable under the
guidelines.
***Last / Change / Volume data in this table is the closing quote data***
|
|
|
THESE ARE NOT BUY RECOMMENDATIONS!
Comments contained in the body of this report are technical
opinions only. The material herein has been obtained
from sources believed to be reliable and accurate, however,
its accuracy and completeness cannot be guaranteed.
This site is not an investment advisor, hence it does
not endorse or recommend any securities or other investments.
Any recommendation contained in this report may not
be suitable for all investors and it is not to be deemed
an offer or solicitation on our part with respect to
the purchase or sale of any securities. All trademarks,
service marks and trade names appearing in this report
are the property of their respective owners, and are
likewise used for identification purposes only.
This report is a service available
only to active Paid Premium Members.
You may opt-out of receiving report notifications
at any time. Questions or comments may be submitted
by writing to Premium Membership Services 665 S.E. 10 Street, Suite 201 Deerfield Beach, FL 33441-5634 or by calling 1-800-965-8307
or 954-785-1121.
|
|
|