You are not logged in.
This means you
CAN ONLY VIEW reports that were published prior to Wednesday, April 9, 2025.
You
MUST UPGRADE YOUR MEMBERSHIP if you want to see any current reports.
AFTER MARKET UPDATE - WEDNESDAY, APRIL 27TH, 2022
Previous After Market Report Next After Market Report >>>
|
|
|
|
DOW |
+61.75 |
33,301.93 |
+0.19% |
|
Volume |
992,997,014 |
-1% |
|
Volume |
4,697,383,000 |
-7% |
|
NASDAQ |
-1.81 |
12,488.93 |
-0.01% |
|
Advancers |
1,312 |
42% |
|
Advancers |
1,841 |
41% |
|
S&P 500 |
+8.76 |
4,183.96 |
+0.21% |
|
Decliners |
1,832 |
58% |
|
Decliners |
2,615 |
59% |
|
Russell 2000 |
-6.44 |
1,884.04 |
-0.34% |
|
52 Wk Highs |
17 |
|
|
52 Wk Highs |
32 |
|
|
S&P 600 |
-4.51 |
1,221.94 |
-0.37% |
|
52 Wk Lows |
591 |
|
|
52 Wk Lows |
873 |
|
|
Damaging losses last week signaled a market correction (M criteria). Limiting losses and reducing market exposure is prudent until a new confirmed rally is noted.
|
 |
Major Indices Slumped After Early Gains
Kenneth J. Gruneisen - Passed the CAN SLIM® Master's Exam
The Dow added 61 points, while the S&P 500 eked out a gain of 0.2%, stabilizing from Tuesday’s six-week low. The Nasdaq Composite ended just below the flat line, erasing an earlier advance of as much as 1.7%. The tech-heavy index is positioned for its worst month since October 2008 (-12.2%) after suffering its steepest one-day drop since September 2020 (-4%) yesterday. Volume totals reported were lighter than the prior session on the NYSE and on the Nasdaq exchange. Decliners led advancers by almost a 3-2 margin on the NYSE and by more than a 4-3 on the Nasdaq exchange. There were 2 high-ranked companies from the Leaders List that hit new 52-week highs and were listed on the BreakOuts Page, versus 1 on the prior session. New 52-week lows totals expanded and solidly outnumbered new 52-week highs on both the NYSE and the Nasdaq exchange. The major indices are in a noted market correction (M criteria) after technical damage cited in prior market commentaries published here. Strict followers of the fact-based investment system know to use great caution and always be prepared to reduce exposure by selling any weakening stocks on a case-by-case basis.
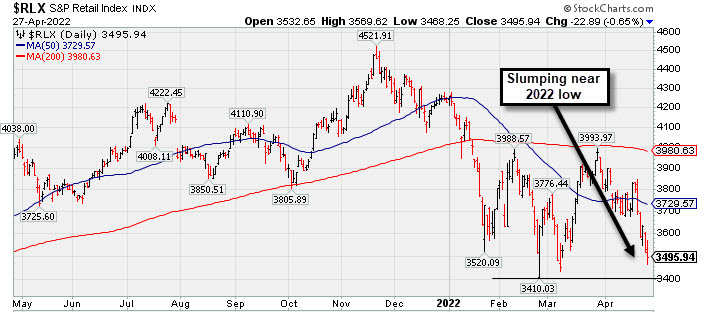
Chart courtesy of www.stockcharts.com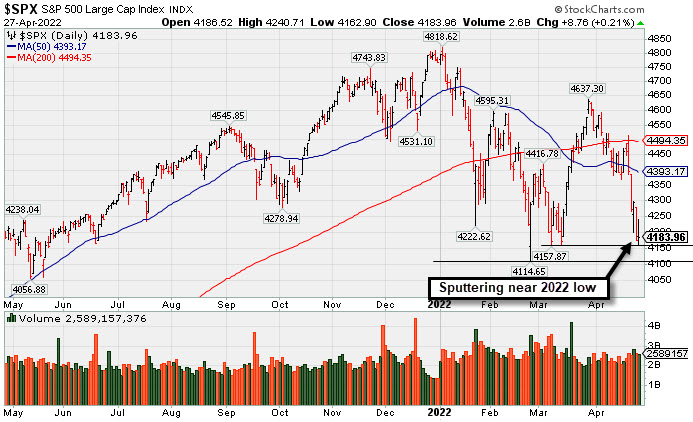 PICTURED: The S&P 500 Index has been sputtering near the 2022 low.
U.S. stocks finished little changed on Wednesday as an early session rebound lost steam into the close. Worries over aggressive monetary policy tightening, the impact of COVID-19 lockdowns in China, and the ongoing Russian-Ukraine war remain among the litany of headwinds weighing on risk appetite lately. The U.S. dollar caught a bid as a perceived safe haven asset, with one measure of the greenback surging to a five-year high.
Six of 11 S&P 500 sectors closed in negative territory. A solid earnings report and upbeat guidance from Microsoft Corp. (MSFT +4.81%) helped Technology shares outperform. The Tech titan rallied following a top and bottom line beat on strength in its cloud services and software segments. Meanwhile, Communication Services was the worst performing group, with Google parent Alphabet Inc. (GOOGL -3.67%) slumping after posting slowing revenue growth on soft digital ad spending. Elsewhere, Visa Inc. (V +6.47%) rose on robust results fueled by strong payments volume. Boeing Co. (BA -7.53%) slid after logging a larger-than-projected quarterly loss.
Treasuries resumed their downtrend, with the yield on the 10-year note up eight basis points (0.08%) to 2.82%. On the data front, a preliminary reading on March wholesale inventories reflected a larger-than-forecasted 2.3% gain. Separately, pending home sales posted a fifth straight monthly drop.
|
 Kenneth J. Gruneisen started out as a licensed stockbroker in August 1987, a couple of months prior to the historic stock market crash that took the Dow Jones Industrial Average down -22.6% in a single day. He has published daily fact-based fundamental and technical analysis on high-ranked stocks online for two decades. Through FACTBASEDINVESTING.COM, Kenneth provides educational articles, news, market commentary, and other information regarding proven investment systems that work in good times and bad.
Comments contained in the body of this report are technical opinions only and are not necessarily those of Gruneisen Growth Corp. The material herein has been obtained from sources believed to be reliable and accurate, however, its accuracy and completeness cannot be guaranteed. Our firm, employees, and customers may effect transactions, including transactions contrary to any recommendation herein, or have positions in the securities mentioned herein or options with respect thereto. Any recommendation contained in this report may not be suitable for all investors and it is not to be deemed an offer or solicitation on our part with respect to the purchase or sale of any securities. |
|
 |
Biotech Index and Energy-Linked Groups Rose
Kenneth J. Gruneisen - Passed the CAN SLIM® Master's Exam
The Biotech Index ($BTK +0.59%) edged higher while the Semiconductor Index ($SOX -0.49%) edged lower and the Networking Index ($NWX -3.32%) suffered a standout loss. The Retail Index ($RLX -0.65%), Broker/Dealer Index ($XBD -0.39%), and Bank Index ($BKX -0.65%) each ended modestly lower. The Oil Services Index ($OSX +1.26%) and Integrated Oil Index ($XOI +1.44%) both posted gains while the Gold & Silver Index ($XAU -0.50%) edged lower.
PICTURED: The Retail Index ($RLX -0.65%) is slumping toward its 2022 low.
| Oil Services |
$OSX |
75.18 |
+0.94 |
+1.26% |
+42.61% |
| Integrated Oil |
$XOI |
1,529.41 |
+21.67 |
+1.44% |
+29.81% |
| Semiconductor |
$SOX |
2,894.91 |
-14.20 |
-0.49% |
-26.64% |
| Networking |
$NWX |
776.67 |
-26.69 |
-3.32% |
-20.02% |
| Broker/Dealer |
$XBD |
413.23 |
-1.62 |
-0.39% |
-15.12% |
| Retail |
$RLX |
3,495.94 |
-22.89 |
-0.65% |
-17.28% |
| Gold & Silver |
$XAU |
141.21 |
-0.71 |
-0.50% |
+6.61% |
| Bank |
$BKX |
112.39 |
-0.73 |
-0.65% |
-15.00% |
| Biotech |
$BTK |
4,741.66 |
+28.03 |
+0.59% |
-14.08% |
|
|
|
 |
Featured Stocks
Kenneth J. Gruneisen - Passed the CAN SLIM® Master's Exam
|
|
|
Color Codes Explained :
Y - Better candidates highlighted by our
staff of experts.
G - Previously featured
in past reports as yellow but may no longer be buyable under the
guidelines.
***Last / Change / Volume data in this table is the closing quote data***
Symbol/Exchange
Company Name
Industry Group |
PRICE |
CHANGE
(%Change) |
Day High |
Volume
(% DAV)
(% 50 day avg vol) |
52 Wk Hi
% From Hi |
Featured
Date |
Price
Featured |
Pivot Featured |
|
Max Buy |
 REGN
-
NASDAQ
REGN
-
NASDAQ
Regeneron Pharmaceutical
DRUGS - Biotechnology
|
$673.51
|
-1.31
-0.19% |
$683.95
|
405,738
63.00% of 50 DAV
50 DAV is 644,000
|
$747.42
-9.89%
|
3/14/2022
|
$647.95
|
PP = $673.96
|
|
MB = $707.66
|
 Most Recent Note - 4/27/2022 5:30:03 PM
Y - Slumped today for yet another loss with below average volume. Undercut prior highs ($686 and $673) raising concerns and nearly testing its 50 DMA line ($669).
>>> FEATURED STOCK ARTICLE : Volume Totals Have Been Light While Hovering at All-Time High - 4/4/2022 |
View all notes |
Set NEW NOTE alert |
Company Profile |
SEC
News |
Chart |
Request a new note
C
A
S
I |
IMKTA
-
NASDAQ
Ingles Markets Inc Cl A
RETAIL - Grocery Stores
|
$93.52
|
-0.60
-0.64% |
$95.50
|
95,721
83.97% of 50 DAV
50 DAV is 114,000
|
$101.98
-8.30%
|
4/11/2022
|
$96.25
|
PP = $95.75
|
|
MB = $100.54
|
Most Recent Note - 4/27/2022 5:26:17 PM
Y - Pulled back today for a 6th consecutive loss since a "negative reversal" at its all-time high. Highlighted in yellow with pivot point cited based on its 3/21/22 high after a cup-with-high-handle base pattern. Subsequent gains backed by at least +40% above average volume may clinch a convincing technical buy signal. Reported Dec '21 earnings +31% on +17% sales revenues versus the year ago period. Three of the past 4 quarterly comparisons were above the +25% minimum earnings guideline (C criteria). Annual earnings growth (A criteria) has been very strong in recent years.
>>> FEATURED STOCK ARTICLE : Closed Near Session Low and Below Pivot Point Cited - 4/11/2022 |
View all notes |
Set NEW NOTE alert |
Company Profile |
SEC
News |
Chart |
Request a new note
C
A
S
I |
WCC
-
NYSE
Wesco International Inc
WHOLESALE - Electronics Wholesale
|
$123.19
|
+3.02
2.51% |
$124.49
|
466,604
102.33% of 50 DAV
50 DAV is 456,000
|
$140.92
-12.58%
|
4/21/2022
|
$135.54
|
PP = $139.10
|
|
MB = $146.06
|
Most Recent Note - 4/27/2022 5:33:25 PM
G - Halted its slide today and rebounded to close above its 200 DMA line. Only a prompt rebound above the 50 DMA line ($124.45) would help its outlook improve.
>>> FEATURED STOCK ARTICLE : Approaching Prior Highs Where it Met Resistance - 4/21/2022 |
View all notes |
Set NEW NOTE alert |
Company Profile |
SEC
News |
Chart |
Request a new note
C
A
S
I |
SMPL
-
NASDAQ
Simply Good Foods Co
Food-Confectionery
|
$41.36
|
-0.15
-0.36% |
$41.92
|
472,230
71.33% of 50 DAV
50 DAV is 662,000
|
$45.77
-9.64%
|
4/13/2022
|
$41.79
|
PP = $43.27
|
|
MB = $45.43
|
Most Recent Note - 4/27/2022 5:32:10 PM
Y - Retreated further from its 52-week high and has been slumping back into the prior base raising concerns. Reported Feb '22 quarterly earnings +44% on +29% sales revenues versus the year ago period, its 4th strong quarterly comparison.
>>> FEATURED STOCK ARTICLE : Simply Good Foods Had a Great Breakout - 4/14/2022 |
View all notes |
Set NEW NOTE alert |
Company Profile |
SEC
News |
Chart |
Request a new note
C
A
S
I |
IMXI
-
NASDAQ
International Money Exp
Financial Svcs-Specialty
|
$19.48
|
+0.10
0.52% |
$19.55
|
183,304
48.75% of 50 DAV
50 DAV is 376,000
|
$21.98
-11.37%
|
3/8/2022
|
$18.64
|
PP = $19.06
|
|
MB = $20.01
|
Most Recent Note - 4/27/2022 5:28:11 PM
Y - Quietly consolidating near its 50 DMA line ($19.09) which defines important near term support to watch. More damaging losses would raise concerns and trigger a technical sell signal.
>>> FEATURED STOCK ARTICLE : Consolidating After Rally From Previously Noted Base - 4/18/2022 |
View all notes |
Set NEW NOTE alert |
Company Profile |
SEC
News |
Chart |
Request a new note
C
A
S
I |
Symbol/Exchange
Company Name
Industry Group |
PRICE |
CHANGE
(%Change) |
Day High |
Volume
(% DAV)
(% 50 day avg vol) |
52 Wk Hi
% From Hi |
Featured
Date |
Price
Featured |
Pivot Featured |
|
Max Buy |
|
|
|
THESE ARE NOT BUY RECOMMENDATIONS!
Comments contained in the body of this report are technical
opinions only. The material herein has been obtained
from sources believed to be reliable and accurate, however,
its accuracy and completeness cannot be guaranteed.
This site is not an investment advisor, hence it does
not endorse or recommend any securities or other investments.
Any recommendation contained in this report may not
be suitable for all investors and it is not to be deemed
an offer or solicitation on our part with respect to
the purchase or sale of any securities. All trademarks,
service marks and trade names appearing in this report
are the property of their respective owners, and are
likewise used for identification purposes only.
This report is a service available
only to active Paid Premium Members.
You may opt-out of receiving report notifications
at any time. Questions or comments may be submitted
by writing to Premium Membership Services 665 S.E. 10 Street, Suite 201 Deerfield Beach, FL 33441-5634 or by calling 1-800-965-8307
or 954-785-1121.
|
|
|