You are not logged in.
This means you
CAN ONLY VIEW reports that were published prior to Tuesday, April 8, 2025.
You
MUST UPGRADE YOUR MEMBERSHIP if you want to see any current reports.
AFTER MARKET UPDATE - WEDNESDAY, APRIL 13TH, 2022
Previous After Market Report Next After Market Report >>>
|
|
|
|
DOW |
+344.23 |
34,564.59 |
+1.01% |
|
Volume |
792,083,518 |
-9% |
|
Volume |
4,812,961,400 |
-3% |
|
NASDAQ |
+272.02 |
13,643.59 |
+2.03% |
|
Advancers |
2,376 |
73% |
|
Advancers |
3,267 |
73% |
|
S&P 500 |
+49.14 |
4,446.59 |
+1.12% |
|
Decliners |
865 |
27% |
|
Decliners |
1,231 |
27% |
|
Russell 2000 |
+38.17 |
2,025.10 |
+1.92% |
|
52 Wk Highs |
110 |
|
|
52 Wk Highs |
87 |
|
|
S&P 600 |
+21.09 |
1,293.01 |
+1.66% |
|
52 Wk Lows |
241 |
|
|
52 Wk Lows |
218 |
|
|
 |
Major Indices Rose With Lighter Volume Totals
Kenneth J. Gruneisen - Passed the CAN SLIM® Master's Exam
The Dow climbed 344 points, while the S&P 500 jumped 1.1%, snapping a three-day losing streak. The Nasdaq Composite rallied 2%, posting its best day in nearly a month as Tech and growth-related led the gains. Volume totals reported were lighter than the prior session on the NYSE and on the Nasdaq exchange, hinting at lackluster institutional buying demand. Advancers led decliners by almost a 4-1 margin on the NYSE and almost a 3-1 margin on the Nasdaq exchange. There were 28 high-ranked companies from the Leaders List that hit new 52-week highs and were listed on the BreakOuts Page, versus 29 on the prior session. New 52-week lows totals still outnumbered new 52-week highs on the NYSE and on the Nasdaq exchange. The major indices are in an uptrend that has come under pressure (M criteria). Strict followers of the fact-based investment system only buy stocks fitting all key fundamental and technical investment criteria.
Chart courtesy of www.stockcharts.com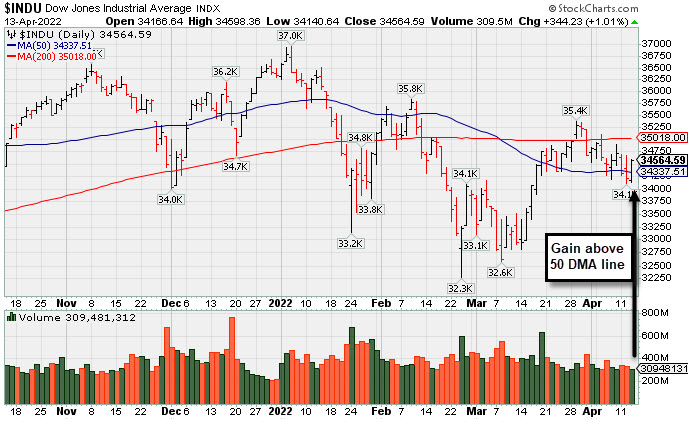 PICTURED: The Dow Jones Industrial Average rose above its 50-day moving average (DMA) line with a gain on lighter volume.
U.S. stocks finished firmly higher on Wednesday as Wall Street assessed the unofficial start of first-quarter earnings season and another round of inflation data. Financials underperformed with JP Morgan Chase & Co. (JPM -3.22%) down on mixed results that included a 42% drop in year-over-year profit, partly attributed to a sizeable loss related to the market fallout from Russia invading Ukraine. In other earnings, Delta Air Lines Inc. (DAL +6.21%) rose after delivering a smaller-than-anticipated quarterly loss and offering upbeat guidance on summer bookings. The positive outlook spurred a rally among other travel-related stocks, with American Airlines Group Inc. (AAL +10.62%) and Marriott International Inc. (MAR +7.53%) both rising. In commodities, West Texas Intermediate crude added 3.6% to $104.26/barrel despite a larger-than-forecasted weekly buildup in domestic stockpiles.
Treasuries strengthened, with the yield on the 10-year note down three basis points (0.03%) to 2.69%. The more Fed-sensitive two-year note yield declined two basis points (0.02%) to 2.35% after yesterday dropping the most since late February (-0.13%) as a smaller-than-projected core Consumer Price Index (CPI) (ex-food and energy) eased expectations of ultra-aggressive monetary policy tightening from the Federal Reserve. Still, the headline CPI jumped 8.5% year-over-year, the most since December 1981. Investors evaluated another inflation reading today, with the Producer Price Index (PPI) climbing a larger-than-expected 11.2% year-over-year in March, representing the fastest pace on record.
|
 Kenneth J. Gruneisen started out as a licensed stockbroker in August 1987, a couple of months prior to the historic stock market crash that took the Dow Jones Industrial Average down -22.6% in a single day. He has published daily fact-based fundamental and technical analysis on high-ranked stocks online for two decades. Through FACTBASEDINVESTING.COM, Kenneth provides educational articles, news, market commentary, and other information regarding proven investment systems that work in good times and bad.
Comments contained in the body of this report are technical opinions only and are not necessarily those of Gruneisen Growth Corp. The material herein has been obtained from sources believed to be reliable and accurate, however, its accuracy and completeness cannot be guaranteed. Our firm, employees, and customers may effect transactions, including transactions contrary to any recommendation herein, or have positions in the securities mentioned herein or options with respect thereto. Any recommendation contained in this report may not be suitable for all investors and it is not to be deemed an offer or solicitation on our part with respect to the purchase or sale of any securities. |
|
 |
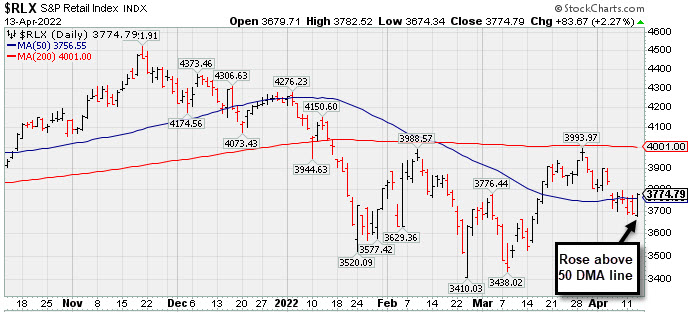
Retail, Tech, Broker/Dealer, and Commodity-Linked Indexes Rose
Kenneth J. Gruneisen - Passed the CAN SLIM® Master's Exam
The tech sector saw unanimous gains from the Semiconductor Index ($SOX +2.36%), Biotech Index ($BTK +2.55%), and the Networking Index ($NWX +1.79%). The Retail Index ($RLX +2.27%) and Broker/Dealer Index ($XBD +1.82%) also posted gains while the Bank Index ($BKX +0.15%) finished little changed. Commodity-linked groups also had a positive bias as the Gold & Silver Index ($XAU +2.23%) Oil Services Index ($OSX +2.36%), and Integrated Oil Index ($XOI +1.40%) rounded out a solidly positive session. PICTURED: The Retail Index ($RLX +2.27%) rebounded above Its 50-day moving average (DMA) but met resistance recently at its 200 DMA line. Subsequent gains above the 200 DMA line would bode well, meanwhile further deterioration would be a worrisome sign for the market outlook.
| Oil Services |
$OSX |
84.00 |
+1.94 |
+2.36% |
+59.33% |
| Integrated Oil |
$XOI |
1,627.66 |
+22.45 |
+1.40% |
+38.15% |
| Semiconductor |
$SOX |
3,119.32 |
+71.85 |
+2.36% |
-20.95% |
| Networking |
$NWX |
853.29 |
+15.01 |
+1.79% |
-12.13% |
| Broker/Dealer |
$XBD |
446.56 |
+7.99 |
+1.82% |
-8.28% |
| Retail |
$RLX |
3,774.79 |
+83.67 |
+2.27% |
-10.69% |
| Gold & Silver |
$XAU |
167.62 |
+3.65 |
+2.23% |
+26.55% |
| Bank |
$BKX |
118.34 |
+0.17 |
+0.15% |
-10.50% |
| Biotech |
$BTK |
5,270.46 |
+131.07 |
+2.55% |
-4.49% |
|
|
|
 |
Featured Stocks
Kenneth J. Gruneisen - Passed the CAN SLIM® Master's Exam
|
|
|
Color Codes Explained :
Y - Better candidates highlighted by our
staff of experts.
G - Previously featured
in past reports as yellow but may no longer be buyable under the
guidelines.
***Last / Change / Volume data in this table is the closing quote data***
Symbol/Exchange
Company Name
Industry Group |
PRICE |
CHANGE
(%Change) |
Day High |
Volume
(% DAV)
(% 50 day avg vol) |
52 Wk Hi
% From Hi |
Featured
Date |
Price
Featured |
Pivot Featured |
|
Max Buy |
 REGN
-
NASDAQ
REGN
-
NASDAQ
Regeneron Pharmaceutical
DRUGS - Biotechnology
|
$731.89
|
+16.10
2.25% |
$732.98
|
526,178
73.28% of 50 DAV
50 DAV is 718,000
|
$747.42
-2.08%
|
3/14/2022
|
$647.95
|
PP = $673.96
|
|
MB = $707.66
|
Most Recent Note - 4/12/2022 6:05:37 PM
G - Pulled back today for a 2nd consecutive loss with lighter volume and closed near the session low. It has been repeatedly noted as extended from any sound base. Prior highs ($686 and $673) define initial support to watch above its 50 DMA line ($652.55).
>>> FEATURED STOCK ARTICLE : Volume Totals Have Been Light While Hovering at All-Time High - 4/4/2022 |
View all notes |
Set NEW NOTE alert |
Company Profile |
SEC
News |
Chart |
Request a new note
C
A
S
I |
IMKTA
-
NASDAQ
Ingles Markets Inc Cl A
RETAIL - Grocery Stores
|
$93.68
|
-0.81
-0.86% |
$96.09
|
113,470
99.54% of 50 DAV
50 DAV is 114,000
|
$96.80
-3.22%
|
4/11/2022
|
$96.25
|
PP = $95.75
|
|
MB = $100.54
|
Most Recent Note - 4/12/2022 6:03:39 PM
Y - There was a "negative reversal" today after 4 consecutive gains. Finished near the session low on the prior session after highlighted in yellow with pivot point cited based on its 3/21/22 high after a cup-with-high-handle base pattern. Subsequent gains backed by at least +40% above average volume and a strong close above the pivot point may clinch a technical buy signal. Reported Dec '21 earnings +31% on +17% sales revenues versus the year ago period. Three of the past 4 quarterly comparisons were above the +25% minimum earnings guideline (C criteria). Annual earnings growth (A criteria) has been very strong in recent years. See the latest FSU analysis for more details and an annotated graph.
>>> FEATURED STOCK ARTICLE : Closed Near Session Low and Below Pivot Point Cited - 4/11/2022 |
View all notes |
Set NEW NOTE alert |
Company Profile |
SEC
News |
Chart |
Request a new note
C
A
S
I |
SMPL
-
NASDAQ
Simply Good Foods Co
Food-Confectionery
|
$42.09
|
+0.69
1.67% |
$42.39
|
607,247
103.45% of 50 DAV
50 DAV is 587,000
|
$43.50
-3.24%
|
4/13/2022
|
$41.79
|
PP = $43.27
|
|
MB = $45.43
|
 Most Recent Note - 4/13/2022 12:42:48 PM
Y - Color code is changed to yellow with new pivot point cited based on its 1/04/22 high plus 10 cents. Subsequent gains and a close above the pivot point backed by at least +40% above average volume may trigger a technical buy signal. Reported Feb '22 quarterly earnings +44% on +29% sales revenues versus the year ago period, its 4th strong quarterly comparison. Following volume driven gains to a new 52-week high last week there was a "negative reversal" on Friday and it has held its ground. Its choppy consolidation was above and below the 50 and 200 DMA lines since dropped from the Featured Stocks list on 1/21/22.
>>> FEATURED STOCK ARTICLE : Violated 200 DMA Line With 4th Consecutive Loss - 1/21/2022 |
View all notes |
Set NEW NOTE alert |
Company Profile |
SEC
News |
Chart |
Request a new note
C
A
S
I |
IMXI
-
Financial Svcs-Specialty
|
Microsoft VBScript runtime error '800a000d'
Type mismatch: 'formatcurrency'
/FeaturedStocks/featuredraw.asp, line 410
|
|
|
THESE ARE NOT BUY RECOMMENDATIONS!
Comments contained in the body of this report are technical
opinions only. The material herein has been obtained
from sources believed to be reliable and accurate, however,
its accuracy and completeness cannot be guaranteed.
This site is not an investment advisor, hence it does
not endorse or recommend any securities or other investments.
Any recommendation contained in this report may not
be suitable for all investors and it is not to be deemed
an offer or solicitation on our part with respect to
the purchase or sale of any securities. All trademarks,
service marks and trade names appearing in this report
are the property of their respective owners, and are
likewise used for identification purposes only.
This report is a service available
only to active Paid Premium Members.
You may opt-out of receiving report notifications
at any time. Questions or comments may be submitted
by writing to Premium Membership Services 665 S.E. 10 Street, Suite 201 Deerfield Beach, FL 33441-5634 or by calling 1-800-965-8307
or 954-785-1121.
|
|
|
|
Kenneth J.
Gruneisen founded Gruneisen Growth Corp. (2003), which prior to May 11,
2015, operated CANSLIM.net and CANSLIM.com both under license from Data
Analysis Inc. / Investor's Business Daily. Kenneth has passed the CAN
SLIM® Master's Exam. Gruneisen Growth Corp. now continues over two
decades of fact based market analysis via FactBasedInvesting.com.
Copyright ©
1996-2025 Gruneisen Growth Corp. All rights reserved. Protected by the
copyright laws of the United States and Canada and by international
treaties
Privacy Policy |
Terms of Use |
Contact Us
|
|