You are not logged in.
This means you
CAN ONLY VIEW reports that were published prior to Thursday, April 10, 2025.
You
MUST UPGRADE YOUR MEMBERSHIP if you want to see any current reports.
AFTER MARKET UPDATE - MONDAY, APRIL 13TH, 2020
Previous After Market Report Next After Market Report >>>
|
|
|
|
DOW |
-328.60 |
23,390.77 |
-1.39% |
|
Volume |
1,162,457,820 |
-23% |
|
Volume |
3,149,732,100 |
-24% |
|
NASDAQ |
+38.84 |
8,192.42 |
+0.48% |
|
Advancers |
773 |
26% |
|
Advancers |
1,280 |
39% |
|
S&P 500 |
-28.19 |
2,761.63 |
-1.01% |
|
Decliners |
2,155 |
74% |
|
Decliners |
1,967 |
61% |
|
Russell 2000 |
-34.68 |
1,212.04 |
-2.78% |
|
52 Wk Highs |
11 |
|
|
52 Wk Highs |
19 |
|
|
S&P 600 |
-24.88 |
718.35 |
-3.35% |
|
52 Wk Lows |
9 |
|
|
52 Wk Lows |
19 |
|
|
 |
Nasdaq Composite Rose as Other Major Indices Fell
Kenneth J. Gruneisen - Passed the CAN SLIM® Master's Exam
The Dow fell 328 points, while the Nasdaq Composite erased an earlier decline to rise 0.5%. After notching its best week since 1974, the S&P 500 slipped 1%. Breadth was negative as decliners led advancers by near a 3-1 margin on the NYSE and by a 3-2 margin on the Nasdaq exchange. The reported volume totals were lighter than the prior session totals on the NYSE and on the Nasdaq exchange. Leadership improved as 10 high-ranked companies from the Leaders List hit new 52-week highs and were listed on the BreakOuts Page, versus 5 on the prior session. New 52-week highs outnumbered the new 52-week lows totals on the NYSE and the totals were even on the Nasdaq exchange. The major indices (M criteria) are in a new confirmed uptrend. Any sustainable rally requires a healthy crop of new leaders. Charts used courtesy of www.stockcharts.com
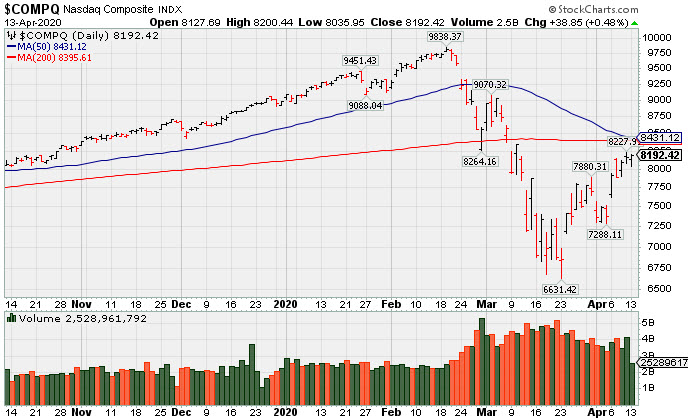
PICTURED: The Nasdaq Composite Index posted a gain with lighter volume on Monday. Disciplined investors know that a follow-through day of big confirming gains on last Monday, April 6th from the major indices on higher volume coupled with an increase in the number of stocks hitting new highs signaled a valid new market uptrend (M criteria).
Stocks finished mixed on Monday as uncertainty surrounding first-quarter earnings season weighed on investor sentiment. Also in focus was a long-awaited production cut agreement by OPEC and its allies, which market participants seemingly viewed as insufficient to balance a drastic slump in global demand as a result of the COVID-19 pandemic. WTI crude fluctuated, only to end the session lower despite the group planning to reduce output by a record 9.7 million barrels per day over the next two months.
Eight of 11 S&P 500 sectors closed in negative territory. Financials underperformed ahead of earnings reports from some of Wall Street’s biggest banks. Industrial shares also lagged, with Caterpillar (CAT -8.71%) fell on the heels of an analyst downgrade. The Consumer Discretionary group bucked the downtrend, led by Amazon (AMZN +6.17%), which challenged its all-time high. The e-commerce giant surged after hiring roughly 75,000 employees amid strong demand and announcing plans to permit its third-party sellers to ship non-essential products in the near future. Elsewhere, Netflix (NFLX +7.01%) was a standout, spiking 7% on reports of increased demand as more consumers shelter at home and engage in social distancing measures.
Treasuries declined, with the yield on the 10-year note up four basis points to 0.76%. On the data front, March retail sales will headline the slate on Wednesday, with the reading anticipated to be the worst on record. |
 Kenneth J. Gruneisen started out as a licensed stockbroker in August 1987, a couple of months prior to the historic stock market crash that took the Dow Jones Industrial Average down -22.6% in a single day. He has published daily fact-based fundamental and technical analysis on high-ranked stocks online for two decades. Through FACTBASEDINVESTING.COM, Kenneth provides educational articles, news, market commentary, and other information regarding proven investment systems that work in good times and bad.
Comments contained in the body of this report are technical opinions only and are not necessarily those of Gruneisen Growth Corp. The material herein has been obtained from sources believed to be reliable and accurate, however, its accuracy and completeness cannot be guaranteed. Our firm, employees, and customers may effect transactions, including transactions contrary to any recommendation herein, or have positions in the securities mentioned herein or options with respect thereto. Any recommendation contained in this report may not be suitable for all investors and it is not to be deemed an offer or solicitation on our part with respect to the purchase or sale of any securities. |
|
 |
Gold & Silver Index, Retail, and Semiconductor Indexes Rose
Kenneth J. Gruneisen - Passed the CAN SLIM® Master's Exam
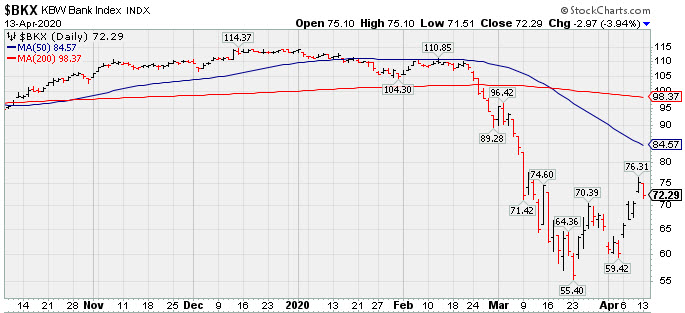
The Bank Index ($BKX -3.94%) and Broker/Dealer Index ($XBD -2.70%) both lost ground while the Retail Index ($RLX +3.02%) rose. The tech sector was mixed as the Semiconductor Index ($SOX +1.37%) outpaced the Biotech Index ($BTK +0.19%) while the Networking Index ($NWX -1.72%) fell. Energy-linked shares fell as the Oil Services Index ($OSX -2.23%) and the Integrated Oil Index ($XOI -1.08%) lost ground. The Gold & Silver Index ($XAU +7.08%) posted a standout gain. PICTURED: The Bank Index ($BKX -3.94%) pulled back on Monday. It has been rebounding from its March 2020 low toward its 50-day moving average (DMA) line.
| Oil Services |
$OSX |
27.70 |
-0.63 |
-2.22% |
-64.62% |
| Integrated Oil |
$XOI |
700.28 |
-7.65 |
-1.08% |
-44.88% |
| Semiconductor |
$SOX |
1,623.68 |
+21.95 |
+1.37% |
-12.22% |
| Networking |
$NWX |
494.17 |
-8.67 |
-1.72% |
-15.30% |
| Broker/Dealer |
$XBD |
231.14 |
-6.42 |
-2.70% |
-20.40% |
| Retail |
$RLX |
2,402.71 |
+70.48 |
+3.02% |
-1.90% |
| Gold & Silver |
$XAU |
105.17 |
+6.95 |
+7.08% |
-1.64% |
| Bank |
$BKX |
72.29 |
-2.97 |
-3.95% |
-36.23% |
| Biotech |
$BTK |
4,743.18 |
+9.00 |
+0.19% |
-6.40% |
|
|
|
 |
Volume-Driven Breakout for Netflix
Kenneth J. Gruneisen - Passed the CAN SLIM® Master's Exam
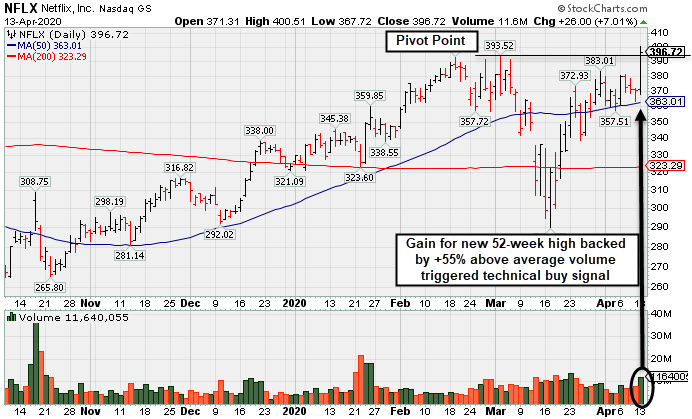
Netflix Inc (NFLX +$26.00 or +7.01% to $396.72) finished strong after it was highlighted in yellow with pivot point cited based on its 3/03/20 high plus 10 cents in the earlier mid-day report (read here). The gain above the pivot point was backed by +55% above average volume and triggered a technical buy signal. It hit a new 52-week high with the big gain, and very little resistance remains due to overhead supply up to the $423 level. It rebounded above its 200 DMA line ($323) and above its 50 DMA line ($363) following an abrupt slump. Keep in mind that NFLX is due to report earnings news on 4/21/20. Volume and volatility often increase near earnings news. It reported earnings +333% on +31% sales revenues for the Dec '19 quarter, its 2nd consecutive very strong quarter. A previously noted downturn in FY '15 earnings (A criteria) has been followed by very strong growth. NFLX went through a choppy consolidation since dropped from the Featured Stocks list on 7/30/18. It was last shown in this FSU section on 7/13/18 with an annotated graph under the headline, "Extended From Base and Pulling Back From All-Time High". The number of top-rated funds owning its shares (I criteria) rose from 1,534 in Mar '17 to 2,269 in Dec '19, a reassuring sign concerning the I criteria. The company has 421.3 million shares in the public float (S criteria) which can make it a less likely sprinter. It has a Timeliness rating of A, a Sponsorship rating of B, and an Accumulation/Distribution Rating of A-. Charts courtesy of www.stockcharts.com
 |
|
|
Color Codes Explained :
Y - Better candidates highlighted by our
staff of experts.
G - Previously featured
in past reports as yellow but may no longer be buyable under the
guidelines.
***Last / Change / Volume data in this table is the closing quote data***
|
|
|
THESE ARE NOT BUY RECOMMENDATIONS!
Comments contained in the body of this report are technical
opinions only. The material herein has been obtained
from sources believed to be reliable and accurate, however,
its accuracy and completeness cannot be guaranteed.
This site is not an investment advisor, hence it does
not endorse or recommend any securities or other investments.
Any recommendation contained in this report may not
be suitable for all investors and it is not to be deemed
an offer or solicitation on our part with respect to
the purchase or sale of any securities. All trademarks,
service marks and trade names appearing in this report
are the property of their respective owners, and are
likewise used for identification purposes only.
This report is a service available
only to active Paid Premium Members.
You may opt-out of receiving report notifications
at any time. Questions or comments may be submitted
by writing to Premium Membership Services 665 S.E. 10 Street, Suite 201 Deerfield Beach, FL 33441-5634 or by calling 1-800-965-8307
or 954-785-1121.
|
|
|