You are not logged in.
This means you
CAN ONLY VIEW reports that were published prior to Saturday, April 19, 2025.
You
MUST UPGRADE YOUR MEMBERSHIP if you want to see any current reports.
AFTER MARKET UPDATE - TUESDAY, MARCH 24TH, 2020
Previous After Market Report Next After Market Report >>>
|
|
|
|
DOW |
+2,112.98 |
20,704.91 |
+11.37% |
|
Volume |
1,697,645,800 |
+7% |
|
Volume |
4,361,786,900 |
+2% |
|
NASDAQ |
+557.19 |
7,417.86 |
+8.12% |
|
Advancers |
2,677 |
92% |
|
Advancers |
2,828 |
86% |
|
S&P 500 |
+209.93 |
2,447.33 |
+9.38% |
|
Decliners |
240 |
8% |
|
Decliners |
463 |
14% |
|
Russell 2000 |
+94.12 |
1,096.54 |
+9.39% |
|
52 Wk Highs |
1 |
|
|
52 Wk Highs |
8 |
|
|
S&P 600 |
+53.65 |
649.32 |
+9.01% |
|
52 Wk Lows |
87 |
|
|
52 Wk Lows |
115 |
|
|
 |
Major Indices Make Another Big Bounce But Concerns Remain
Kenneth J. Gruneisen - Passed the CAN SLIM® Master's Exam
The Dow climbed 2,112 points to add 11.4%, notching its largest one-day percentage gain since 1933. The S&P 500 rallied 9.4%, its best day since October 2008. The Nasdaq Composite gained 8.1%.Breadth was positive as advancers led decliners by an 11-1 margin on the NYSE and 6-1 on the Nasdaq exchange. The reported volume totals were higher than the prior session totals on the NYSE and on the Nasdaq exchange. Leadership remained thin as zero high-ranked companies from the Leaders List hit a new 52-week high and were listed on the BreakOuts Page versus 1 on the prior session. New 52-week lows totals contracted yet still easily outnumbered new 52-week highs totals which were in the single digits on both the NYSE and on the Nasdaq exchange. The major indices' (M criteria) have been in a noted "market correction" and investors have been prompted since February 25th to reduce market exposure. Charts used courtesy of www.stockcharts.com
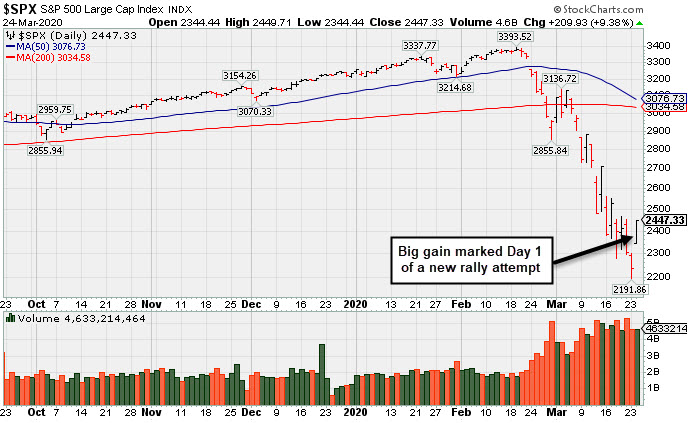
PICTURED: The S&P 500 Index posted a big +9.38% gain marking Day 1 of a new rally attempt. Disciplined investors know to watch between Days 4-7 for a follow-through day of big gains from the major indices on higher volume coupled with an increase in the number of stocks hitting new highs to confirm a new market uptrend before initiating any new buying efforts.
Stocks finished higher on Tuesday, rebounding from three-year lows. Risk sentiment was supported by hopes that the U.S. Senate was nearing an agreement on the latest COVID-19 stimulus bill, reportedly worth up to $2 trillion. House Speaker Nancy Pelosi told reporters this morning that there is “real optimism” that Congress can reach an accord.
All 11 S&P 500 sectors closed in positive territory, with six groups jumping more than 10%. Energy shares paced gains, while Consumer Staples lagged on a relative basis. The gains were broad-based, with Financials, Industrials, Utilities, and Technology all outperforming. In stock news, Chevron (CVX +22.74%) spiked higher after announcing plans to cut capital expenditures and suspend stock buybacks in order to protect the company’s dividend. Elsewhere, travel-related stocks rebounded with Norwegian Cruise Lines (NCLH +42.19%) and American Airlines (AAL +35.80%) posting huge percentage gains.
Treasuries declined, with the yield on the 10-year note up eight basis points to 0.83%. In commodities, COMEX gold climbed another 5.9%, on the heels of its best day since March 2009. The U.S. dollar snapped a 10-session winning streak.
On the data front, a preliminary March update from research firm IHS Markit showed the composite gauge of both U.S. manufacturing and services sector activity fell the most since October 2009. Across the pond, the comparable measure for eurozone business activity dropped to the lowest point since the PMI surveys began in July 1998. |
 Kenneth J. Gruneisen started out as a licensed stockbroker in August 1987, a couple of months prior to the historic stock market crash that took the Dow Jones Industrial Average down -22.6% in a single day. He has published daily fact-based fundamental and technical analysis on high-ranked stocks online for two decades. Through FACTBASEDINVESTING.COM, Kenneth provides educational articles, news, market commentary, and other information regarding proven investment systems that work in good times and bad.
Comments contained in the body of this report are technical opinions only and are not necessarily those of Gruneisen Growth Corp. The material herein has been obtained from sources believed to be reliable and accurate, however, its accuracy and completeness cannot be guaranteed. Our firm, employees, and customers may effect transactions, including transactions contrary to any recommendation herein, or have positions in the securities mentioned herein or options with respect thereto. Any recommendation contained in this report may not be suitable for all investors and it is not to be deemed an offer or solicitation on our part with respect to the purchase or sale of any securities. |
|
 |
Commodity-Linked Groups Led Financial, Tech, and Retail Indexes
Kenneth J. Gruneisen - Passed the CAN SLIM® Master's Exam
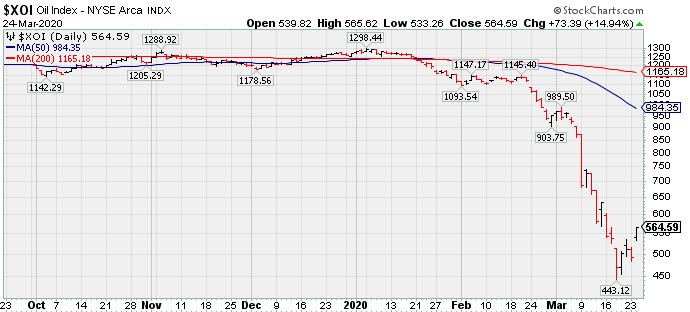
Commodity-linked groups rallied sharply as the Oil Services Index ($OSX +18.40%), Integrated Oil Index ($XOI +14.94%), and Gold & Silver Index ($XAU +15.55%) were standout gainers. The Bank Index ($BKX +12.50%) and Broker/Dealer Index ($XBD +13.53%) posted big gains. The Semiconductor Index ($SOX +11.15%) and Networking Index ($NWX +11.90%) led the tech sector's bounce as the Biotech Index ($BTK +5.79%) followed. The Retail Index ($RLX +5.81%) also notched a solid gain.
PICTURED: The Integrated Oil Index ($XOI +14.94%) is rebounding from a deep multi-year low.
| Oil Services |
$OSX |
26.81 |
+4.16 |
+18.37% |
-65.76% |
| Integrated Oil |
$XOI |
564.59 |
+73.39 |
+14.94% |
-55.56% |
| Semiconductor |
$SOX |
1,491.83 |
+149.71 |
+11.15% |
-19.34% |
| Networking |
$NWX |
438.14 |
+46.58 |
+11.90% |
-24.90% |
| Broker/Dealer |
$XBD |
206.20 |
+24.57 |
+13.53% |
-28.99% |
| Retail |
$RLX |
2,140.59 |
+117.52 |
+5.81% |
-12.60% |
| Gold & Silver |
$XAU |
86.27 |
+11.61 |
+15.55% |
-19.31% |
| Bank |
$BKX |
63.21 |
+7.02 |
+12.49% |
-44.24% |
| Biotech |
$BTK |
4,181.05 |
+228.83 |
+5.79% |
-17.49% |
|
|
|
 |
No Featured Stocks
Kenneth J. Gruneisen - Passed the CAN SLIM® Master's Exam
During extremely bearish markets the number of stocks covered in this area has sometimes been reduced to zero. We suggest making no excuses for weak stocks in weak markets. Feel free to contact us if you have a need for any additional information. |
|
|
Color Codes Explained :
Y - Better candidates highlighted by our
staff of experts.
G - Previously featured
in past reports as yellow but may no longer be buyable under the
guidelines.
***Last / Change / Volume data in this table is the closing quote data***
|
|
|
THESE ARE NOT BUY RECOMMENDATIONS!
Comments contained in the body of this report are technical
opinions only. The material herein has been obtained
from sources believed to be reliable and accurate, however,
its accuracy and completeness cannot be guaranteed.
This site is not an investment advisor, hence it does
not endorse or recommend any securities or other investments.
Any recommendation contained in this report may not
be suitable for all investors and it is not to be deemed
an offer or solicitation on our part with respect to
the purchase or sale of any securities. All trademarks,
service marks and trade names appearing in this report
are the property of their respective owners, and are
likewise used for identification purposes only.
This report is a service available
only to active Paid Premium Members.
You may opt-out of receiving report notifications
at any time. Questions or comments may be submitted
by writing to Premium Membership Services 665 S.E. 10 Street, Suite 201 Deerfield Beach, FL 33441-5634 or by calling 1-800-965-8307
or 954-785-1121.
|
|
|