You are not logged in.
This means you
CAN ONLY VIEW reports that were published prior to Tuesday, April 15, 2025.
You
MUST UPGRADE YOUR MEMBERSHIP if you want to see any current reports.
AFTER MARKET UPDATE - THURSDAY, MARCH 5TH, 2020
Previous After Market Report Next After Market Report >>>
|
|
|
|
DOW |
-969.58 |
26,121.28 |
-3.58% |
|
Volume |
1,403,965,310 |
+14% |
|
Volume |
3,734,397,200 |
+5% |
|
NASDAQ |
-279.49 |
8,738.60 |
-3.10% |
|
Advancers |
313 |
11% |
|
Advancers |
581 |
18% |
|
S&P 500 |
-106.18 |
3,023.94 |
-3.39% |
|
Decliners |
2,496 |
89% |
|
Decliners |
2,636 |
82% |
|
Russell 2000 |
-52.37 |
1,478.82 |
-3.42% |
|
52 Wk Highs |
38 |
|
|
52 Wk Highs |
57 |
|
|
S&P 600 |
-32.80 |
883.67 |
-3.58% |
|
52 Wk Lows |
389 |
|
|
52 Wk Lows |
373 |
|
|
During market corrections it is especially important to reduce exposure, preserve your capital, and just be patient. Be safe! Historic studies have shown that the biggest up sessions have occurred during market corrections and bear markets.
Disciplined investors know to wait until a new confirmed rally marked by a solid follow-through day. The bold portion of the daily market commentary will note when that happens. For any clarification or additional help applying the fact-based investment system, we invite members to call, or contact us via the inquiry form.
|
 |
Breadth Clearly Negative as Correction Continues for Major Indices
Kenneth J. Gruneisen - Passed the CAN SLIM® Master's Exam
The Dow slipped 969 points, a day after the blue-chip index recorded its second best point gain on record. The S&P 500 fell 3.4%, for the fourth straight move of at least 2.8%. The Nasdaq Composite declined 3.1%. Breadth was clearly negative as decliners led advancers by an 8-1 margin on the NYSE and by more than a 4-1 margin on the Nasdaq exchange. The reported volume totals were higher than the prior session totals on the NYSE and on the Nasdaq exchange, revealing more distributional selling pressure from the institutional crowd. Leadership remained thin as there were 11 high-ranked companies from the Leaders List that hit a new 52-week high and were listed on the BreakOuts Page, versus 15 on the prior session. New 52-week lows totals swelled and easily outnumbered new 52-week highs on the NYSE and on the Nasdaq exchange. The major indices' (M criteria) have been in a noted "market correction". Disciplined investors know to watch for a follow-through day of gains on higher volume to confirm a new market uptrend. The Featured Stocks Page provides the most timely analysis on high-ranked leaders. Charts used courtesy of www.stockcharts.com
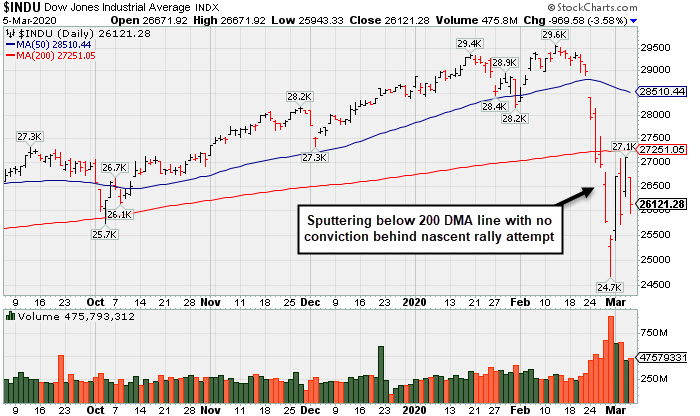
PICTURED: The Dow Jones Industrial Average is sputtering below its 200-day moving average (DMA) line with no volume conviction behind its nascent rally attempt. The Blue Chip index is -11.6% off its all-time high hit on 2/12/20. Disciplined investors will watch for a follow-through day of big gains on higher volume to signal a new confirmed rally.
U.S. stocks retreated Thursday, giving up the majority of yesterday’s steep gains as market volatility rises to its highest reading since 2011. Investor attention largely remains on the economic risks related to the coronavirus, as investors weigh international fiscal and monetary response to the outbreak. Additionally, California declared a state of emergency amid an uptick in confirmed cases.
U.S. Treasuries rallied, with the yield on the 10-year note dropping 13 basis points to 0.91%. The benchmark rate has now dropped for 11-straight sessions, the longest streak in at least a generation, according to Reuters. On the data front, initial jobless claims decreased slightly to 216,000 in the most recent week, from the prior period’s 219,000 figure. A separate update showed factory orders dipped 0.5% in January, disappointing consensus expectations of a 0.1% decline.
All 11 S&P 500 sectors finished the day in negative territory, with Industrials and Financial stocks both losing nearly 5.0%. Airlines tumbled more than 8.0% after the industry’s trade association projected between $60-$100 billion in lost revenue in 2020 depending on the severity of the coronavirus outbreak. United Airlines (UAL -13.25%) sank and American Airlines (AAL -13.44%) fell for its worst day since 2016. In other corporate news, Zoom Video (ZM +7.02%) after the coronavirus provided a tailwind to remote work technology companies. |
 Kenneth J. Gruneisen started out as a licensed stockbroker in August 1987, a couple of months prior to the historic stock market crash that took the Dow Jones Industrial Average down -22.6% in a single day. He has published daily fact-based fundamental and technical analysis on high-ranked stocks online for two decades. Through FACTBASEDINVESTING.COM, Kenneth provides educational articles, news, market commentary, and other information regarding proven investment systems that work in good times and bad.
Comments contained in the body of this report are technical opinions only and are not necessarily those of Gruneisen Growth Corp. The material herein has been obtained from sources believed to be reliable and accurate, however, its accuracy and completeness cannot be guaranteed. Our firm, employees, and customers may effect transactions, including transactions contrary to any recommendation herein, or have positions in the securities mentioned herein or options with respect thereto. Any recommendation contained in this report may not be suitable for all investors and it is not to be deemed an offer or solicitation on our part with respect to the purchase or sale of any securities. |
|
 |
Gold & Silver Index Rose Amid Widespread Weakness
Kenneth J. Gruneisen - Passed the CAN SLIM® Master's Exam
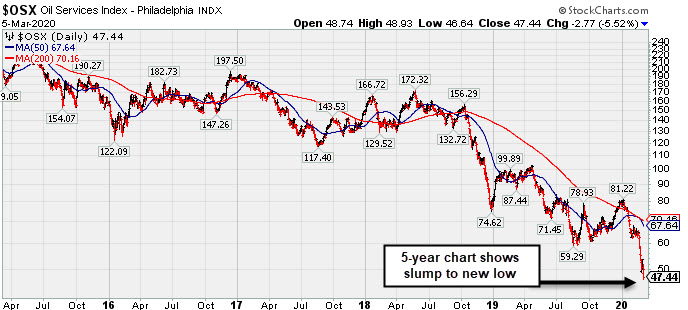
The Bank Index ($BKX -5.76%) and Broker/Dealer Index ($XBD -3.84%) were standout decliners and the Retail Index ($RLX -3.14%) also slumped badly. The tech sector had a clearly negative bias as the Semiconductor Index ($SOX -3.10%), Networking Index ($NWX -2.65%), and the Biotech Index ($BTK -1.89%) slumped. Commodity-linked groups were mixed again as the Oil Services Index ($OSX -5.52%) and the Integrated Oil Index ($XOI -3.57%) slumped while the Gold & Silver Index ($XAU +1.97%) was a standout gainer.
PICTURED: The 5-year graph of the Oil Services Index ($OSX -5.52%) shows it slumping to another new low.
| Oil Services |
$OSX |
47.44 |
-2.78 |
-5.54% |
-39.40% |
| Integrated Oil |
$XOI |
927.95 |
-34.38 |
-3.57% |
-26.96% |
| Semiconductor |
$SOX |
1,734.03 |
-55.54 |
-3.10% |
-6.25% |
| Networking |
$NWX |
492.24 |
-13.42 |
-2.65% |
-15.63% |
| Broker/Dealer |
$XBD |
260.56 |
-10.41 |
-3.84% |
-10.27% |
| Retail |
$RLX |
2,412.79 |
-78.10 |
-3.14% |
-1.49% |
| Gold & Silver |
$XAU |
104.70 |
+2.03 |
+1.98% |
-2.08% |
| Bank |
$BKX |
87.86 |
-5.37 |
-5.76% |
-22.49% |
| Biotech |
$BTK |
5,012.03 |
-96.55 |
-1.89% |
-1.09% |
|
|
|
 |
Featured Stocks
Kenneth J. Gruneisen - Passed the CAN SLIM® Master's Exam
See the Featured Stocks with most recent note below. Feel free to contact us if you have a need for any additional information. |
|
|
Color Codes Explained :
Y - Better candidates highlighted by our
staff of experts.
G - Previously featured
in past reports as yellow but may no longer be buyable under the
guidelines.
***Last / Change / Volume data in this table is the closing quote data***
Symbol/Exchange
Company Name
Industry Group |
PRICE |
CHANGE
(%Change) |
Day High |
Volume
(% DAV)
(% 50 day avg vol) |
52 Wk Hi
% From Hi |
Featured
Date |
Price
Featured |
Pivot Featured |
|
Max Buy |
 FTNT
-
NASDAQ
FTNT
-
NASDAQ
Fortinet Inc
Computer Sftwr-Security
|
$104.00
|
-3.05
-2.85% |
$107.39
|
1,299,147
95.88% of 50 DAV
50 DAV is 1,355,000
|
$121.82
-14.63%
|
12/9/2019
|
$103.85
|
PP = $106.10
|
|
MB = $111.41
|
Most Recent Note - 3/4/2020 5:56:54 PM
G - Posted a solid gain on average volume today. A rebound above the 50 DMA line ($113.69) is needed for its outlook to improve. Reported earnings +29% on +21% sales revenues for the Dec '19 quarter, continuing its strong earnings track record above the +25% minimum guideline (C criteria).
>>> FEATURED STOCK ARTICLE : Volume Driven Losses Violated 50-Day Moving Average - 2/26/2020 |
View all notes |
Set NEW NOTE alert |
Company Profile |
SEC
News |
Chart |
Request a new note
C
A
S
I |
LULU
-
NASDAQ
Lululemon Athletica
MANUFACTURING - Textile Manufacturing
|
$221.19
|
-10.43
-4.50% |
$227.38
|
1,998,987
131.69% of 50 DAV
50 DAV is 1,518,000
|
$266.20
-16.91%
|
9/6/2019
|
$201.25
|
PP = $194.35
|
|
MB = $204.07
|
 Most Recent Note - 3/5/2020 5:18:38 PM
Suffered another loss today with above average volume during very weak market conditions (M criteria). A rebound above the 50 DMA line ($240) would help its outlook improve. Fundamentals remain strong. It will be dropped from the Featured Stocks list tonight.
>>> FEATURED STOCK ARTICLE : Perched at Record High After 4th Consecutive Gain on Light Volume - 2/20/2020 |
View all notes |
Set NEW NOTE alert |
Company Profile |
SEC
News |
Chart |
Request a new note
C
A
S
I |
SPLK
-
NASDAQ
Splunk Inc
Computer Sftwr-Database
|
$141.25
|
-14.15
-9.11% |
$151.41
|
8,765,597
541.09% of 50 DAV
50 DAV is 1,620,000
|
$176.31
-19.89%
|
11/25/2019
|
$147.79
|
PP = $142.16
|
|
MB = $149.27
|
Most Recent Note - 3/5/2020 5:14:42 PM
Suffered a big loss on heavy volume today after reporting earnings +3% on +27% sales revenues for the Jan '20 quarter, below the +25% minimum guideline (C criteria), raising fundamental concerns. It will be dropped from the Featured Stocks list tonight.
>>> FEATURED STOCK ARTICLE : Perched at Record High After 7th Consecutive Gain - 2/19/2020 |
View all notes |
Set NEW NOTE alert |
Company Profile |
SEC
News |
Chart |
Request a new note
C
A
S
I |
PAYC
-
NYSE
Paycom Software Inc
COMPUTER SOFTWARE and SERVICES - Application Software
|
$282.26
|
-11.43
-3.89% |
$295.40
|
653,293
66.53% of 50 DAV
50 DAV is 982,000
|
$342.00
-17.47%
|
11/20/2019
|
$252.97
|
PP = $259.81
|
|
MB = $272.80
|
Most Recent Note - 3/5/2020 5:19:44 PM
G - Met resistance near its 50 DMA line ($295) and slumped today. Gains above that important short-term average still are needed to help its outlook improve. Fundamentals remain strong after it reported earnings +41% on +29% for the Dec '19 quarter.
>>> FEATURED STOCK ARTICLE : Sputtering Below 50-Day Moving Average - 3/3/2020 |
View all notes |
Set NEW NOTE alert |
Company Profile |
SEC
News |
Chart |
Request a new note
C
A
S
I |
TEAM
-
NASDAQ
Atlassian Corp Plc Cl A
Comp Sftwr-Spec Enterprs
|
$152.21
|
-1.26
-0.82% |
$155.30
|
1,412,732
85.16% of 50 DAV
50 DAV is 1,659,000
|
$156.12
-2.50%
|
1/24/2020
|
$144.66
|
PP = $140.49
|
|
MB = $147.51
|
Most Recent Note - 3/4/2020 5:53:20 PM
G - Posted a solid gain with average volume and its color code is changed to green after rising back above its "max buy" level. Found support above its 50 DMA line ($139.52) amid widespread market weakness (M criteria). Fundamentals remain strong. See the latest FSU analysis for more details and a new annotated graph.
>>> FEATURED STOCK ARTICLE : Found Support at 50-Day Average During Recent Consolidation - 3/4/2020 |
View all notes |
Set NEW NOTE alert |
Company Profile |
SEC
News |
Chart |
Request a new note
C
A
S
I |
Symbol/Exchange
Company Name
Industry Group |
PRICE |
CHANGE
(%Change) |
Day High |
Volume
(% DAV)
(% 50 day avg vol) |
52 Wk Hi
% From Hi |
Featured
Date |
Price
Featured |
Pivot Featured |
|
Max Buy |
STNE
-
NASDAQ
Stoneco Ltd Cl A
Finance-CrdtCard/PmtPr
|
$41.71
|
-2.64
-5.95% |
$44.03
|
2,830,593
134.66% of 50 DAV
50 DAV is 2,102,000
|
$46.69
-10.67%
|
1/22/2020
|
$43.94
|
PP = $45.72
|
|
MB = $48.01
|
Most Recent Note - 3/5/2020 5:16:11 PM
Y - Slumped near its 50 DMA line ($41.91) today after touching a new all-time high with volume-driven gains this week. Reported earnings +71% on +43% sales revenues for the Dec '19 quarter, continuing its strong earnings track record. The worrisome market correction (M criteria) is cause for concern, even if there are subsequent gains above the pivot point backed by at least +40% above average volume to trigger a technical buy signal.
>>> FEATURED STOCK ARTICLE : Volume-Driven Gain Above 50-Day Moving Average - 3/2/2020 |
View all notes |
Set NEW NOTE alert |
Company Profile |
SEC
News |
Chart |
Request a new note
C
A
S
I |
DAVA
-
NYSE
Endava Plc Cl A Ads
Computer-Tech Services
|
$52.97
|
-0.07
-0.13% |
$53.56
|
143,977
109.07% of 50 DAV
50 DAV is 132,000
|
$56.76
-6.68%
|
2/13/2020
|
$53.71
|
PP = $49.86
|
|
MB = $52.35
|
Most Recent Note - 3/4/2020 6:00:08 PM
G - Churned above average volume today, still perched only -6.6% off its all-time high. Prior highs in the $49 area define initial support to watch above its 50 DMA line ($48.84).
>>> FEATURED STOCK ARTICLE : Breakout Gain Backed By +462% Above Average Volme - 2/13/2020 |
View all notes |
Set NEW NOTE alert |
Company Profile |
SEC
News |
Chart |
Request a new note
C
A
S
I |
|
|
|
THESE ARE NOT BUY RECOMMENDATIONS!
Comments contained in the body of this report are technical
opinions only. The material herein has been obtained
from sources believed to be reliable and accurate, however,
its accuracy and completeness cannot be guaranteed.
This site is not an investment advisor, hence it does
not endorse or recommend any securities or other investments.
Any recommendation contained in this report may not
be suitable for all investors and it is not to be deemed
an offer or solicitation on our part with respect to
the purchase or sale of any securities. All trademarks,
service marks and trade names appearing in this report
are the property of their respective owners, and are
likewise used for identification purposes only.
This report is a service available
only to active Paid Premium Members.
You may opt-out of receiving report notifications
at any time. Questions or comments may be submitted
by writing to Premium Membership Services 665 S.E. 10 Street, Suite 201 Deerfield Beach, FL 33441-5634 or by calling 1-800-965-8307
or 954-785-1121.
|
|
|