***Last / Change / Volume data in this table is the closing quote data***
Symbol/Exchange
Company Name
Industry Group |
PRICE |
CHANGE
(%Change) |
Day High |
Volume
(% DAV)
(% 50 day avg vol) |
52 Wk Hi
% From Hi |
Featured
Date |
Price
Featured |
Pivot Featured |
|
Max Buy |
BIDU
-
NASDAQ
Baidu Inc Ads
INTERNET - Internet Information Providers
|
$121.85
|
+2.36
1.98% |
$122.14
|
4,039,863
57.60% of 50 DAV
50 DAV is 7,013,200
|
$131.63
-7.43%
|
2/1/2011
|
$117.74
|
PP = $112.08
|
|
MB = $117.68
|
 Most Recent Note - 3/3/2011 4:23:57 PM
G - Recent gains have been backed by below average volume. Its 50 DMA line and 2/23/11 low define important chart support levels to watch.
>>> The latest Featured Stock Update with an annotated graph appeared on 2/2/2011. Click here.
View all notes |
Alert me of new notes |
CANSLIM.net Company Profile |
SEC |
Zacks Reports |
StockTalk |
News |
Chart |
Request a new note
C
A N
S L
I M


|
CMG
-
NYSE
Chipotle Mexican Grill
LEISURE - Restaurants
|
$246.85
|
+4.03
1.66% |
$250.95
|
774,328
75.45% of 50 DAV
50 DAV is 1,026,300
|
$275.00
-10.24%
|
2/11/2011
|
$271.15
|
PP = $262.87
|
|
MB = $276.01
|
Most Recent Note - 3/3/2011 4:27:32 PM
G - Consolidating above its 50 DMA line and prior highs in the $237 area defining chart support levels to watch. A violation and damaging loss would raise greater concerns and trigger a technical sell signal.
>>> The latest Featured Stock Update with an annotated graph appeared on 2/11/2011. Click here.
View all notes |
Alert me of new notes |
CANSLIM.net Company Profile |
SEC |
Zacks Reports |
StockTalk |
News |
Chart |
Request a new note
C
A N
S L
I M
|
CRUS
-
NASDAQ
Cirrus Logic Inc
ELECTRONICS - Semiconductor - Specialized
|
$24.98
|
+1.65
7.07% |
$25.14
|
4,620,797
137.86% of 50 DAV
50 DAV is 3,351,700
|
$25.48
-1.96%
|
1/28/2011
|
$20.69
|
PP = $19.17
|
|
MB = $20.13
|
Most Recent Note - 3/3/2011 11:07:24 AM
G - Gapped up today, rallying near its 52-week high. Found support after a pullback near prior chart highs last week amid widespread weakness. Subsequent deterioration below its 2/23/11 low ($21.17) would raise concerns, technically, and any close below its significant prior high close ($20.54 on 7/26/10) would raise even greater concerns.
>>> The latest Featured Stock Update with an annotated graph appeared on 1/28/2011. Click here.
View all notes |
Alert me of new notes |
CANSLIM.net Company Profile |
SEC |
Zacks Reports |
StockTalk |
News |
Chart |
Request a new note
C
A N
S L
I M
|
CTSH
-
NASDAQ
Cognizant Tech Sol Cl A
COMPUTER SOFTWARE and SERVICES - Business Software and Services
|
$76.84
|
+2.27
3.04% |
$77.20
|
2,050,587
90.37% of 50 DAV
50 DAV is 2,269,100
|
$77.74
-1.16%
|
2/7/2011
|
$75.09
|
PP = $76.46
|
|
MB = $80.28
|
Most Recent Note - 3/3/2011 4:03:37 PM
Y - Up today on lighter volume, rising from support at its 50 DMA line. No overhead supply remains to hinder its progress. It stalled after its 2/08/11 breakout with bare minimum volume. Subsequent confirming gains for new highs with above average volume would be a welcome reassurance of institutional accumulation.
>>> The latest Featured Stock Update with an annotated graph appeared on 2/8/2011. Click here.
View all notes |
Alert me of new notes |
CANSLIM.net Company Profile |
SEC |
Zacks Reports |
StockTalk |
News |
Chart |
Request a new note
C
A N
S L
I M
|
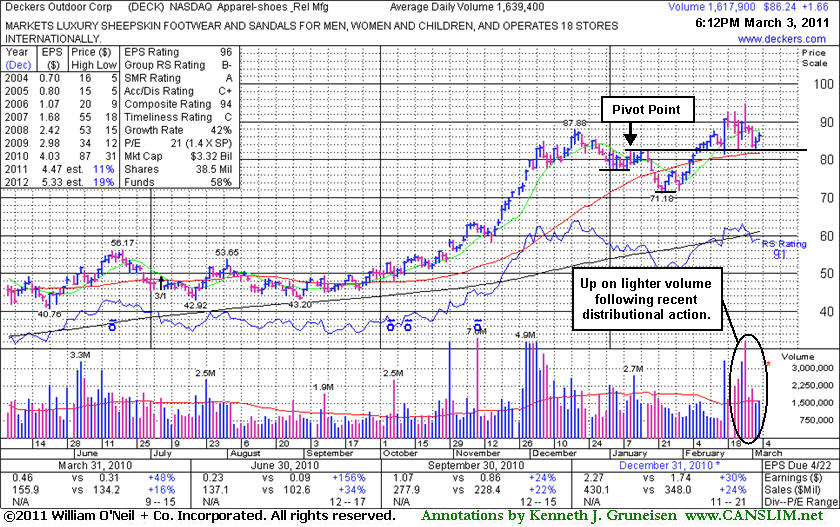
DECK
-
NASDAQ
Deckers Outdoor Corp
CONSUMER NON-DURABLES - Textile - Apparel Footwear
|
$86.24
|
+1.66
1.96% |
$87.24
|
1,636,918
98.53% of 50 DAV
50 DAV is 1,661,400
|
$94.70
-8.93%
|
2/3/2011
|
$79.61
|
PP = $82.67
|
|
MB = $86.80
|
Most Recent Note - 3/3/2011 4:44:18 PM
G - Posted 2 consecutive gains on light or near average volume after recent losses on above average volume. Churning above average volume action without meaningful price progress has been noted as indicative of distributional pressure following its 2/17/11 technical breakout. Support to watch is at its pivot point and 50 DMA line (now $81.68).
>>> The latest Featured Stock Update with an annotated graph appeared on 3/3/2011. Click here.
View all notes |
Alert me of new notes |
CANSLIM.net Company Profile |
SEC |
Zacks Reports |
StockTalk |
News |
Chart |
Request a new note
C
A N
S L
I M
|
Symbol/Exchange
Company Name
Industry Group |
PRICE |
CHANGE
(%Change) |
Day High |
Volume
(% DAV)
(% 50 day avg vol) |
52 Wk Hi
% From Hi |
Featured
Date |
Price
Featured |
Pivot Featured |
|
Max Buy |
EBIX
-
NASDAQ
Ebix Inc
COMPUTER SOFTWARE and SERVICES - Business Software and Services
|
$28.71
|
+1.53
5.63% |
$29.08
|
1,306,563
262.41% of 50 DAV
50 DAV is 497,900
|
$28.21
1.77%
|
2/28/2011
|
$25.70
|
PP = $25.97
|
|
MB = $27.27
|
Most Recent Note - 3/3/2011 11:55:42 AM
G - Gapped up today and hit a new 52-week high. Color code is changed to green while getting extended beyond the "max buy" level +5% above the pivot point recently cited. Prior highs in the $25-26 area define initial support to watch above its 50 DMA line.
>>> The latest Featured Stock Update with an annotated graph appeared on 2/28/2011. Click here.
View all notes |
Alert me of new notes |
CANSLIM.net Company Profile |
SEC |
Zacks Reports |
StockTalk |
News |
Chart |
Request a new note
C
A N
S L
I M
|
EZCH
-
NASDAQ
Ezchip Semiconductor Ltd
ELECTRONICS - Semiconductor - Specialized
|
$30.25
|
+0.79
2.68% |
$30.35
|
217,865
56.50% of 50 DAV
50 DAV is 385,600
|
$33.48
-9.65%
|
12/2/2010
|
$27.53
|
PP = $26.00
|
|
MB = $27.30
|
Most Recent Note - 3/3/2011 4:16:49 PM
G - Today's gain on light volume has it challenging its 50 DMA line which has recently acted as resistance while volume totals have cooled. A convincing rebound above its short-term average would help its outlook, meanwhile it faces overhead supply up through the $33 area which may hinder its ability to rally.
>>> The latest Featured Stock Update with an annotated graph appeared on 3/1/2011. Click here.
View all notes |
Alert me of new notes |
CANSLIM.net Company Profile |
SEC |
Zacks Reports |
StockTalk |
News |
Chart |
Request a new note
C
A N
S L
I M
|
EZPW
-
NASDAQ
Ezcorp Inc Cl A
SPECIALTY RETAIL - Specialty Retail, Other
|
$29.39
|
+0.56
1.94% |
$29.68
|
281,155
71.07% of 50 DAV
50 DAV is 395,600
|
$29.94
-1.84%
|
2/18/2011
|
$27.94
|
PP = $30.04
|
|
MB = $31.54
|
Most Recent Note - 3/3/2011 4:18:41 PM
Y - Up again on light volume today for its third-best close ever, perched -1.9% off its 52-week high and just above its 50 DMA line and showing resilience. Subsequent gains with heavy volume above its pivot point may trigger a new (or add-on) technical buy signal. Recent low ($25.56 on 1/25/11) defines an important support level now.
>>> The latest Featured Stock Update with an annotated graph appeared on 2/3/2011. Click here.
View all notes |
Alert me of new notes |
CANSLIM.net Company Profile |
SEC |
Zacks Reports |
StockTalk |
News |
Chart |
Request a new note
C
A N
S L
I M
|
FOSL
-
NASDAQ
Fossil Inc
CONSUMER DURABLES - Recreational Goods, Other
|
$80.33
|
+4.14
5.43% |
$80.59
|
1,232,481
149.23% of 50 DAV
50 DAV is 825,900
|
$83.68
-4.00%
|
2/1/2011
|
$73.30
|
PP = $74.44
|
|
MB = $78.16
|
Most Recent Note - 3/3/2011 11:11:02 AM
G - Gapped up today, rising from its 50 DMA line. It is consolidating above prior resistance in the $74 area previously noted as defining chart support.
>>> The latest Featured Stock Update with an annotated graph appeared on 2/24/2011. Click here.
View all notes |
Alert me of new notes |
CANSLIM.net Company Profile |
SEC |
Zacks Reports |
StockTalk |
News |
Chart |
Request a new note
C
A N
S L
I M
|
GSIT
-
NASDAQ
G S I Technology Inc
ELECTRONICS - Semiconductor - Broad Line
|
$9.49
|
+0.31
3.38% |
$9.50
|
116,506
47.73% of 50 DAV
50 DAV is 244,100
|
$10.20
-6.96%
|
2/18/2011
|
$10.08
|
PP = $10.25
|
|
MB = $10.76
|
Most Recent Note - 3/3/2011 4:05:05 PM
G - Small gap up gain today on very light volume. Recently halted its slide at its 50 DMA line, an important chart support level. A subsequent rally for a close above its 2/18/11 close ($9.78) would help its outlook following its gap down on 2/22/11 and damaging losses on higher volume.
>>> The latest Featured Stock Update with an annotated graph appeared on 2/18/2011. Click here.
View all notes |
Alert me of new notes |
CANSLIM.net Company Profile |
SEC |
Zacks Reports |
StockTalk |
News |
Chart |
Request a new note
C
A N
S L
I M
|
Symbol/Exchange
Company Name
Industry Group |
PRICE |
CHANGE
(%Change) |
Day High |
Volume
(% DAV)
(% 50 day avg vol) |
52 Wk Hi
% From Hi |
Featured
Date |
Price
Featured |
Pivot Featured |
|
Max Buy |
HMSY
-
NASDAQ
H M S Holdings Corp
COMPUTER SOFTWARE and SERVICES - Healthcare Information Service
|
$77.46
|
+1.81
2.39% |
$77.88
|
203,112
126.71% of 50 DAV
50 DAV is 160,300
|
$77.43
0.04%
|
11/19/2010
|
$61.89
|
PP = $63.01
|
|
MB = $66.16
|
Most Recent Note - 3/3/2011 4:06:41 PM
G - Rose on average volume today for its best-ever close. Extended from any sound base pattern after a recent streak of volume-driven gains. Support to watch is defined by prior chart highs and its 50 DMA line in the $67 area.
>>> The latest Featured Stock Update with an annotated graph appeared on 2/16/2011. Click here.
View all notes |
Alert me of new notes |
CANSLIM.net Company Profile |
SEC |
Zacks Reports |
StockTalk |
News |
Chart |
Request a new note
C
A N
S L
I M
|
JOBS
-
NASDAQ
Fifty One Job Inc Ads
DIVERSIFIED SERVICES - Staffing and; Outsourcing Service
|
$60.60
|
+2.88
4.99% |
$60.82
|
172,042
127.44% of 50 DAV
50 DAV is 135,000
|
$64.55
-6.12%
|
2/7/2011
|
$59.23
|
PP = $61.38
|
|
MB = $64.45
|
Most Recent Note - 3/3/2011 3:46:54 PM
Y - Up today with above average volume, poised to possibly finish at a new high close. It has been repeatedly noted - "A subsequent rally to new highs with above average volume may confirm a new buy signal, meanwhile its recent low ($52.58 on 1/28/11) defines another important support level below its 50 DMA line where violations would raise serious concerns and trigger technical sell signals."
>>> The latest Featured Stock Update with an annotated graph appeared on 2/7/2011. Click here.
View all notes |
Alert me of new notes |
CANSLIM.net Company Profile |
SEC |
Zacks Reports |
StockTalk |
News |
Chart |
Request a new note
C
A N
S L
I M
|
LULU
-
NASDAQ
Lululemon Athletica
MANUFACTURING - Textile Manufacturing
|
$75.66
|
+1.96
2.66% |
$76.31
|
1,426,833
73.23% of 50 DAV
50 DAV is 1,948,500
|
$85.28
-11.28%
|
1/26/2011
|
$68.11
|
PP = $74.70
|
|
MB = $78.44
|
Most Recent Note - 3/3/2011 4:13:10 PM
Y - Small gap up gain today on light volume, finding support at its 50 DMA line. A violation of that important short-term average may trigger a technical sell signal. A close below a significant prior high close ($73.51 on 12/21/10) would completely negate its latest breakout, raising more serious concerns.
>>> The latest Featured Stock Update with an annotated graph appeared on 2/25/2011. Click here.
View all notes |
Alert me of new notes |
CANSLIM.net Company Profile |
SEC |
Zacks Reports |
StockTalk |
News |
Chart |
Request a new note
C
A N
S L
I M
|
MWIV
-
NASDAQ
M W I Veterinary Supply
HEALTH SERVICES - Medical Instruments and; Supplies
|
$71.22
|
+2.23
3.23% |
$71.88
|
73,147
98.58% of 50 DAV
50 DAV is 74,200
|
$72.27
-1.45%
|
11/4/2010
|
$61.79
|
PP = $59.60
|
|
MB = $62.58
|
Most Recent Note - 3/3/2011 4:00:29 PM
G - Up today with below above average volume, poised for its second best close ever. Found support near prior highs and its 50 DMA line recently but did not build a sound new base pattern.
>>> The latest Featured Stock Update with an annotated graph appeared on 2/2/2011. Click here.
View all notes |
Alert me of new notes |
CANSLIM.net Company Profile |
SEC |
Zacks Reports |
StockTalk |
News |
Chart |
Request a new note
C
A N
S L
I M
|
NFLX
-
NASDAQ
Netflix Inc
SPECIALTY RETAIL - Music and Video Stores
|
$203.37
|
-0.86
-0.42% |
$207.09
|
5,037,625
94.00% of 50 DAV
50 DAV is 5,359,100
|
$247.55
-17.85%
|
1/10/2011
|
$187.88
|
PP = $209.34
|
|
MB = $219.81
|
Most Recent Note - 3/3/2011 4:41:08 PM
Down for an 11th loss in 12 sessions, lagging on today's widely positive session and closing -17.8% off its high. Based on weakness it will be dropped from the Featured Stocks list tonight. It has thus far found support at its 50 DMA line, however deterioration has led to closes below its significant prior high close ($205.90 on 11/30/10), raising some concerns.
>>> The latest Featured Stock Update with an annotated graph appeared on 2/23/2011. Click here.
View all notes |
Alert me of new notes |
CANSLIM.net Company Profile |
SEC |
Zacks Reports |
StockTalk |
News |
Chart |
Request a new note
C
A N
S L
I M
|
Symbol/Exchange
Company Name
Industry Group |
PRICE |
CHANGE
(%Change) |
Day High |
Volume
(% DAV)
(% 50 day avg vol) |
52 Wk Hi
% From Hi |
Featured
Date |
Price
Featured |
Pivot Featured |
|
Max Buy |
OPEN
-
NASDAQ
Opentable Inc
INTERNET - Internet Software and Services
|
$89.11
|
+3.04
3.53% |
$90.79
|
1,316,150
131.17% of 50 DAV
50 DAV is 1,003,400
|
$95.97
-7.15%
|
1/5/2011
|
$74.05
|
PP = $76.79
|
|
MB = $80.63
|
Most Recent Note - 3/3/2011 3:50:53 PM
G - Gapped up today, rising with above average volume. Found support above prior resistance near $82 and above its 50 DMA line, but it has not built any recent sound base pattern.
>>> The latest Featured Stock Update with an annotated graph appeared on 2/15/2011. Click here.
View all notes |
Alert me of new notes |
CANSLIM.net Company Profile |
SEC |
Zacks Reports |
StockTalk |
News |
Chart |
Request a new note
C
A N
S L
I M
|
ORCL
-
NASDAQ
Oracle Corp
COMPUTER SOFTWARE and SERVICES - Application Software
|
$33.03
|
+0.91
2.83% |
$33.19
|
24,168,597
97.11% of 50 DAV
50 DAV is 24,887,200
|
$33.71
-2.02%
|
1/20/2011
|
$32.31
|
PP = $32.37
|
|
MB = $33.99
|
Most Recent Note - 3/3/2011 3:53:16 PM
Y - Gapped up today after finding prompt support near its 50 DMA line. Its prior low previously noted ($30.80 on 1/10/11) defines the next important chart support level to watch.
>>> The latest Featured Stock Update with an annotated graph appeared on 2/22/2011. Click here.
View all notes |
Alert me of new notes |
CANSLIM.net Company Profile |
SEC |
Zacks Reports |
StockTalk |
News |
Chart |
Request a new note
C
A N
S L
I M
|
PAY
-
NYSE
Verifone Systems Inc
COMPUTER HARDWARE - Transaction Automation Systems
|
$48.59
|
+0.14
0.29% |
$49.81
|
2,094,822
140.55% of 50 DAV
50 DAV is 1,490,400
|
$49.91
-2.64%
|
1/27/2011
|
$41.77
|
PP = $44.97
|
|
MB = $47.22
|
Most Recent Note - 3/3/2011 12:08:42 PM
G - Challenging its 52-week high and all-time highs today with no resistance remaining due to overhead supply. Gapped up on 3/02/11 after reporting earnings +65% on +27% sales revenues for the quarter ended January 31, 2011 versus the year-ago period. Color code was changed to green again after getting extended from a sound base. See the latest FSU analysis for more details and a new annotated graph.
>>> The latest Featured Stock Update with an annotated graph appeared on 3/2/2011. Click here.
View all notes |
Alert me of new notes |
CANSLIM.net Company Profile |
SEC |
Zacks Reports |
StockTalk |
News |
Chart |
Request a new note
C
A N
S L
I M
|
PCLN
-
NASDAQ
Priceline.Com Inc
INTERNET - Internet Software and Services
|
$464.79
|
+15.61
3.48% |
$464.80
|
1,545,673
142.55% of 50 DAV
50 DAV is 1,084,300
|
$469.40
-0.98%
|
1/3/2011
|
$399.55
|
PP = $428.20
|
|
MB = $449.61
|
Most Recent Note - 3/3/2011 3:57:14 PM
G - Up today with above average volume, poised for a new high close. Color code is again changed to green after getting extended from a sound base.
>>> The latest Featured Stock Update with an annotated graph appeared on 2/14/2011. Click here.
View all notes |
Alert me of new notes |
CANSLIM.net Company Profile |
SEC |
Zacks Reports |
StockTalk |
News |
Chart |
Request a new note
C
A N
S L
I M
|
RAX
-
NYSE
Rackspace Hosting Inc
INTERNET - Internet Software and; Services
|
$37.89
|
+1.21
3.30% |
$38.14
|
1,682,951
94.08% of 50 DAV
50 DAV is 1,788,900
|
$40.62
-6.72%
|
1/10/2011
|
$22.84
|
PP = $32.76
|
|
MB = $34.40
|
Most Recent Note - 3/3/2011 3:58:58 PM
G - Up today on below average volume, now perched -7% off its all-time high. Consolidating just above prior highs near $35 previously noted as defining support to watch above its 50 DMA line.
>>> The latest Featured Stock Update with an annotated graph appeared on 2/9/2011. Click here.
View all notes |
Alert me of new notes |
CANSLIM.net Company Profile |
SEC |
Zacks Reports |
StockTalk |
News |
Chart |
Request a new note
C
A N
S L
I M
|
Symbol/Exchange
Company Name
Industry Group |
PRICE |
CHANGE
(%Change) |
Day High |
Volume
(% DAV)
(% 50 day avg vol) |
52 Wk Hi
% From Hi |
Featured
Date |
Price
Featured |
Pivot Featured |
|
Max Buy |
TIBX
-
NASDAQ
Tibco Software Inc
COMPUTER SOFTWARE and SERVICES - Business Software and Services
|
$25.33
|
+0.92
3.77% |
$25.75
|
1,826,187
65.81% of 50 DAV
50 DAV is 2,774,800
|
$25.94
-2.35%
|
2/1/2011
|
$24.35
|
PP = $22.18
|
|
MB = $23.29
|
Most Recent Note - 3/3/2011 11:13:15 AM
G - Gapped up today, rallying near its 52-week high. Found support above prior highs in the $22 area and well above its 50 DMA line.
>>> The latest Featured Stock Update with an annotated graph appeared on 2/10/2011. Click here.
View all notes |
Alert me of new notes |
CANSLIM.net Company Profile |
SEC |
Zacks Reports |
StockTalk |
News |
Chart |
Request a new note
C
A N
S L
I M
|
UA
-
NYSE
Under Armour Inc Cl A
CONSUMER NON-DURABLES - Textile - Apparel Clothing
|
$66.56
|
+2.68
4.20% |
$66.65
|
713,813
97.78% of 50 DAV
50 DAV is 730,000
|
$70.43
-5.49%
|
1/27/2011
|
$58.31
|
PP = $56.99
|
|
MB = $59.84
|
Most Recent Note - 3/3/2011 3:48:07 PM
G - Small gap up today, still quietly consolidating well above prior resistance and its 50 DMA line in the $60 area that define chart support to watch. It has not formed any recent sound base pattern.
>>> The latest Featured Stock Update with an annotated graph appeared on 2/1/2011. Click here.
View all notes |
Alert me of new notes |
CANSLIM.net Company Profile |
SEC |
Zacks Reports |
StockTalk |
News |
Chart |
Request a new note
C
A N
S L
I M
|
ULTA
-
NASDAQ
Ulta Salon Cosm & Frag
SPECIALTY RETAIL - Specialty Retail, Other
|
$42.25
|
+1.15
2.80% |
$42.68
|
374,527
70.51% of 50 DAV
50 DAV is 531,200
|
$44.06
-4.11%
|
1/6/2011
|
$36.12
|
PP = $37.34
|
|
MB = $39.21
|
Most Recent Note - 3/3/2011 4:21:02 PM
G - Gain on light volume today, finishing -4.2% off its all-time high. It has not built a sound new base pattern. Prior highs in the $37-38 area define chart support to watch above its 50 DMA line.
>>> The latest Featured Stock Update with an annotated graph appeared on 2/17/2011. Click here.
View all notes |
Alert me of new notes |
CANSLIM.net Company Profile |
SEC |
Zacks Reports |
StockTalk |
News |
Chart |
Request a new note
C
A N
S L
I M
|