You are not logged in.
This means you
CAN ONLY VIEW reports that were published prior to Monday, April 7, 2025.
You
MUST UPGRADE YOUR MEMBERSHIP if you want to see any current reports.
AFTER MARKET UPDATE - MONDAY, FEBRUARY 3RD, 2020
Previous After Market Report Next After Market Report >>>
|
|
|
|
DOW |
+143.78 |
28,399.81 |
+0.51% |
|
Volume |
973,845,950 |
-26% |
|
Volume |
2,403,352,800 |
-10% |
|
NASDAQ |
+122.46 |
9,273.40 |
+1.34% |
|
Advancers |
1,870 |
65% |
|
Advancers |
2,066 |
65% |
|
S&P 500 |
+23.40 |
3,248.92 |
+0.73% |
|
Decliners |
1,003 |
35% |
|
Decliners |
1,121 |
35% |
|
Russell 2000 |
+18.14 |
1,632.21 |
+1.12% |
|
52 Wk Highs |
141 |
|
|
52 Wk Highs |
78 |
|
|
S&P 600 |
+8.99 |
993.59 |
+0.91% |
|
52 Wk Lows |
85 |
|
|
52 Wk Lows |
86 |
|
|
 |
Major Indices Rose Despite Coronoavirus Concerns
Kenneth J. Gruneisen - Passed the CAN SLIM® Master's Exam
Stocks finished higher on Monday, rebounding from last week’s slump. The Dow advanced 143 points, while the S&P 500 rose 0.7%. The Nasdaq Composite was up 1.3%. Advancers led decliners by more than a 9-5 margin on the NYSE and on the Nasdaq exchange. The reported volume totals were lighter than the prior session totals on the NYSE and on the Nasdaq exchange. There were 29 high-ranked companies from the Leaders List that hit a new 52-week high and were listed on the BreakOuts Page, versus the total of 27 on the prior session. New 52-week highs outnumbered new 52-week lows on the NYSE but new lows outnumbered new highs on the Nasdaq exchange. The major indices' (M criteria) uptrend has recently come under pressure. Disciplined investors buy individual stocks on a case-by-case basis only if all key criteria are met. The Featured Stocks Page provides the most timely analysis on high-ranked leaders. Charts used courtesy of www.stockcharts.com
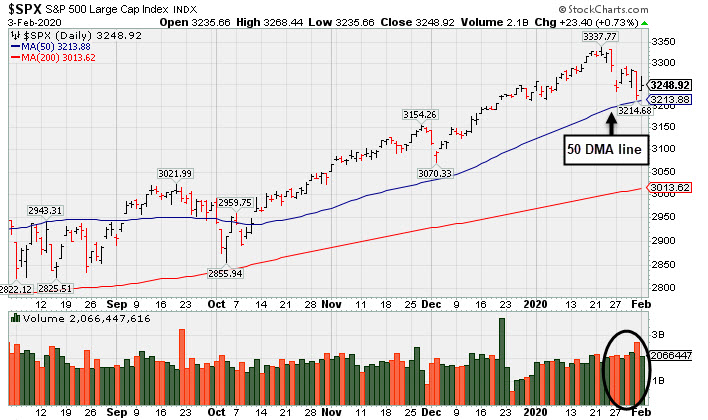
PICTURED: The S&P 500 Index is consolidating above its 50-day moving average (DMA) line. Recent losses on higher volume were indicative of distributional pressure or increased selling from the institutional crowd.
A positive manufacturing update supported risk sentiment, with the Institute for Supply Management’s (ISM) gauge showing the sector returned to expansionary territory last month for the first time since July. Separately, construction spending declined in December for the first time since June. Treasuries weakened, with the yield on the 10-year note up one basis point to 1.52%. In commodities, WTI crude slid 2.9% to $50.03/barrel, its lowest point in more than a year. Talks of OPEC+ supply curbs were overshadowed by worries that the coronavirus could limit Chinese oil consumption.
Eight of 11 S&P 500 sectors closed in positive territory, with Energy shares lagging the most. Materials led advancers, while Technology and Communication Services stocks also outperformed. In earnings, Sysco Corp. (SYY -6.65%) fell after the food distributor’s quarterly sales fell short of analyst estimates. In other corporate news, Tesla (TSLA +19.89%) spiked further into record high territory, its largest one-day advance since May 2013 following an analyst upgrade. Gilead Sciences (GILD +5.00%) rose on news its experimental drug would be tested on a small group of coronavirus patients.
Concerns about the coronavirus and its potentially negative impact on global growth sent U.S. stocks tumbling on Friday, ending January on a downbeat note. The S&P 500 posted its worst session since October and its first back-to-back weekly decline of at least 1% since late August. |
 Kenneth J. Gruneisen started out as a licensed stockbroker in August 1987, a couple of months prior to the historic stock market crash that took the Dow Jones Industrial Average down -22.6% in a single day. He has published daily fact-based fundamental and technical analysis on high-ranked stocks online for two decades. Through FACTBASEDINVESTING.COM, Kenneth provides educational articles, news, market commentary, and other information regarding proven investment systems that work in good times and bad.
Comments contained in the body of this report are technical opinions only and are not necessarily those of Gruneisen Growth Corp. The material herein has been obtained from sources believed to be reliable and accurate, however, its accuracy and completeness cannot be guaranteed. Our firm, employees, and customers may effect transactions, including transactions contrary to any recommendation herein, or have positions in the securities mentioned herein or options with respect thereto. Any recommendation contained in this report may not be suitable for all investors and it is not to be deemed an offer or solicitation on our part with respect to the purchase or sale of any securities. |
|
 |
Tech, Financial, and Retail Indexes Rose,
Kenneth J. Gruneisen - Passed the CAN SLIM® Master's Exam
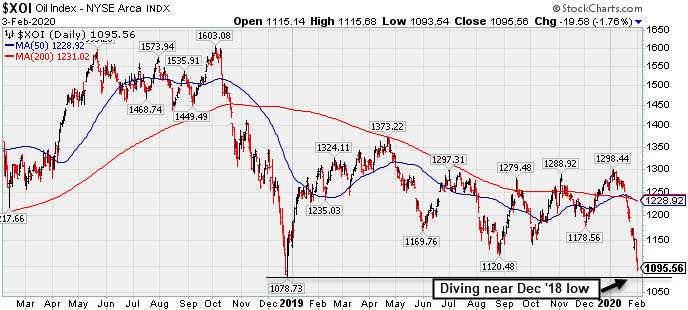
The Broker/Dealer Index ($XBD +0.82%) and Bank Index ($BKX -+0.90%) both outpaced the Retail Index ($RLX +0.43%). The Semiconductor Index ($SOX +1.24%), Networking Index ($NWX +0.80%), and the Biotech Index ($BTK +1.33%) posted unanimous gains. Energy-linked groups were mixed as the Oil Services Index ($OSX +0.71%) rose and Integrated Oil Index ($XOI -1.76%) slumped. The Gold & Silver Index ($XAU -0.94%) also fell.
PICTURED: The Integrated Oil Index ($XOI -1.76%) is diving near its Dec 2018 low.
| Oil Services |
$OSX |
63.11 |
+0.45 |
+0.72% |
-19.39% |
| Integrated Oil |
$XOI |
1,095.56 |
-19.58 |
-1.76% |
-13.77% |
| Semiconductor |
$SOX |
1,812.18 |
+22.25 |
+1.24% |
-2.02% |
| Networking |
$NWX |
557.62 |
+4.41 |
+0.80% |
-4.42% |
| Broker/Dealer |
$XBD |
292.65 |
+2.39 |
+0.82% |
+0.78% |
| Retail |
$RLX |
2,517.08 |
+10.76 |
+0.43% |
+2.77% |
| Gold & Silver |
$XAU |
102.96 |
-0.98 |
-0.94% |
-3.70% |
| Bank |
$BKX |
105.69 |
+0.94 |
+0.90% |
-6.77% |
| Biotech |
$BTK |
4,894.39 |
+64.12 |
+1.33% |
-3.42% |
|
|
|
 |
Perched Near High Finding Support at 50-Day Average
Kenneth J. Gruneisen - Passed the CAN SLIM® Master's Exam
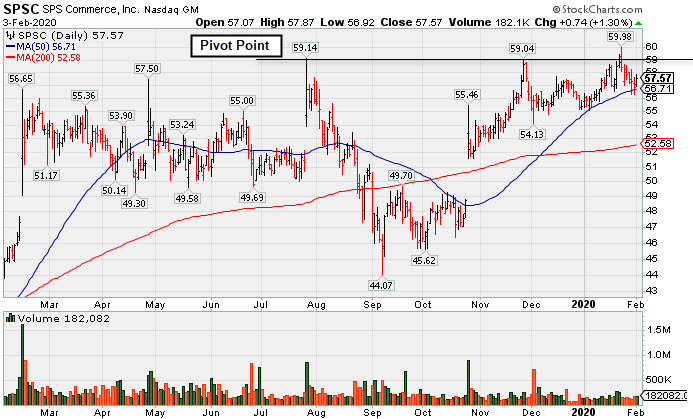
S P S Commerce Inc (SPSC +$0.74 or +1.30% to $57.57) posted a solid gain today after finding support near its 50-day moving average (DMA) line ($56.71). It remains perched near its all-time high. Subsequent gains above its pivot point backed by at least +40% above average volume are needed to trigger a new technical buy signal. Fundamentals remain strong. Its current Relative Strength Rating of 77 is below the 80+ minimum guideline for buy candidates.
SPSC is perched only -4% off its all-time high. The high-ranked Computer Software firm was highlighted in yellow with new pivot point cited based on its 7/26/19 high plus 10 cents in the 11/29/19 mid-day report (read here). It was last shown in this FSU section on 1/13/20 with an annotated graph under the headline, "Still Lingering Below Prior Resistance".
A 2:1 split impacted share price on 8/23/19 when it was dropped from the Featured Stocks list. It reported earnings +27% on +13% sales revenues for the Sep '19 quarter, and 3 of the past 4 quarterly comparisons were above the +25% minimum earnings guideline (C criteria). A small downturn in FY '16 earnings was previously noted as a flaw in its annual earnings (A criteria) history.
The number of top-rated funds owning its shares rose from 238 in Mar '18 to 484 in Dec '19, a reassuring sign concerning the I criteria. Its current Up/Down Volume Ratio of 1.1 is an unbiased indication its shares have been slight under accumulation over the past 50 days. It has a Timeliness Rating of A and Sponsorship Rating of D. The small supply of 34.8 million shares outstanding (S criteria) can contribute to greater price volatility in the even of institutional buying or selling.
Charts courtesy of www.stockcharts.com
 |
|
|
Color Codes Explained :
Y - Better candidates highlighted by our
staff of experts.
G - Previously featured
in past reports as yellow but may no longer be buyable under the
guidelines.
***Last / Change / Volume data in this table is the closing quote data***
Symbol/Exchange
Company Name
Industry Group |
PRICE |
CHANGE
(%Change) |
Day High |
Volume
(% DAV)
(% 50 day avg vol) |
52 Wk Hi
% From Hi |
Featured
Date |
Price
Featured |
Pivot Featured |
|
Max Buy |
 FTNT
-
NASDAQ
FTNT
-
NASDAQ
Fortinet Inc
Computer Sftwr-Security
|
$116.49
|
+1.13
0.98% |
$117.48
|
833,558
73.90% of 50 DAV
50 DAV is 1,128,000
|
$120.44
-3.28%
|
12/9/2019
|
$103.85
|
PP = $106.10
|
|
MB = $111.41
|
Most Recent Note - 1/31/2020 5:44:33 PM
G - Down today with heavier volume, retreating from its all-time high. Very extended from any sound base. Its 50 DMA line ($109.77) defines important near-term support to watch.
>>> FEATURED STOCK ARTICLE : Extended From Base After Wedging Higher - 1/14/2020 |
View all notes |
Set NEW NOTE alert |
Company Profile |
SEC
News |
Chart |
Request a new note
C
A
S
I |
SPSC
-
NASDAQ
S P S Commerce Inc
COMPUTER SOFTWARE and SERVICES - Application Software
|
$57.57
|
+0.74
1.30% |
$57.87
|
182,082
1,028.71% of 50 DAV
50 DAV is 17,700
|
$59.98
-4.02%
|
11/29/2019
|
$56.59
|
PP = $59.24
|
|
MB = $62.20
|
 Most Recent Note - 2/3/2020 5:12:35 PM
Y - Found support near its 50 DMA line ($56.71) today after 6 consecutive small losses. Still perched near its all-time high. Subsequent gains above its pivot point backed by at least +40% above average volume are needed to trigger a new technical buy signal. Fundamentals remain strong. Its current Relative Strength Rating of 77 is below the 80+ minimum guideline for buy candidates. See the latest FSU analysis for more details and a new annotated graph.
>>> FEATURED STOCK ARTICLE : Perched Near High Finding Support at 50-Day Average - 2/3/2020 |
View all notes |
Set NEW NOTE alert |
Company Profile |
SEC
News |
Chart |
Request a new note
C
A
S
I |
AUDC
-
NASDAQ
Audiocodes Ltd
ELECTRONICS - Scientific and Technical Instrum
|
$21.13
|
-0.31
-1.45% |
$21.30
|
1,219,860
401.27% of 50 DAV
50 DAV is 304,000
|
$28.73
-26.45%
|
9/13/2019
|
$19.68
|
PP = $19.84
|
|
MB = $20.83
|
Most Recent Note - 1/31/2020 5:42:20 PM
G - Suffered another volume-driven loss today. A subsequent rebound above its 50 DMA line ($25.07) is needed for its outlook to improve after damaging volume-driven losses triggered technical sell signals. Fundamentals remain strong.
>>> FEATURED STOCK ARTICLE : Showed Resilience With Close in Upper Third of Intra-day Range - 1/27/2020 |
View all notes |
Set NEW NOTE alert |
Company Profile |
SEC
News |
Chart |
Request a new note
C
A
S
I |
CHDN
-
NASDAQ
Churchill Downs Inc
LEISURE - Gaming Activities
|
$148.56
|
+4.18
2.90% |
$149.27
|
242,658
111.31% of 50 DAV
50 DAV is 218,000
|
$146.90
1.13%
|
10/8/2019
|
$129.77
|
PP = $132.83
|
|
MB = $139.47
|
Most Recent Note - 1/27/2020 5:28:35 PM
G - Stubbornly holding its ground near its 52-week high following recent gains with light volume. Its 50 DMA line ($134) defines near-term support above the prior low ($132.55 on 1/03/19) The Jun and Sep '19 quarterly earnings versus the year ago periods were both below the +25% minimum guideline (C criteria) and raised fundamental concerns.
>>> FEATURED STOCK ARTICLE : Reversal From High Following 5 Gains With Light Volume - 1/21/2020 |
View all notes |
Set NEW NOTE alert |
Company Profile |
SEC
News |
Chart |
Request a new note
C
A
S
I |
LULU
-
NASDAQ
Lululemon Athletica
MANUFACTURING - Textile Manufacturing
|
$246.37
|
+6.98
2.92% |
$247.70
|
1,767,299
92.09% of 50 DAV
50 DAV is 1,919,000
|
$247.51
-0.46%
|
9/6/2019
|
$201.25
|
PP = $194.35
|
|
MB = $204.07
|
Most Recent Note - 1/30/2020 5:36:36 PM
G - Extended from any sound base and hovering near its all-time high with volume totals cooling. Its 50 DMA line ($231) and prior low ($218.18 on 12/12/19) define important near-term support to watch. Fundamentals remain strong. See the latest FSU analysis for more details and a new annotated graph.
>>> FEATURED STOCK ARTICLE : Volume Totals Cooling While Hovering Near All-Time High - 1/30/2020 |
View all notes |
Set NEW NOTE alert |
Company Profile |
SEC
News |
Chart |
Request a new note
C
A
S
I |
Symbol/Exchange
Company Name
Industry Group |
PRICE |
CHANGE
(%Change) |
Day High |
Volume
(% DAV)
(% 50 day avg vol) |
52 Wk Hi
% From Hi |
Featured
Date |
Price
Featured |
Pivot Featured |
|
Max Buy |
CPRT
-
NASDAQ
Copart Inc
SPECIALTY RETAIL - Auto Dealerships
|
$100.80
|
-0.66
-0.65% |
$103.31
|
1,326,922
73.47% of 50 DAV
50 DAV is 1,806,000
|
$104.00
-3.08%
|
1/2/2020
|
$92.80
|
PP = $92.51
|
|
MB = $97.14
|
Most Recent Note - 1/28/2020 5:47:24 PM
G - Quietly touched a new all-time high today. Color code was changed to green after wedging above its "max buy" level with gains marked by below average volume. Its 50 DMA line ($91.64) defines near-term support coinciding with prior highs in the $91-92 area. Fundamentals remain strong. See the latest FSU analysis for more details and a new annotated graph.
>>> FEATURED STOCK ARTICLE : New High With Yet Another Gain Backed by Light Volume - 1/28/2020 |
View all notes |
Set NEW NOTE alert |
Company Profile |
SEC
News |
Chart |
Request a new note
C
A
S
I |
NMIH
-
NASDAQ
N M I Holdings Inc Cl A
Finance-MrtgandRel Svc
|
$32.79
|
+0.87
2.73% |
$32.99
|
431,626
88.27% of 50 DAV
50 DAV is 489,000
|
$35.79
-8.38%
|
11/8/2019
|
$32.89
|
PP = $31.44
|
|
MB = $33.01
|
Most Recent Note - 1/31/2020 5:40:39 PM
G - Still sputtering and a rebound above the 50 DMA line ($33.07) is needed for its outlook to improve. Testing prior highs in the $31 area which are the next important near-term support line. Fundamentals remain strong. See the latest FSU analysis for more details and a new annotated graph.
>>> FEATURED STOCK ARTICLE : Sputtering Below 50-Day Moving Average Line Hurts Outlook - 1/31/2020 |
View all notes |
Set NEW NOTE alert |
Company Profile |
SEC
News |
Chart |
Request a new note
C
A
S
I |
SPLK
-
NASDAQ
Splunk Inc
Computer Sftwr-Database
|
$159.88
|
+4.62
2.98% |
$160.33
|
1,281,474
65.02% of 50 DAV
50 DAV is 1,971,000
|
$161.49
-1.00%
|
11/25/2019
|
$147.79
|
PP = $142.16
|
|
MB = $149.27
|
Most Recent Note - 2/3/2020 5:11:13 PM
G - Posted a solid gain today with light volume for its second best ever close. Volume totals have been cooling while consolidating and it is extended from the previously noted base. Its 50 DMA line ($150.68) and prior highs in the $142-143 area define important support to watch on pullbacks.
>>> FEATURED STOCK ARTICLE : Volume Totals Cooling While Hovering Near All-Time High - 1/29/2020 |
View all notes |
Set NEW NOTE alert |
Company Profile |
SEC
News |
Chart |
Request a new note
C
A
S
I |
PAYC
-
NYSE
Paycom Software Inc
COMPUTER SOFTWARE and SERVICES - Application Software
|
$323.47
|
+5.31
1.67% |
$325.38
|
915,969
113.50% of 50 DAV
50 DAV is 807,000
|
$325.76
-0.70%
|
11/20/2019
|
$252.97
|
PP = $259.81
|
|
MB = $272.80
|
Most Recent Note - 1/27/2020 12:33:57 PM
G - Gapped up on 1/23/20 hitting a new all-time high, and it has been stubbornly holding its ground after getting extended from any sound base. Its prior high ($279.95 on 11/27/19) and its 50 DMA line ($271) define important near-term support levels to watch. Fundamentals remain strong.
>>> FEATURED STOCK ARTICLE : Gapped Up for New High But Ended Near Session Low - 1/23/2020 |
View all notes |
Set NEW NOTE alert |
Company Profile |
SEC
News |
Chart |
Request a new note
C
A
S
I |
BLD
-
NYSE
Topbuild Corp
Bldg-Constr Prds/Misc
|
$113.52
|
-0.99
-0.86% |
$115.42
|
225,114
80.69% of 50 DAV
50 DAV is 279,000
|
$119.99
-5.39%
|
12/9/2019
|
$109.71
|
PP = $113.84
|
|
MB = $119.53
|
Most Recent Note - 1/31/2020 5:43:24 PM
Y - Consolidating near its 52-week high following volume-driven gains. Prior high ($113.74) defines near-term support above its 50 DMA line ($108.33).
>>> FEATURED STOCK ARTICLE : Fifth Consecutive Gain Leaves TopBuild Near 52-Week High - 1/17/2020 |
View all notes |
Set NEW NOTE alert |
Company Profile |
SEC
News |
Chart |
Request a new note
C
A
S
I |
Symbol/Exchange
Company Name
Industry Group |
PRICE |
CHANGE
(%Change) |
Day High |
Volume
(% DAV)
(% 50 day avg vol) |
52 Wk Hi
% From Hi |
Featured
Date |
Price
Featured |
Pivot Featured |
|
Max Buy |
TEAM
-
NASDAQ
Atlassian Corp Plc Cl A
Comp Sftwr-Spec Enterprs
|
$149.40
|
+2.40
1.63% |
$149.48
|
909,972
59.28% of 50 DAV
50 DAV is 1,535,000
|
$151.87
-1.63%
|
1/24/2020
|
$144.66
|
PP = $140.49
|
|
MB = $147.51
|
Most Recent Note - 1/28/2020 12:50:26 PM
Y - Poised for a best-ever close with today's early gain. Gapped up and touched a new all-time high on the prior session, rising from a cup-with-handle base pattern with volume +514% above average behind the considerable gain triggering a technical buy signal. Bullish action came after it reported earnings +48% on +37% sales revenues for the Dec '19 quarter. Fundamentals remained strong while it went through a deep consolidation below its 200 DMA line since dropped from the Featured Stocks list on 9/09/19.
>>> FEATURED STOCK ARTICLE : Gapped Up Today Following Another Strong Earnings Report - 1/24/2020 |
View all notes |
Set NEW NOTE alert |
Company Profile |
SEC
News |
Chart |
Request a new note
C
A
S
I |
GLOB
-
NYSE
Globant SA
Computer-Tech Services
|
$124.48
|
+1.78
1.45% |
$124.85
|
215,257
77.71% of 50 DAV
50 DAV is 277,000
|
$131.00
-4.98%
|
11/14/2019
|
$106.87
|
PP = $112.43
|
|
MB = $118.05
|
Most Recent Note - 1/31/2020 5:46:09 PM
G - Pulling back this week after wedging to new highs with recent gains lacking great volume conviction. Its prior high ($112.33) and 50 DMA line ($109.36) define important near-term support to watch. Fundamentals remain strong.
>>> FEATURED STOCK ARTICLE : Gain for New High Today Backed by Only +12% Above Average Volume - 1/15/2020 |
View all notes |
Set NEW NOTE alert |
Company Profile |
SEC
News |
Chart |
Request a new note
C
A
S
I |
STNE
-
NASDAQ
Stoneco Ltd Cl A
Finance-CrdtCard/PmtPr
|
$45.30
|
+1.86
4.28% |
$45.72
|
1,893,786
94.03% of 50 DAV
50 DAV is 2,014,000
|
$45.62
-0.70%
|
1/22/2020
|
$43.94
|
PP = $45.72
|
|
MB = $48.01
|
Most Recent Note - 2/3/2020 5:14:28 PM
Y - Touched a new all-time high with today's big gain backed by near average volume. its 50 DMA line ($40.44) defines near-term support. Subsequent gains above the pivot point backed by at least +40% above average volume are needed to trigger a proper technical buy signal.
>>> FEATURED STOCK ARTICLE : Perched Near High With Best-Ever Close After Volume-Driven Gain - 1/22/2020 |
View all notes |
Set NEW NOTE alert |
Company Profile |
SEC
News |
Chart |
Request a new note
C
A
S
I |
|
|
|
THESE ARE NOT BUY RECOMMENDATIONS!
Comments contained in the body of this report are technical
opinions only. The material herein has been obtained
from sources believed to be reliable and accurate, however,
its accuracy and completeness cannot be guaranteed.
This site is not an investment advisor, hence it does
not endorse or recommend any securities or other investments.
Any recommendation contained in this report may not
be suitable for all investors and it is not to be deemed
an offer or solicitation on our part with respect to
the purchase or sale of any securities. All trademarks,
service marks and trade names appearing in this report
are the property of their respective owners, and are
likewise used for identification purposes only.
This report is a service available
only to active Paid Premium Members.
You may opt-out of receiving report notifications
at any time. Questions or comments may be submitted
by writing to Premium Membership Services 665 S.E. 10 Street, Suite 201 Deerfield Beach, FL 33441-5634 or by calling 1-800-965-8307
or 954-785-1121.
|
|
|