You are not logged in.
This means you
CAN ONLY VIEW reports that were published prior to Wednesday, February 19, 2025.
You
MUST UPGRADE YOUR MEMBERSHIP if you want to see any current reports.
AFTER MARKET UPDATE - WEDNESDAY, FEBRUARY 3RD, 2016
Previous After Market Report Next After Market Report >>>
|
|
|
|
DOW |
+183.12 |
16,336.66 |
+1.13% |
|
Volume |
1,156,178,010 |
+11% |
|
Volume |
2,259,978,170 |
+13% |
|
NASDAQ |
-12.71 |
4,504.24 |
-0.28% |
|
Advancers |
1,929 |
64% |
|
Advancers |
1,459 |
48% |
|
S&P 500 |
+9.50 |
1,912.53 |
+0.50% |
|
Decliners |
1,103 |
36% |
|
Decliners |
1,573 |
52% |
|
Russell 2000 |
+1.46 |
1,010.30 |
+0.14% |
|
52 Wk Highs |
85 |
|
|
52 Wk Highs |
23 |
|
|
S&P 600 |
+1.52 |
616.69 |
+0.25% |
|
52 Wk Lows |
227 |
|
|
52 Wk Lows |
251 |
|
|
 |
Major Indices Put Up Mixed Performance
Kenneth J. Gruneisen - Passed the CAN SLIM® Master's Exam
Stocks were mostly higher on Wednesday. The Dow gained 183 points to 16336. The S&P 500 added 9 points to 1912. The Nasdaq Composite fell 12 points to 4504. Volume totals were higher than the prior session totals on the NYSE and on the Nasdaq exchange. Breadth was positive as advancers led decliners by nearly a 2-1 margin on the NYSE, but decliners narrowly led advancers on the Nasdaq exchange. There were 16 high-ranked companies from the Leaders List that made new 52-week highs and were listed on the BreakOuts Page, up from 12 on the prior session. However, the total number of new 52-week lows swelled again and outnumbered new highs on the NYSE and on the Nasdaq exchange. The Featured Stocks Page includes new noteworthy leaders only as the tone of the market dictates.Charts used courtesy of www.stockcharts.com
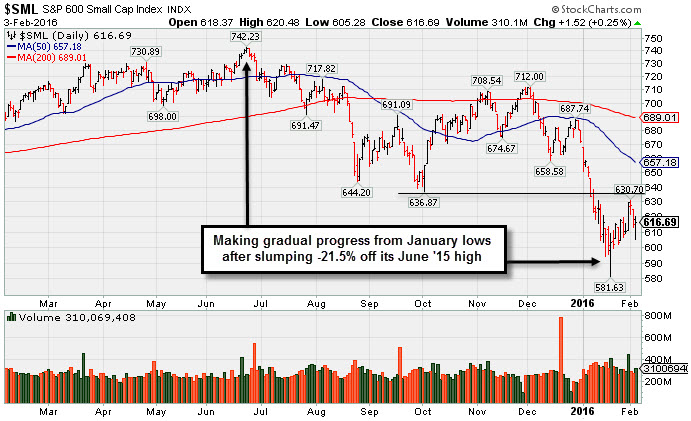
 PICTURED: The S&P 600 Small Cap Index has been making gradual progress from January lows after slumping -21.5% off its record Jun '15 high. Few leaders have bullish patterns or have managed technical breakouts of late. Patience and strict discipline remain paramount. Leadership (defined as stocks hitting new highs) improved meaningfully on Friday, a reassuring sign after recent action from the major averages (M criteria) was labeled a new "confirmed uptrend" by the newspaper. The major averages staged an afternoon rally as crude prices spiked and the
dollar tumbled. On the data front, December’s ISM reading on the services sector
came in at 53.5, well below consensus estimates of 55.1. It was the weakest
reading for the gauge since February 2014. Before the open, ADP said companies
added 205,000 workers in January, above a projected 195,000 increase.
In earnings news, the new General Motors (GM -2.5%) fell despite quarterly
results topping analyst expectations. Comcast (CMCSA +6.0%) rose after
revenues exceeded consensus projections. Gilead (GILD +4.5%) rose as
earnings topped Wall Street estimates by 11%. Mondelez (MDLZ -6.5%) fell on
disappointing operating margins and 2016 guidance.
Six out of ten sectors in the S&P 500 finished higher on the session.
Energy and materials shares each advanced more than 3% to pace the gains while
tech stocks lagged.
Treasuries dipped lower with the curve steepening. The benchmark 10-year note
lost 10/32 to yield 1.88%. In commodities, NYMEX WTI crude surged 8.4% to
$32.39/barrel after plunging 11% in the prior two sessions. COMEX gold gained
1.2% to $1141.30/ounce. In FOREX, the Dollar index sank the 1.7% against major
currencies, the most in seven years. The Featured Stocks Page includes most current notes with headline links for access to more detailed letter-by-letter analysis including price/volume graphs annotated by our experts. See the Premium Member Homepage for archives to all prior pay reports.
|
 Kenneth J. Gruneisen started out as a licensed stockbroker in August 1987, a couple of months prior to the historic stock market crash that took the Dow Jones Industrial Average down -22.6% in a single day. He has published daily fact-based fundamental and technical analysis on high-ranked stocks online for two decades. Through FACTBASEDINVESTING.COM, Kenneth provides educational articles, news, market commentary, and other information regarding proven investment systems that work in good times and bad.
Comments contained in the body of this report are technical opinions only and are not necessarily those of Gruneisen Growth Corp. The material herein has been obtained from sources believed to be reliable and accurate, however, its accuracy and completeness cannot be guaranteed. Our firm, employees, and customers may effect transactions, including transactions contrary to any recommendation herein, or have positions in the securities mentioned herein or options with respect thereto. Any recommendation contained in this report may not be suitable for all investors and it is not to be deemed an offer or solicitation on our part with respect to the purchase or sale of any securities. |
|
 |
Commodity-Linked Groups and Techs Posted Gains
Kenneth J. Gruneisen - Passed the CAN SLIM® Master's Exam
Financial shares were mixed as the Broker/Dealer Index ($XBD -0.60%) fell and the Bank Index ($BKX+0.21%) edged higher. The Retail Index ($RLX-2.07%) again had a negative influence on the major averages on Wednesday. The tech sector saw unanimous gains from the Biotechnology Index ($BTK +0.84%), Networking Index ($NWX +1.02%), and the Semiconductor Index ($SOX +0.24%). The Gold & Silver Index ($XAU +8.16%) was a standout gainer and energy-linked groups bounced back as the Oil Services Index ($OSX +2.21%) and the Integrated Oil Index ($XOI +3.00%) both rose.Charts courtesy www.stockcharts.com

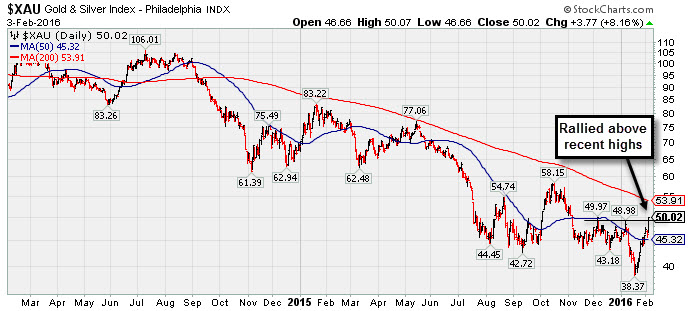
PICTURED: The Gold & Silver Index ($XAU +8.16%) posted a standout gain and rallied above its recent highs. This 2-year chart illustrates only the most recent part of the deterioration from its December 2010 record $226.58 high, from which it had fallen -83% at its January 2016 low.
| Oil Services |
$OSX |
139.93 |
+3.03 |
+2.21% |
-11.29% |
| Integrated Oil |
$XOI |
988.02 |
+28.82 |
+3.00% |
-7.89% |
| Semiconductor |
$SOX |
597.11 |
+1.41 |
+0.24% |
-10.00% |
| Networking |
$NWX |
327.95 |
+3.31 |
+1.02% |
-12.76% |
| Broker/Dealer |
$XBD |
144.91 |
-0.88 |
-0.60% |
-18.63% |
| Retail |
$RLX |
1,147.89 |
-24.25 |
-2.07% |
-10.56% |
| Gold & Silver |
$XAU |
50.02 |
+3.77 |
+8.15% |
+10.42% |
| Bank |
$BKX |
61.32 |
+0.13 |
+0.21% |
-16.09% |
| Biotech |
$BTK |
2,796.82 |
+21.19 |
+0.76% |
-26.67% |
|
|
|
 |
Get Back In on the Right Foot
Kenneth J. Gruneisen - Passed the CAN SLIM® Master's Exam
To receive more details use the inquiry form to submit your request. Thank you! Asset Management Services Using the Winning Fact-Based Investment System - Inquire Now!
You can have professional help in limiting your losses and maximizing your gains in all market environments. Consider talking with an expert for personalized help in how your portfolio is managed in 2016 and beyond. Click here and indicate "Find a Broker" to get connected. *Accounts over $250,000 please. **Serious inquires only, please. |
|
|
Color Codes Explained :
Y - Better candidates highlighted by our
staff of experts.
G - Previously featured
in past reports as yellow but may no longer be buyable under the
guidelines.
***Last / Change / Volume data in this table is the closing quote data***
|
|
|
THESE ARE NOT BUY RECOMMENDATIONS!
Comments contained in the body of this report are technical
opinions only. The material herein has been obtained
from sources believed to be reliable and accurate, however,
its accuracy and completeness cannot be guaranteed.
This site is not an investment advisor, hence it does
not endorse or recommend any securities or other investments.
Any recommendation contained in this report may not
be suitable for all investors and it is not to be deemed
an offer or solicitation on our part with respect to
the purchase or sale of any securities. All trademarks,
service marks and trade names appearing in this report
are the property of their respective owners, and are
likewise used for identification purposes only.
This report is a service available
only to active Paid Premium Members.
You may opt-out of receiving report notifications
at any time. Questions or comments may be submitted
by writing to Premium Membership Services 665 S.E. 10 Street, Suite 201 Deerfield Beach, FL 33441-5634 or by calling 1-800-965-8307
or 954-785-1121.
|
|
|
