You are not logged in.
This means you
CAN ONLY VIEW reports that were published prior to Tuesday, April 1, 2025.
You
MUST UPGRADE YOUR MEMBERSHIP if you want to see any current reports.
AFTER MARKET UPDATE - TUESDAY, JANUARY 29TH, 2019
Previous After Market Report Next After Market Report >>>
|
|
|
|
DOW |
+51.74 |
24,579.96 |
+0.21% |
|
Volume |
769,395,220 |
-6% |
|
Volume |
2,061,972,980 |
-15% |
|
NASDAQ |
-57.39 |
7,028.29 |
-0.81% |
|
Advancers |
1,648 |
56% |
|
Advancers |
1,368 |
45% |
|
S&P 500 |
-3.85 |
2,640.00 |
-0.15% |
|
Decliners |
1,283 |
44% |
|
Decliners |
1,682 |
55% |
|
Russell 2000 |
-2.09 |
1,471.45 |
-0.14% |
|
52 Wk Highs |
53 |
|
|
52 Wk Highs |
34 |
|
|
S&P 600 |
+0.00 |
917.07 |
+0.00% |
|
52 Wk Lows |
17 |
|
|
52 Wk Lows |
26 |
|
|
 |
Leadership Improved as Major Indices Ended Mixed With Less Volume
Kenneth J. Gruneisen - Passed the CAN SLIM® Master's Exam
Stocks finished mixed Tuesday. The Dow gained 51 points to 24,579 while the S&P 500 eased 3 points to 2,640. The Nasdaq composite lost 57 points to 7,028. The volume totals were lighter than the prior session on the NYSE and on the Nasdaq exchange. Breadth was positive as advancers led decliners by a 4-3 margin on the NYSE but decliners led advancers by an 8-7 margin on the Nasdaq exchange. There were 19 high-ranked companies from the Leaders List that made a new 52-week high and were listed on the BreakOuts Page, versus the total of 14 on the prior session. New 52-week highs outnumbered new 52-week lows on the NYSE and on the Nasdaq exchange versus the prior session. The major indices are in a confirmed uptrend after recently noted improvements helped to signal a change in market direction (M criteria) back to a bullish stance. The Featured Stocks Page provides the most timely analysis on high-ranked leaders. Charts used courtesy of www.stockcharts.com
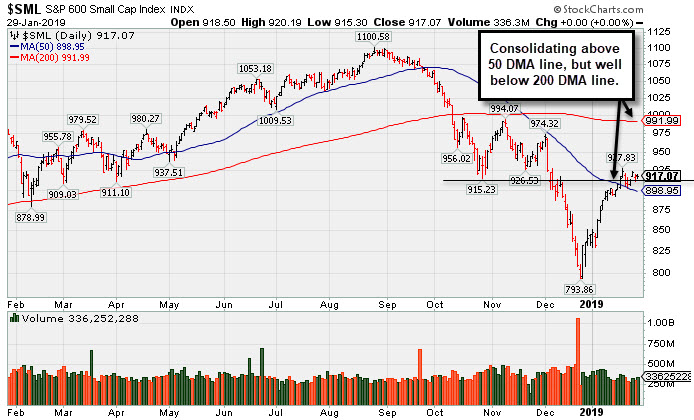
PICTURED: The S&P 600 Small Cap Index is -16.6% off its record high hit on 8/27/18. It is consolidating after having recently rebounded above its 50-day moving average (DMA) line. Long-time readers may note from that the major averages cannot be considered to be in "healthy" shape while they are below their respective 200 DMA lines.
The major averages struggled for traction as investors sorted through a flurry of corporate updates. Trade relations also remained in focus after the U.S. Department of Justice announced it had filed charges against a top executive at Chinese tech-giant Huawei. On the data front, a report from the Conference Board showed U.S. consumer confidence fell for a third consecutive month in December. An update of the S&P/Case Shiller 20-City index showed home prices rose 4.7% year-over-year in November, the slowest annual growth rate in four years.
Seven of 11 S&P 500 sectors finished in positive territory with Industrials the best performing group. Shares of 3M (MMM +1.94%) rose after topping consensus profit projections. Technology stocks underperformed as Microsoft (MSFT -2.04%) and Apple (AAPL -1.04%) fell. Communication Services also finished broadly lower as Verizon (VZ -3.25%) fell after the wireless provider missed revenue projections. In other earnings news, Allergan (AGN -8.55%) fell after the pharmaceutical company lowered its current quarter guidance.
Treasuries were stronger with the yield on the 10-year note falling three basis points to 2.71%. In commodities, NYMEX WTI crude rebounded 2.3% to $53.18/barrel. COMEX gold added 0.5% to 1,309.90/ounce. |
 Kenneth J. Gruneisen started out as a licensed stockbroker in August 1987, a couple of months prior to the historic stock market crash that took the Dow Jones Industrial Average down -22.6% in a single day. He has published daily fact-based fundamental and technical analysis on high-ranked stocks online for two decades. Through FACTBASEDINVESTING.COM, Kenneth provides educational articles, news, market commentary, and other information regarding proven investment systems that work in good times and bad.
Comments contained in the body of this report are technical opinions only and are not necessarily those of Gruneisen Growth Corp. The material herein has been obtained from sources believed to be reliable and accurate, however, its accuracy and completeness cannot be guaranteed. Our firm, employees, and customers may effect transactions, including transactions contrary to any recommendation herein, or have positions in the securities mentioned herein or options with respect thereto. Any recommendation contained in this report may not be suitable for all investors and it is not to be deemed an offer or solicitation on our part with respect to the purchase or sale of any securities. |
|
 |
Retail, Financial, and Semiconductor Indexes Fell
Kenneth J. Gruneisen - Passed the CAN SLIM® Master's Exam
The Retail Index ($RLX -1.28%) outpaced the Broker/Dealer Index ($XBD -0.39%) and the Bank Index ($BKX -0.55%) to the downside. The tech sector was led lower by the Semiconductor Index ($SOX -1.45%) while the Biotech Index ($BTK -0.22%) suffered a smaller loss and the Networking Index ($NWX +0.08%) eked out a very small gain. The Gold & Silver Index ($XAU +2.62%) was a standout gainer while the Integrated Oil Index ($XOI +0.58%) posted a small gain and the Oil Services Index ($OSX -0.11%) inched lower.
Charts courtesy of www.stockcharts.com
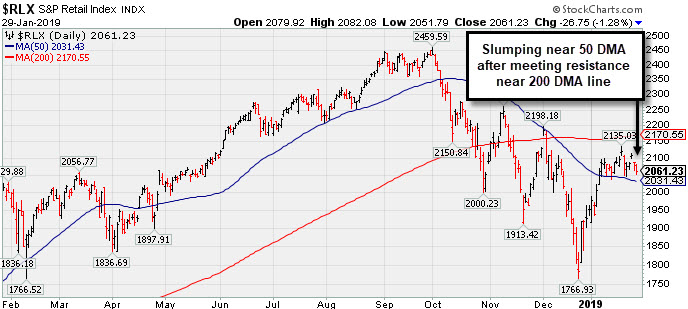 PICTURED: The Retail Index ($RLX -1.28%) met resistance at its 200-day moving average (DMA) line and is slumping near its 50 DMA line.
| Oil Services |
$OSX |
95.26 |
-0.11 |
-0.12% |
+18.19% |
| Integrated Oil |
$XOI |
1,251.25 |
+7.24 |
+0.58% |
+7.95% |
| Semiconductor |
$SOX |
1,236.25 |
-18.15 |
-1.45% |
+7.02% |
| Networking |
$NWX |
531.35 |
+0.44 |
+0.08% |
+8.73% |
| Broker/Dealer |
$XBD |
257.63 |
-1.01 |
-0.39% |
+8.55% |
| Retail |
$RLX |
2,061.23 |
-26.75 |
-1.28% |
+5.63% |
| Gold & Silver |
$XAU |
73.52 |
+1.87 |
+2.61% |
+4.05% |
| Bank |
$BKX |
97.56 |
-0.54 |
-0.55% |
+13.72% |
| Biotech |
$BTK |
4,763.17 |
-10.38 |
-0.22% |
+12.85% |
|
|
|
 |
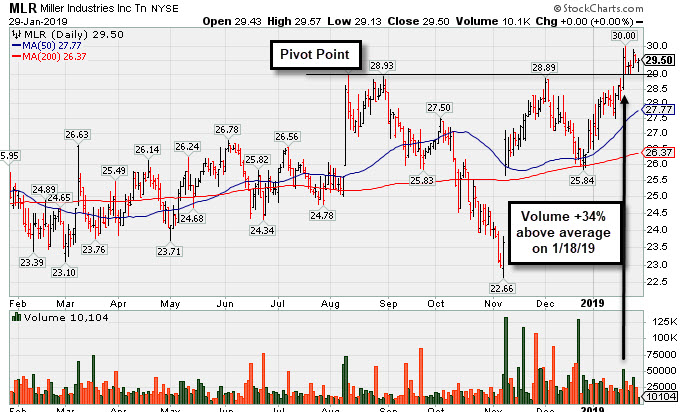
Traded Above Pivot Point Recently Without Great Volume
Kenneth J. Gruneisen - Passed the CAN SLIM® Master's Exam
Miller Industries Inc (MLR $29.50) held its ground today with light volume. No resistance remains due to overhead supply. Subsequent gains above the pivot point backed by at least +40% above average volume may help clinch a proper technical buy signal. Its 50-day moving average (DMA) line ($27.80) defines near-term support to watch on pullbacks.
Disciplined investors will note that it did not produce the gains above the pivot point backed by at least +40% above average volume needed to trigger a technical buy signal after last shown in this FSU section on 1/08/19 with an annotated graph under the headline, "Perched Within Close Striking Distance of Prior High". It encountered distributional pressure after highlighted in yellow with pivot point cited based on its 8/10/18 high plus 10 cents in the 11/30/18 mid-day report (read here).
It reported earnings +95% on +28% sales revenues for the Sep '18 quarter. Recent quarterly comparisons have been above the +25% minimum earnings guideline (C criteria) and, sequentially, showed encouraging sales revenues acceleration. Annual earnings history (A criteria) has also been good. Very small supply of only 11.4 million shares outstanding (S criteria) can contribute to greater price volatility in the event of institutional buying or selling.
The number of top-rated funds owning its shares rose from 196 in Mar '18 to 219 in Dec '18, a reassuring sign concerning the I criteria. The current Up/Down Volume Ratio of 1.2 is an unbiased indication its shares have been neutral concerning accumulation/distribution over the past 50 days. It has earned an A Timeliness rating and a C Sponsorship Rating.
Charts courtesy of www.stockcharts.com
 |
|
|
Color Codes Explained :
Y - Better candidates highlighted by our
staff of experts.
G - Previously featured
in past reports as yellow but may no longer be buyable under the
guidelines.
***Last / Change / Volume data in this table is the closing quote data***
Symbol/Exchange
Company Name
Industry Group |
PRICE |
CHANGE
(%Change) |
Day High |
Volume
(% DAV)
(% 50 day avg vol) |
52 Wk Hi
% From Hi |
Featured
Date |
Price
Featured |
Pivot Featured |
|
Max Buy |
MLR
-
NYSE
Miller Industries Inc
AUTOMOTIVE - Auto Parts
|
$29.50
|
+0.00
0.00% |
$29.57
|
10,104
27.31% of 50 DAV
50 DAV is 37,000
|
$30.00
-1.67%
|
11/30/2018
|
$28.35
|
PP = $29.50
|
|
MB = $30.98
|
 Most Recent Note - 1/29/2019 5:43:31 PM
Y - Held its ground today with light volume. Subsequent gains above the pivot point backed by at least +40% above average volume may help clinch a proper technical buy signal. Its 50 DMA line and recent low define near-term support to watch on pullbacks. See the latest FSU analysis for more details and a new annotated graph.
>>> FEATURED STOCK ARTICLE : Traded Above Pivot Point Recently Without Great Volume - 1/29/2019 |
View all notes |
Set NEW NOTE alert |
Company Profile |
SEC
News |
Chart |
Request a new note
C
A
S
I |
LHCG
-
NASDAQ
L H C Group Inc
HEALTH SERVICES - Home Health Care
|
$106.59
|
+0.95
0.90% |
$107.72
|
132,903
50.15% of 50 DAV
50 DAV is 265,000
|
$109.33
-2.51%
|
1/23/2019
|
$107.29
|
PP = $107.61
|
|
MB = $112.99
|
Most Recent Note - 1/28/2019 5:33:57 PM
Y - Pulled back for a 2nd small loss with light volume, remaining perched very near its high. Highlighted in yellow with pivot point cited based on its 11/29/18 high plus 10 cents in the 1/23/18 mid-day report after an 8-week cup shaped base. Subsequent gains above the pivot point backed by at least +40% above average volume may trigger a technical buy signal.
>>> FEATURED STOCK ARTICLE : Healthcare Services Firm Reached a New High - 1/23/2019 |
View all notes |
Set NEW NOTE alert |
Company Profile |
SEC
News |
Chart |
Request a new note
C
A
S
I |
BSTC
-
NASDAQ
Biospecifics Technologie
Medical-Biomed/Biotech
|
$64.23
|
+0.25
0.39% |
$64.69
|
37,087
92.72% of 50 DAV
50 DAV is 40,000
|
$68.00
-5.54%
|
1/18/2019
|
$67.40
|
PP = $66.31
|
|
MB = $69.63
|
Most Recent Note - 1/28/2019 5:56:47 PM
Y - Thinly traded Biomed/Biotech firm has recently been sputtering below its pivot point. Confirming volume-driven gains for a new high close would be a reassuring sign of institutional accumulation.
>>> FEATURED STOCK ARTICLE : Thinly Traded Biotech Shows Signs of Accumulation - 1/18/2019 |
View all notes |
Set NEW NOTE alert |
Company Profile |
SEC
News |
Chart |
Request a new note
C
A
S
I |
UBNT
-
NASDAQ
Ubiquiti Networks
TELECOMMUNICATIONS - Diversified Communication Serv
|
$106.23
|
-0.56
-0.52% |
$107.40
|
139,317
38.27% of 50 DAV
50 DAV is 364,000
|
$115.44
-7.98%
|
11/9/2018
|
$108.20
|
PP = $101.43
|
|
MB = $106.50
|
Most Recent Note - 1/28/2019 5:59:36 PM
G - Still quietly consolidating above its 50 DMA line ($105.18). Faces some resistance due to overhead supply up to the $115 level. Prior low ($92.08 on 12/24/18) defines the next important support. Fundamentals remain strong.
>>> FEATURED STOCK ARTICLE : Sputtering Below 50-Day Moving Average Again - 1/15/2019 |
View all notes |
Set NEW NOTE alert |
Company Profile |
SEC
News |
Chart |
Request a new note
C
A
S
I |
PYPL
-
NASDAQ
Paypal Holdings Inc
Finance-CrdtCard/PmtPr
|
$91.12
|
-1.18
-1.28% |
$92.85
|
6,130,004
68.04% of 50 DAV
50 DAV is 9,010,000
|
$94.58
-3.66%
|
1/24/2019
|
$92.56
|
PP = $93.80
|
|
MB = $98.49
|
Most Recent Note - 1/28/2019 1:02:58 PM
Y - Due to report earnings news on 1/30/19. Volume and volatility often increase near earnings news. Pulling back today after wedging to a new all-time high last week. Highlighted in yellow with new pivot point cited based on its 9/13/18 high plus 10 cents. Subsequent gains above the pivot point backed by at least +40% above average volume are needed to trigger a proper technical buy signal.
>>> FEATURED STOCK ARTICLE : Perched Within Striking Distance of High Ahead of Earnings News - 1/24/2019 |
View all notes |
Set NEW NOTE alert |
Company Profile |
SEC
News |
Chart |
Request a new note
C
A
S
I |
Symbol/Exchange
Company Name
Industry Group |
PRICE |
CHANGE
(%Change) |
Day High |
Volume
(% DAV)
(% 50 day avg vol) |
52 Wk Hi
% From Hi |
Featured
Date |
Price
Featured |
Pivot Featured |
|
Max Buy |
ALRM
-
NASDAQ
Alarm.com Holdings Inc
Security/Sfty
|
$62.69
|
-0.19
-0.30% |
$63.33
|
265,342
54.37% of 50 DAV
50 DAV is 488,000
|
$63.72
-1.62%
|
1/22/2019
|
$60.52
|
PP = $60.30
|
|
MB = $63.32
|
Most Recent Note - 1/29/2019 5:50:03 PM
Y - Volume was light today while staying perched at its all-time high. Recent gains for new highs lacked great volume conviction. Prior highs define initial support to watch on pullbacks.
>>> FEATURED STOCK ARTICLE : Pullback Broke Steak of Gains and Reversed From New High - 1/22/2019 |
View all notes |
Set NEW NOTE alert |
Company Profile |
SEC
News |
Chart |
Request a new note
C
A
S
I |
PLNT
-
NYSE
Planet Fitness Inc Cl A
Leisure-Services
|
$57.58
|
-0.16
-0.28% |
$58.38
|
695,004
57.15% of 50 DAV
50 DAV is 1,216,000
|
$59.52
-3.26%
|
11/7/2018
|
$57.10
|
PP = $55.45
|
|
MB = $58.22
|
Most Recent Note - 1/25/2019 5:09:15 PM
Y - Consolidating below its "max buy" level and holding its ground in a tight range near its all-time high. Its 50 DMA line ($54.69) defines important near-term support to watch above the recent low ($48). See the latest FSU analysis for more details and a new annotated graph.
>>> FEATURED STOCK ARTICLE : Hovering in a Tight Range Near All-Time High - 1/25/2019 |
View all notes |
Set NEW NOTE alert |
Company Profile |
SEC
News |
Chart |
Request a new note
C
A
S
I |
TEAM
-
NASDAQ
Atlassian Corp Plc Cl A
Comp Sftwr-Spec Enterprs
|
$93.22
|
-1.50
-1.58% |
$94.80
|
948,256
55.91% of 50 DAV
50 DAV is 1,696,000
|
$100.00
-6.78%
|
1/7/2019
|
$94.68
|
PP = $98.31
|
|
MB = $103.23
|
Most Recent Note - 1/29/2019 5:46:38 PM
Y - Volume totals have been drying up while hovering near its high. Reported earnings +92% on +39% sales revenues for the Dec '18 quarter. Subsequent gains and a strong close above the pivot point backed by at least +40% above average volume may help to clinch a convincing technical buy signal. Its 50 DMA line ($85.29) and prior low define near-term support to watch on pullbacks. See the latest FSU analysis for more details and an annotated graph.
>>> FEATURED STOCK ARTICLE : Volume Light While Hovering Near High - 1/28/2019 |
View all notes |
Set NEW NOTE alert |
Company Profile |
SEC
News |
Chart |
Request a new note
C
A
S
I |
INVA
-
NASDAQ
Innoviva Inc
Medical-Biomed/Biotech
|
$20.06
|
+0.38
1.93% |
$20.24
|
885,887
84.77% of 50 DAV
50 DAV is 1,045,000
|
$19.96
0.50%
|
11/23/2018
|
$17.74
|
PP = $18.09
|
|
MB = $18.99
|
Most Recent Note - 1/29/2019 5:45:10 PM
G - Posted a gain with below average volume for another new 52-week high. The prior high ($18.60 on 12/03/18) defines initial support above its 50 DMA line ($17.85).
>>> FEATURED STOCK ARTICLE : Perched at High Following Volume-Driven Gains - 1/17/2019 |
View all notes |
Set NEW NOTE alert |
Company Profile |
SEC
News |
Chart |
Request a new note
C
A
S
I |
|
|
|
THESE ARE NOT BUY RECOMMENDATIONS!
Comments contained in the body of this report are technical
opinions only. The material herein has been obtained
from sources believed to be reliable and accurate, however,
its accuracy and completeness cannot be guaranteed.
This site is not an investment advisor, hence it does
not endorse or recommend any securities or other investments.
Any recommendation contained in this report may not
be suitable for all investors and it is not to be deemed
an offer or solicitation on our part with respect to
the purchase or sale of any securities. All trademarks,
service marks and trade names appearing in this report
are the property of their respective owners, and are
likewise used for identification purposes only.
This report is a service available
only to active Paid Premium Members.
You may opt-out of receiving report notifications
at any time. Questions or comments may be submitted
by writing to Premium Membership Services 665 S.E. 10 Street, Suite 201 Deerfield Beach, FL 33441-5634 or by calling 1-800-965-8307
or 954-785-1121.
|
|
|

