***Last / Change / Volume data in this table is the closing quote data***
Symbol/Exchange
Company Name
Industry Group |
PRICE |
CHANGE
(%Change) |
Day High |
Volume
(% DAV)
(% 50 day avg vol) |
52 Wk Hi
% From Hi |
Featured
Date |
Price
Featured |
Pivot Featured |
|
Max Buy |
ARMH
-
NASDAQ
A R M Holdings Plc Ads
ELECTRONICS - Semiconductor - Specialized
|
$48.27
|
-0.52
-1.07% |
$48.95
|
5,119,945
324.11% of 50 DAV
50 DAV is 1,579,700
|
$55.26
-12.65%
|
12/23/2013
|
$54.59
|
PP = $52.48
|
|
MB = $55.10
|
 Most Recent Note - 1/10/2014 6:04:33 PM
G - Down again today with heavier volume and color code was changed to green after undercutting prior highs and violating support at its 50 DMA line triggering technical sell signals. Disciplined investors always limit losses by selling any stock that falls more than -7% from their purchase price.
>>> FEATURED STOCK ARTICLE : No Overhead Supply Remains Following Volume-Driven Breakout - 12/23/2013
View all notes |
Set NEW NOTE alert |
CANSLIM.net Company Profile |
SEC
News |
Chart |
Request a new note
C
A N
S L
I M


|
BITA
-
NYSE
Bitauto Hldgs Ltd Ads
INTERNET - Internet Information Providers
|
$36.44
|
+2.03
5.90% |
$36.50
|
1,317,577
100.99% of 50 DAV
50 DAV is 1,304,700
|
$36.10
0.94%
|
1/8/2014
|
$33.00
|
PP = $35.14
|
|
MB = $36.90
|
Most Recent Note - 1/10/2014 5:57:59 PM
Y - Hit a new high and finished strong with today's gain on only average volume. Gains above a stock's pivot point should have at least +40% above average volume to trigger a proper technical buy signal. Highlighted in yellow with new pivot point cited based on its 11/25/13 high plus 10 cents in the 1/08/14 mid-day report (read here) while noted with caution - "Subsequent volume-driven gains to new highs may trigger a new technical buy signal. Found support above its 50 DMA line during its consolidation since completing a Public Offering on 12/06/13. Faces little overhead supply to act as resistance A 50 DMA line violation would be a more worrisome technical sell signal. See the latest FSU analysis for more details and new annotated graphs."
>>> FEATURED STOCK ARTICLE : Finished Strong and Challenged Pivot Point After Highlighted in Mid-Day Report - 1/8/2014
View all notes |
Set NEW NOTE alert |
CANSLIM.net Company Profile |
SEC
News |
Chart |
Request a new note
C
A N
S L
I M
|
CELG
-
NASDAQ
Celgene Corp
DRUGS - Drug Manufacturers - Major
|
$169.81
|
+1.11
0.66% |
$169.86
|
2,784,254
104.46% of 50 DAV
50 DAV is 2,665,300
|
$173.80
-2.30%
|
9/12/2013
|
$149.50
|
PP = $150.02
|
|
MB = $157.52
|
Most Recent Note - 1/10/2014 5:58:46 PM
G - Holding its ground above its 50 DMA line which acted as support recently. Subsequent violations would raise greater concerns and trigger technical sell signals.
>>> FEATURED STOCK ARTICLE : Found Support Above 50-Day Average After Gapping Down on Prior Session - 1/7/2014
View all notes |
Set NEW NOTE alert |
CANSLIM.net Company Profile |
SEC
News |
Chart |
Request a new note
C
A N
S L
I M
|
EGOV
-
NASDAQ
N I C Inc
INTERNET - Internet Software and Services
|
$23.95
|
+0.03
0.13% |
$24.11
|
187,285
67.49% of 50 DAV
50 DAV is 277,500
|
$25.99
-7.85%
|
12/20/2013
|
$24.00
|
PP = $26.09
|
|
MB = $27.39
|
Most Recent Note - 1/10/2014 6:00:55 PM
Y - Color code is changed to yellow while showing resilience near its 50 DMA line. A subsequent violation of the recent low ($22.17 on 12/16/13) would raise concern as that level defines near-term support above its 200 DMA line.
>>> FEATURED STOCK ARTICLE : Rebounded Above 50-Day Average; Relative Strength Rating Waned - 12/27/2013
View all notes |
Set NEW NOTE alert |
CANSLIM.net Company Profile |
SEC
News |
Chart |
Request a new note
C
A N
S L
I M
|
EQM
-
NYSE
E Q T Midstream Partners
ENERGY - Oil and Gas Pipelines
|
$60.28
|
+0.24
0.40% |
$60.62
|
60,808
48.34% of 50 DAV
50 DAV is 125,800
|
$60.37
-0.16%
|
12/12/2013
|
$53.17
|
PP = $56.51
|
|
MB = $59.34
|
Most Recent Note - 1/6/2014 6:58:06 PM
G - Hit a new all-time high with today's gain above the pivot point backed by +130% above average volume triggering a technical buy signal. Color code is changed to green as it is getting extended beyond its "max buy" level.
>>> FEATURED STOCK ARTICLE : Finding Support Near 50-Day Moving Average While Perched Near Highs - 12/13/2013
View all notes |
Set NEW NOTE alert |
CANSLIM.net Company Profile |
SEC
News |
Chart |
Request a new note
C
A N
S L
I M
|
Symbol/Exchange
Company Name
Industry Group |
PRICE |
CHANGE
(%Change) |
Day High |
Volume
(% DAV)
(% 50 day avg vol) |
52 Wk Hi
% From Hi |
Featured
Date |
Price
Featured |
Pivot Featured |
|
Max Buy |
FB
-
NASDAQ
Facebook Inc Cl A
INTERNET
|
$57.94
|
+0.72
1.26% |
$58.30
|
42,450,204
56.90% of 50 DAV
50 DAV is 74,600,300
|
$58.58
-1.09%
|
12/12/2013
|
$51.40
|
PP = $54.93
|
|
MB = $57.68
|
Most Recent Note - 1/6/2014 6:54:09 PM
Y - Rallied near a best-ever close with today's gain on average volume. Found support near prior highs during its consolidation. Rallied from a 9-week cup shaped base without a handle after completing a Public Offering on 12/20/13. Disciplined investors always limit losses by selling any stock that falls more than -7% from their purchase price.
>>> FEATURED STOCK ARTICLE : Well Known Social Media Firm on Watch List While Still Base Building - 12/12/2013
View all notes |
Set NEW NOTE alert |
CANSLIM.net Company Profile |
SEC
News |
Chart |
Request a new note
C
A N
S L
I M
|
FLT
-
NYSE
Fleetcor Technologies
DIVERSIFIED SERVICES - Business/Management Services
|
$116.26
|
+0.39
0.34% |
$116.68
|
728,280
94.08% of 50 DAV
50 DAV is 774,100
|
$123.96
-6.21%
|
8/19/2013
|
$99.01
|
PP = $100.97
|
|
MB = $106.02
|
Most Recent Note - 1/9/2014 2:43:53 PM
G - Reversed into the red today, testing support near its 50 DMA line. Previously noted - "It may be forming a new late-stage base but still faces some resistance up through the $123 level."
>>> FEATURED STOCK ARTICLE : Enduring Distributional Pressure While Extended From Sound Base - 12/17/2013
View all notes |
Set NEW NOTE alert |
CANSLIM.net Company Profile |
SEC
News |
Chart |
Request a new note
C
A N
S L
I M
|
GNRC
-
NYSE
Generac Hldgs Inc
CONSUMER DURABLES - Electronic Equipment
|
$54.85
|
+0.06
0.11% |
$54.97
|
449,893
71.88% of 50 DAV
50 DAV is 625,900
|
$57.29
-4.26%
|
11/26/2013
|
$53.02
|
PP = $52.42
|
|
MB = $55.04
|
Most Recent Note - 1/8/2014 12:34:25 PM
G - Enduring mild distributional pressure while consolidating -4.0% off its all-time high. Prior highs in the $52 area define initial support to watch on pullbacks.
>>> FEATURED STOCK ARTICLE : Volume Totals Cooling While Holding Ground Near Highs - 1/2/2014
View all notes |
Set NEW NOTE alert |
CANSLIM.net Company Profile |
SEC
News |
Chart |
Request a new note
C
A N
S L
I M
|
HLF
-
NYSE
Herbalife Ltd
DRUGS - Nutrition and Weight Management
|
$81.81
|
+0.31
0.38% |
$82.49
|
2,681,175
94.54% of 50 DAV
50 DAV is 2,836,000
|
$83.51
-2.04%
|
11/22/2013
|
$72.21
|
PP = $75.04
|
|
MB = $78.79
|
Most Recent Note - 1/7/2014 4:25:04 PM
G - Rallied back above its "max buy" level and its color code is changed to green. Found support above prior highs in the $74 area during its recent consolidation. Disciplined investors always limit losses if any stock falls more than -7% from their purchase price.
>>> FEATURED STOCK ARTICLE : Volume Totals Cooling While Perched Near Highs - 12/30/2013
View all notes |
Set NEW NOTE alert |
CANSLIM.net Company Profile |
SEC
News |
Chart |
Request a new note
C
A N
S L
I M
|
JAZZ
-
NASDAQ
Jazz Pharmaceuticals Plc
DRUGS - Biotechnology
|
$138.56
|
+2.49
1.83% |
$139.22
|
521,434
71.60% of 50 DAV
50 DAV is 728,300
|
$139.26
-0.50%
|
9/30/2013
|
$93.20
|
PP = $89.10
|
|
MB = $93.56
|
Most Recent Note - 1/8/2014 12:40:50 PM
G - Hitting yet another new 52-week high with today's considerable gain, getting more extended from any sound base. Its 50 DMA line and prior low near $108 define important support to watch on pullbacks.
>>> FEATURED STOCK ARTICLE : Technically Extended Stock May Be a Dangerous Chase - 12/10/2013
View all notes |
Set NEW NOTE alert |
CANSLIM.net Company Profile |
SEC
News |
Chart |
Request a new note
C
A N
S L
I M
|
Symbol/Exchange
Company Name
Industry Group |
PRICE |
CHANGE
(%Change) |
Day High |
Volume
(% DAV)
(% 50 day avg vol) |
52 Wk Hi
% From Hi |
Featured
Date |
Price
Featured |
Pivot Featured |
|
Max Buy |
KORS
-
NYSE
Michael Kors Hldgs Ltd
RETAIL - Apparel Stores
|
$79.80
|
+1.21
1.54% |
$79.88
|
3,943,516
81.26% of 50 DAV
50 DAV is 4,853,000
|
$84.58
-5.65%
|
8/6/2013
|
$69.66
|
PP = $66.28
|
|
MB = $69.59
|
Most Recent Note - 1/9/2014 5:58:34 PM
G - Violated its 50 DMA line with damaging losses on above average volume indicating more distributional pressure. See the latest FSU analysis for more details and new annotated graphs.
>>> FEATURED STOCK ARTICLE : Technical Deterioration and RS Rating Slump Raises Concerns - 1/9/2014
View all notes |
Set NEW NOTE alert |
CANSLIM.net Company Profile |
SEC
News |
Chart |
Request a new note
C
A N
S L
I M
|
MRLN
-
NASDAQ
Marlin Business Services
DIVERSIFIED SERVICES - Rental and Leasing Services
|
$27.85
|
+0.17
0.61% |
$28.00
|
32,260
111.24% of 50 DAV
50 DAV is 29,000
|
$28.64
-2.75%
|
12/19/2013
|
$26.69
|
PP = $28.74
|
|
MB = $30.18
|
Most Recent Note - 1/9/2014 6:01:51 PM
Y - Posted a 6th consecutive gain today. Perched within close striking distance of its 52-week high with little resistance remaining due to overhead supply. Subsequent volume-driven gains above the pivot point are needed to trigger a proper new technical buy signal. Its Relative Strength (RS) Rating at 77 remains below the 80+ minimum guideline for buy candidates.
>>> FEATURED STOCK ARTICLE : Finished Weak While Enduring Distributional Pressure - 12/19/2013
View all notes |
Set NEW NOTE alert |
CANSLIM.net Company Profile |
SEC
News |
Chart |
Request a new note
C
A N
S L
I M
|
PCLN
-
NASDAQ
Priceline.Com Inc
INTERNET - Internet Software and Services
|
$1,148.84
|
-4.85
-0.42% |
$1,156.41
|
489,654
83.19% of 50 DAV
50 DAV is 588,600
|
$1,198.75
-4.16%
|
12/18/2013
|
$1,156.20
|
PP = $1,198.85
|
|
MB = $1,258.79
|
Most Recent Note - 1/6/2014 6:48:03 PM
Y - Managed a "positive reversal" today after undercutting its 50 DMA line. See the latest FSU analysis for more details and new annotated daily and weekly graphs.
>>> FEATURED STOCK ARTICLE : Managed Positive Reversal at 50-Day Moving Average Line - 1/6/2014
View all notes |
Set NEW NOTE alert |
CANSLIM.net Company Profile |
SEC
News |
Chart |
Request a new note
C
A N
S L
I M
|
RGR
-
NYSE
Sturm Ruger & Co Inc
CONSUMER DURABLES - Sporting Goods
|
$80.55
|
+0.52
0.65% |
$81.50
|
378,165
124.07% of 50 DAV
50 DAV is 304,800
|
$80.28
0.34%
|
1/8/2014
|
$78.87
|
PP = $80.38
|
|
MB = $84.40
|
Most Recent Note - 1/8/2014 1:04:39 PM
Y - Color code is changed to yellow with new pivot point cited based on its 11/21/13 high plus 10 cents. Subsequent volume-driven gains for new highs may trigger a new technical buy signal. Fundamentals remain strong with respect to the C and A criteria. Recent lows in the $70 area and its 50 DMA line define important near-term support. Perched -1.7% off its 52-week high and on the right side of an 8-week cup shaped base. Showed resilience since dropped from the Featured Stocks list on 12/18/12 as firearms-makers endured heavy selling following tragedies.

>>> FEATURED STOCK ARTICLE : Violated 50-Day Average After Damaging Losses Negated Prior Breakout - 12/14/2012
View all notes |
Set NEW NOTE alert |
CANSLIM.net Company Profile |
SEC
News |
Chart |
Request a new note
C
A N
S L
I M
|
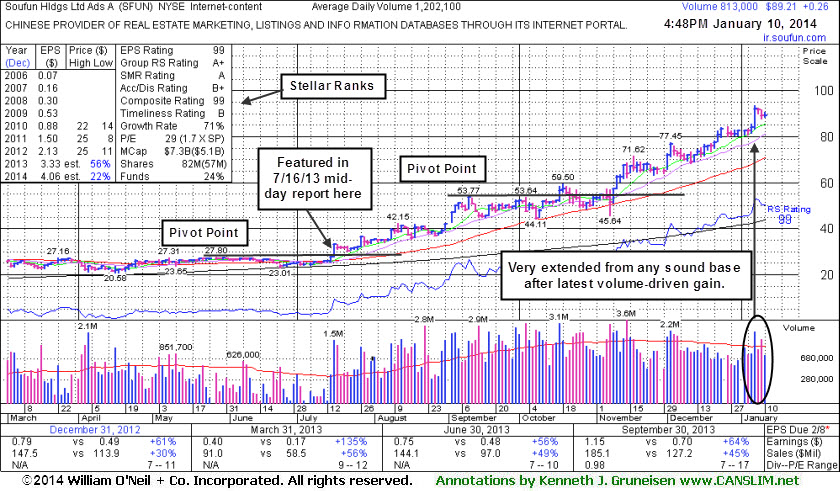
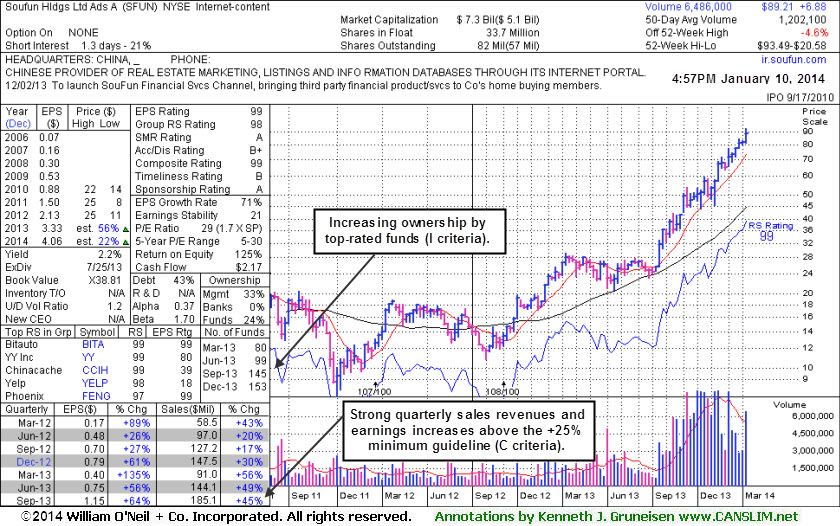
SFUN
-
NYSE
Soufun Hldgs Ltd Ads A
INTERNET - Internet Information Providers
|
$89.21
|
+0.26
0.29% |
$90.70
|
813,045
67.64% of 50 DAV
50 DAV is 1,202,100
|
$93.49
-4.58%
|
10/17/2013
|
$58.02
|
PP = $53.87
|
|
MB = $56.56
|
Most Recent Note - 1/10/2014 5:54:24 PM
G - Perched near its all-time high, extended from any sound base. See the latest FSU analysis for more details and new annotated graphs.
>>> FEATURED STOCK ARTICLE : Extended From Base Following More Volume-Driven Gains - 1/10/2014
View all notes |
Set NEW NOTE alert |
CANSLIM.net Company Profile |
SEC
News |
Chart |
Request a new note
C
A N
S L
I M
|
Symbol/Exchange
Company Name
Industry Group |
PRICE |
CHANGE
(%Change) |
Day High |
Volume
(% DAV)
(% 50 day avg vol) |
52 Wk Hi
% From Hi |
Featured
Date |
Price
Featured |
Pivot Featured |
|
Max Buy |
SILC
-
NASDAQ
Silicom Ltd
COMPUTER HARDWARE - Networking andamp; Communication Dev
|
$46.45
|
+0.07
0.14% |
$46.55
|
21,804
67.30% of 50 DAV
50 DAV is 32,400
|
$46.50
-0.12%
|
12/23/2013
|
$44.62
|
PP = $46.25
|
|
MB = $48.56
|
Most Recent Note - 1/7/2014 12:40:13 PM
Y - Touched a new 52-week high today, adding to its recent streak of small gains without especially great volume conviction. Volume should be a minimum of +40% above average behind gains above a stock's pivot point to trigger a proper technical buy signal.
>>> FEATURED STOCK ARTICLE : Stock With Small Supply Has Formed a Sound Base Pattern - 12/24/2013
View all notes |
Set NEW NOTE alert |
CANSLIM.net Company Profile |
SEC
News |
Chart |
Request a new note
C
A N
S L
I M
|
SSNC
-
NASDAQ
S S & C Technologies
COMPUTER SOFTWARE and SERVICES - Application Software
|
$45.84
|
-0.36
-0.78% |
$46.46
|
164,191
54.22% of 50 DAV
50 DAV is 302,800
|
$46.60
-1.63%
|
10/22/2013
|
$39.17
|
PP = $40.04
|
|
MB = $42.04
|
Most Recent Note - 1/8/2014 1:05:43 PM
G - Adding to its recent spurt of gains and hitting a new 52-week high today, getting more extended from any sound base. Found recent support near its 50 DMA line.
>>> FEATURED STOCK ARTICLE : Found Prompt Support After Damaging Losses Raised Concerns - 12/16/2013
View all notes |
Set NEW NOTE alert |
CANSLIM.net Company Profile |
SEC
News |
Chart |
Request a new note
C
A N
S L
I M
|
SSYS
-
NASDAQ
Stratasys Ltd
COMPUTER HARDWARE - Computer Peripherals
|
$133.65
|
+0.40
0.30% |
$134.40
|
540,536
46.55% of 50 DAV
50 DAV is 1,161,300
|
$138.10
-3.22%
|
10/11/2013
|
$102.94
|
PP = $105.38
|
|
MB = $110.65
|
Most Recent Note - 1/6/2014 12:25:38 PM
G - Retreating from its 52-week high with today's loss on higher volume indicating distributional pressure after rising without great volume conviction behind recent gains. Found recent support at its 50 DMA line. Previously noted with caution - "Reported earnings +13% on +153% sales revenues, below the +25% minimum earnings guideline (C criteria) raising fundamental concerns."
>>> FEATURED STOCK ARTICLE : Rallying From Support at 50-Day Moving Average Line - 12/20/2013
View all notes |
Set NEW NOTE alert |
CANSLIM.net Company Profile |
SEC
News |
Chart |
Request a new note
C
A N
S L
I M
|
ULTI
-
NASDAQ
Ultimate Software Group
INTERNET - Internet Software and Services
|
$151.79
|
-0.39
-0.26% |
$152.68
|
228,887
162.91% of 50 DAV
50 DAV is 140,500
|
$162.88
-6.81%
|
10/16/2013
|
$142.95
|
PP = $151.18
|
|
MB = $158.74
|
Most Recent Note - 1/9/2014 3:21:22 PM
G - Consolidating near its 50 DMA line, it reversed into the red after early gains today. Recent low ($144.04 on 12/12/13) defines the next near-term support to watch.
>>> FEATURED STOCK ARTICLE : Gain on Light Volume While Inching Above 50-Day Average - 12/26/2013
View all notes |
Set NEW NOTE alert |
CANSLIM.net Company Profile |
SEC
News |
Chart |
Request a new note
C
A N
S L
I M
|
VRX
-
NYSE
Valeant Pharmaceuticals
DRUGS - Drug Manufacturers - Other
|
$133.50
|
+1.33
1.01% |
$133.57
|
1,658,010
137.42% of 50 DAV
50 DAV is 1,206,500
|
$135.73
-1.64%
|
9/11/2013
|
$100.26
|
PP = $105.50
|
|
MB = $110.78
|
Most Recent Note - 1/8/2014 1:13:39 PM
G - Reversed much of its early gain today after gapping up for a 2nd consecutive session hitting new 52-week highs. Considerable volume-driven gains came after the company provided encouraging guidance. Its 50 DMA line and prior lows ($105.17) define near term support to watch.
>>> FEATURED STOCK ARTICLE : Rebounding With Volume Backed Gains But Fundamental Concerns Remain - 12/18/2013
View all notes |
Set NEW NOTE alert |
CANSLIM.net Company Profile |
SEC
News |
Chart |
Request a new note
C
A N
S L
I M
|
Symbol/Exchange
Company Name
Industry Group |
PRICE |
CHANGE
(%Change) |
Day High |
Volume
(% DAV)
(% 50 day avg vol) |
52 Wk Hi
% From Hi |
Featured
Date |
Price
Featured |
Pivot Featured |
|
Max Buy |
YNDX
-
NASDAQ
Yandex N V Class A
INTERNET - Internet Information Providers
|
$44.00
|
-0.22
-0.50% |
$44.44
|
3,011,739
124.33% of 50 DAV
50 DAV is 2,422,300
|
$44.24
-0.54%
|
11/27/2013
|
$39.61
|
PP = $42.10
|
|
MB = $44.21
|
Most Recent Note - 1/9/2014 12:59:15 PM
Y - Hitting new 52-week highs with today's volume-driven gain after gapping up following news a Morgan Stanley analysts raised their target price. It has already traded nearly 2 times average volume behind today's gain. Prior reports noted - "At least +40% above average volume should be behind gains above the pivot point to trigger a proper new technical buy signal."
>>> FEATURED STOCK ARTICLE : Best Ever Close With Gain on Light Volume - 12/31/2013
View all notes |
Set NEW NOTE alert |
CANSLIM.net Company Profile |
SEC
News |
Chart |
Request a new note
C
A N
S L
I M
|
YY
-
NASDAQ
YY Inc Ads
INTERNET - Internet Service Providers
|
$64.40
|
+3.44
5.64% |
$64.70
|
1,433,355
94.18% of 50 DAV
50 DAV is 1,522,000
|
$64.50
-0.16%
|
1/3/2014
|
$55.08
|
PP = $56.85
|
|
MB = $59.69
|
Most Recent Note - 1/10/2014 6:02:12 PM
G - Rallied for a new all-time high today, getting more extended from any sound base. Prior highs in the $56 area define initial support to watch on pullbacks.
>>> FEATURED STOCK ARTICLE : Finished Strong With High Volume After Featured in Mid-Day Report - 1/3/2014
View all notes |
Set NEW NOTE alert |
CANSLIM.net Company Profile |
SEC
News |
Chart |
Request a new note
C
A N
S L
I M
|