You are not logged in.
This means you
CAN ONLY VIEW reports that were published prior to Saturday, February 15, 2025.
You
MUST UPGRADE YOUR MEMBERSHIP if you want to see any current reports.
AFTER MARKET UPDATE - THURSDAY, SEPTEMBER 19TH, 2024
Previous After Market Report Next After Market Report >>>
|
|
|
|
DOW |
+522.09 |
42,025.19 |
+1.26% |
|
Volume |
1,047,004,027 |
+11% |
|
Volume |
5,584,984,900 |
-3% |
|
NASDAQ |
+440.68 |
18,013.98 |
+2.51% |
|
Advancers |
2,191 |
79% |
|
Advancers |
3,145 |
75% |
|
S&P 500 |
+95.41 |
5,713.67 |
+1.70% |
|
Decliners |
565 |
20% |
|
Decliners |
1,065 |
25% |
|
Russell 2000 |
+46.37 |
2,252.71 |
+2.10% |
|
52 Wk Highs |
417 |
|
|
52 Wk Highs |
378 |
|
|
S&P 600 |
+28.50 |
1,430.02 |
+2.03% |
|
52 Wk Lows |
7 |
|
|
52 Wk Lows |
100 |
|
|
 |
Breadth Positive as Major Indices Rallied
Kenneth J. Gruneisen - Passed the CAN SLIM® Master's Exam
The S&P 500 (+1.7%) and Dow Jones Industrial Average (+1.3%) reached fresh all-time highs and the Nasdaq Composite climbed +2.5%. Volume reported was higher than the prior session totals on the NYSE and lighter on the Nasdaq exchange. Breadth was positive as advancers led decliners by almost a 4-1 margin on the NYSE and by a 3-1 margin on the Nasdaq exchange. There were 145 high-ranked companies from the Leaders List that hit new 52-week highs and were listed on the BreakOuts Page, versus the total of 119 on the prior session. New 52-week highs outnumbered new 52-week lows on the NYSE and on the Nasdaq exchange. The major indices are in a confirmed uptrend (M criteria). Disciplined investors know that new buying efforts are only to be made in stocks meeting all key criteria of the fact-based investment system.
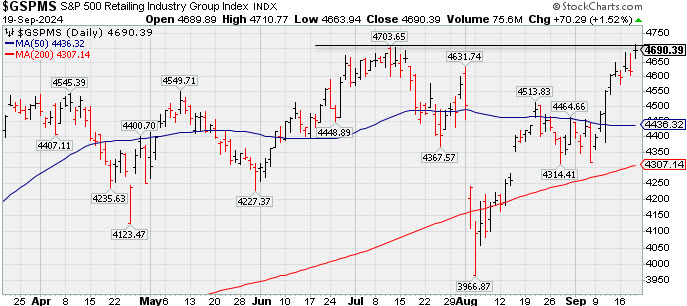
 PICTURED: The Dow Jones Industrial Average posted a solid gain on Thursday for a new all-time high.
Stocks rallied in response to Wednesday's decision by the FOMC to cut the target rate for the fed funds rate by 50 basis points to 4.75-5.00% Also, weekly jobless claims remained steady below recession-like levels, and the Philadelphia Fed Index tipped back into expansion (i.e. above 0.0 reading) in September. Existing home sales were slightly below expectations in August, but still reflected a tight market.
Apple (AAPL +3.71%) traded up after T-Mobile's (TMUS +1.50%) CEO indicated iPhone 16 sales in the first week were better than last year's models.
The S&P 500 information technology sector rose +3.1%. The consumer discretionary (+2.2%), communication services (+1.9%), and industrials (+1.8%) sectors were the next best performers. Meanwhile, defensive-oriented sectors including utilities (-0.6%) and consumer staples (-0.6%) underperformed.
The 10-yr yield settled five basis points higher at 3.73% and the 2-yr yield settled unchanged at 3.60%.
|
 Kenneth J. Gruneisen started out as a licensed stockbroker in August 1987, a couple of months prior to the historic stock market crash that took the Dow Jones Industrial Average down -22.6% in a single day. He has published daily fact-based fundamental and technical analysis on high-ranked stocks online for two decades. Through FACTBASEDINVESTING.COM, Kenneth provides educational articles, news, market commentary, and other information regarding proven investment systems that work in good times and bad.
Comments contained in the body of this report are technical opinions only and are not necessarily those of Gruneisen Growth Corp. The material herein has been obtained from sources believed to be reliable and accurate, however, its accuracy and completeness cannot be guaranteed. Our firm, employees, and customers may effect transactions, including transactions contrary to any recommendation herein, or have positions in the securities mentioned herein or options with respect thereto. Any recommendation contained in this report may not be suitable for all investors and it is not to be deemed an offer or solicitation on our part with respect to the purchase or sale of any securities. |
|
 |
Retail, Financial, Tech, and Commodity-Linked Groups Rose
Kenneth J. Gruneisen - Passed the CAN SLIM® Master's Exam
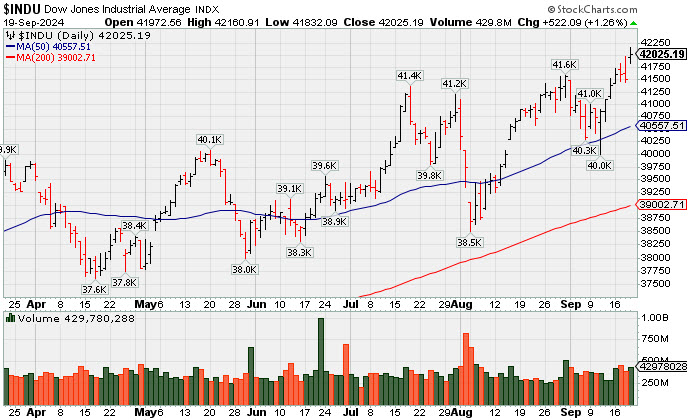
The Broker/Dealer Index ($XBD +1.69%), Bank Index ($BKX +2.85%), and the Retail Index ($RLX 1.52%) posted unanimous gains. The tech sector had a positive bias as the Semiconductor Index ($SOX +4.27%) and the Networking Index ($NWX +3.07%) both outpaced the Biotech Index ($BTK +0.91%) posted a smaller gain. The Gold & Silver Index ($XAU +1.37%), Oil Services Index ($OSX +2.49%), and the Integrated Oil Index ($XOI +1.33%) each notched gains.
PICTURED: The Retail Index ($RLX +1.52%) hit a new 2024 high.
| Oil Services |
$OSX |
78.92 |
+1.92 |
+2.49% |
-5.91% |
| Integrated Oil |
$XOI |
1,919.12 |
+25.15 |
+1.33% |
+3.04% |
| Semiconductor |
$SOX |
5,066.65 |
+207.36 |
+4.27% |
+21.34% |
| Networking |
$NWX |
1,114.29 |
+33.22 |
+3.07% |
+33.80% |
| Broker/Dealer |
$XBD |
696.21 |
+11.55 |
+1.69% |
+24.93% |
| Retail |
$RLX |
4,690.39 |
+70.29 |
+1.52% |
+20.61% |
| Gold & Silver |
$XAU |
158.75 |
+2.15 |
+1.37% |
+26.31% |
| Bank |
$BKX |
115.51 |
+3.20 |
+2.85% |
+20.30% |
| Biotech |
$BTK |
5,949.95 |
+53.89 |
+0.91% |
+9.80% |
|
|
|
 |
Featured Stocks
Kenneth J. Gruneisen - Passed the CAN SLIM® Master's Exam
|
|
|
Color Codes Explained :
Y - Better candidates highlighted by our
staff of experts.
G - Previously featured
in past reports as yellow but may no longer be buyable under the
guidelines.
***Last / Change / Volume data in this table is the closing quote data***
Symbol/Exchange
Company Name
Industry Group |
PRICE |
CHANGE
(%Change) |
Day High |
Volume
(% DAV)
(% 50 day avg vol) |
52 Wk Hi
% From Hi |
Featured
Date |
Price
Featured |
Pivot Featured |
|
Max Buy |
 USLM
-
NASDAQ
USLM
-
NASDAQ
U.S. Lime & Minerals
Bldg-Cement/Concrt/Ag
|
$95.44
|
+6.18
6.92% |
$95.84
|
82,349
112.81% of 50 DAV
50 DAV is 73,000
|
$87.95
8.52%
|
9/17/2024
|
$71.26
|
PP = $87.23
|
|
MB = $91.59
|
 Most Recent Note - 9/19/2024 2:45:02 PM
G - Hitting another new all-time high with today's 12th consecutive gain backed by below-average volume. New pivot point was cited based on its 8/01/24 high plus 10 cents. Color code is changed to green after rising above its "max buy" level.
>>> FEATURED STOCK ARTICLE : US Lime & Minerals Lingers Below 50-Day Average - 9/6/2024 |
View all notes |
Set NEW NOTE alert |
Company Profile |
SEC
News |
Chart |
Request a new note
C
A
S
I |
GVA
-
NYSE
Granite Construction
Bldg-Heavy Construction
|
$80.33
|
+2.83
3.65% |
$80.61
|
1,702,232
252.18% of 50 DAV
50 DAV is 675,000
|
$78.62
2.18%
|
6/11/2024
|
$59.76
|
PP = $64.33
|
|
MB = $67.55
|
Most Recent Note - 9/19/2024 1:12:09 PM
G - Hitting another new all-time high with today's big volume-driven gain. Its recent low and 50 DMA line coincide in the $70 area defining important near-term support to watch on pullbacks.
>>> FEATURED STOCK ARTICLE : Granite Contruction Closes at All-Time High - 8/30/2024 |
View all notes |
Set NEW NOTE alert |
Company Profile |
SEC
News |
Chart |
Request a new note
C
A
S
I |
MMYT
-
NASDAQ
MakeMyTrip
Leisure-Travel Booking
|
$106.91
|
+1.15
1.09% |
$108.90
|
354,011
52.68% of 50 DAV
50 DAV is 672,000
|
$105.79
1.06%
|
7/23/2024
|
$96.92
|
PP = $93.39
|
|
MB = $98.06
|
Most Recent Note - 9/18/2024 9:01:36 PM
G - Posted an 8th consecutive gain today with below-average volume hitting yet another new 52-week high. Recently retested support near its 50 DMA line ($93.76).
>>> FEATURED STOCK ARTICLE : New High After Finding Prompt Support Near 50-Day Moving Average - 9/12/2024 |
View all notes |
Set NEW NOTE alert |
Company Profile |
SEC
News |
Chart |
Request a new note
C
A
S
I |
TXRH
-
NASDAQ
Texas Roadhouse
Retail-Restaurants
|
$172.49
|
+9.38
5.75% |
$172.64
|
1,220,463
162.95% of 50 DAV
50 DAV is 749,000
|
$177.72
-2.94%
|
7/26/2024
|
$173.08
|
PP = $175.82
|
|
MB = $184.61
|
Most Recent Note - 9/19/2024 2:43:21 PM
Y - Color code is changed to yellow with today's big gain and rebound above the 50 DMA line ($167.77) helping its outlook to improve. Faces some resistance due to overhead supply up to the $177 level.
>>> FEATURED STOCK ARTICLE : Meeting Stubborn Resistance at 50-Day Moving Average - 8/27/2024 |
View all notes |
Set NEW NOTE alert |
Company Profile |
SEC
News |
Chart |
Request a new note
C
A
S
I |
HWM
-
NYSE
Howmet Aerospace
Aerospace/Defense
|
$97.43
|
+2.75
2.90% |
$97.52
|
2,357,844
84.94% of 50 DAV
50 DAV is 2,776,000
|
$98.15
-0.73%
|
7/30/2024
|
$93.95
|
PP = $85.52
|
|
MB = $89.80
|
Most Recent Note - 9/18/2024 8:57:47 PM
G - Volume totals have been cooling while consolidating in a tight range near its high. Its 50 DMA ($90.26) line defines important near-term support.
>>> FEATURED STOCK ARTICLE : Holding Ground Near All-Time High After Pullback Testing Support - 8/29/2024 |
View all notes |
Set NEW NOTE alert |
Company Profile |
SEC
News |
Chart |
Request a new note
C
A
S
I |
Symbol/Exchange
Company Name
Industry Group |
PRICE |
CHANGE
(%Change) |
Day High |
Volume
(% DAV)
(% 50 day avg vol) |
52 Wk Hi
% From Hi |
Featured
Date |
Price
Featured |
Pivot Featured |
|
Max Buy |
MELI
-
NASDAQ
MercadoLibre
Retail-Internet
|
$2,109.40
|
+6.76
0.32% |
$2,157.64
|
352,625
111.94% of 50 DAV
50 DAV is 315,000
|
$2,143.96
-1.61%
|
8/5/2024
|
$1,793.73
|
PP = $1,792.15
|
|
MB = $1,881.76
|
Most Recent Note - 9/18/2024 8:59:09 PM
G - Volume totals have been cooling while hovering near its all-time high. Its 50 DMA line ($1,877) defines support to watch on pullbacks.
>>> FEATURED STOCK ARTICLE : Pulled Back From New All-Time High - 9/3/2024 |
View all notes |
Set NEW NOTE alert |
Company Profile |
SEC
News |
Chart |
Request a new note
C
A
S
I |
NGVC
-
NYSE
Natural Grocers
Retail-Super/Mini Mkts
|
$29.25
|
-0.04
-0.14% |
$29.90
|
92,491
117.08% of 50 DAV
50 DAV is 79,000
|
$29.74
-1.65%
|
9/5/2024
|
$27.91
|
PP = $27.60
|
|
MB = $28.98
|
Most Recent Note - 9/19/2024 2:48:09 PM
G - Hovering at its 52-week high, the color code is changed to green after rising above its "max buy" level. Prior high in the $27 area defines initial support to watch on pullbacks. Fundamentals remain strong.
>>> FEATURED STOCK ARTICLE : Following Pullback a Secondary Buy Point Exists - 9/5/2024 |
View all notes |
Set NEW NOTE alert |
Company Profile |
SEC
News |
Chart |
Request a new note
C
A
S
I |
|
|
|
THESE ARE NOT BUY RECOMMENDATIONS!
Comments contained in the body of this report are technical
opinions only. The material herein has been obtained
from sources believed to be reliable and accurate, however,
its accuracy and completeness cannot be guaranteed.
This site is not an investment advisor, hence it does
not endorse or recommend any securities or other investments.
Any recommendation contained in this report may not
be suitable for all investors and it is not to be deemed
an offer or solicitation on our part with respect to
the purchase or sale of any securities. All trademarks,
service marks and trade names appearing in this report
are the property of their respective owners, and are
likewise used for identification purposes only.
This report is a service available
only to active Paid Premium Members.
You may opt-out of receiving report notifications
at any time. Questions or comments may be submitted
by writing to Premium Membership Services 665 S.E. 10 Street, Suite 201 Deerfield Beach, FL 33441-5634 or by calling 1-800-965-8307
or 954-785-1121.
|
|
|