You are not logged in.
This means you
CAN ONLY VIEW reports that were published prior to Friday, April 4, 2025.
You
MUST UPGRADE YOUR MEMBERSHIP if you want to see any current reports.
AFTER MARKET UPDATE - MONDAY, MARCH 28TH, 2016
Previous After Market Report Next After Market Report >>>
|
|
|
|
DOW |
+19.66 |
17,535.39 |
+0.11% |
|
Volume |
687,312,860 |
-21% |
|
Volume |
1,273,235,760 |
-12% |
|
NASDAQ |
-6.71 |
4,766.79 |
-0.14% |
|
Advancers |
1,739 |
57% |
|
Advancers |
1,294 |
45% |
|
S&P 500 |
+1.11 |
2,037.05 |
+0.05% |
|
Decliners |
1,285 |
42% |
|
Decliners |
1,575 |
55% |
|
Russell 2000 |
+0.69 |
1,080.23 |
+0.06% |
|
52 Wk Highs |
106 |
|
|
52 Wk Highs |
31 |
|
|
S&P 600 |
+0.65 |
666.93 |
+0.10% |
|
52 Wk Lows |
11 |
|
|
52 Wk Lows |
39 |
|
|
 |
Major Averages Were Little Changed and Trading Volume Was Light
Kenneth J. Gruneisen - Passed the CAN SLIM® Master's Exam
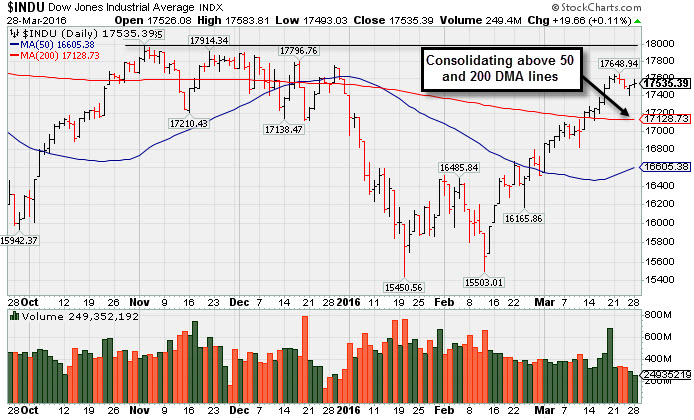
Stocks were little changed on Monday. The Dow was up 19 points to 17535. The S&P 500 climbed 1 point to 2037. The NASDAQ fell 6 points to 4766. The volume was reported lighter on the NYSE and on the Nasdaq exchange following the long holiday weekend. Advancers led decliners by nearly 3-2 on the NYSE but decliners narrowly led advancers on the Nasdaq exchange. Leadership improved as there were 20 high-ranked companies from the Leaders List made new 52-week highs and were listed on the BreakOuts Page, versus the total of 10 on the prior session. New 52-week highs outnumbered new 52-week lows on the NYSE but new lows again outnumbered new highs on the Nasdaq exchange.PICTURED: The Dow Jones Industrial Average is consolidating above its its 200-day moving average (DMA) line. Further gains have helped the DOW and the S&P 500 Index both rally above their respective 50-day and 200-day moving average (DMA)lines. The recent improvement for the major averages (M criteria) was backed by an expansion in healthy leadership (new highs), another encouraging sign for the current confirmed rally. The Featured Stocks Page includes most current notes with headline links for access to more detailed letter-by-letter analysis including price/volume graphs annotated by our experts. The major averages fluctuated on light trading volume amid a flurry of data on the economy. A release on Friday showed that U.S. fourth-quarter GDP increased by 1.4%, above the previously reported 1%. The PCE deflator, which is the Federal Reserve’s preferred gauge of inflation, contracted by 0.1% in February, which was in line with expectations. After declining by 2.5% in January, pending home sales were up 3.5% in February. Six out of ten sectors in the S&P 500 finished in positive territory. Consumer Staples paced the gains along with Materials while Energy shares lagged. Despite beating analyst earnings expectations, GameStop (GME -0.59%) as the company put forth disappointing forward guidance. Gilead (GILD +1.25%) rose on news the company reached a favorable settlement with Merck (MRK -0.45%) over a patent dispute concerning its flagship drug Harvoni. Treasuries moved higher along the curve with the benchmark 10-year note adding 4/32 to yield 1.88%. In commodities, NYMEX WTI crude lost 0.2% to $39.38/barrel while COMEX gold fell 0.1% to $1220.00/ounce. In FOREX, the dollar retreated against the euro and British pound but gained on the yen for a seventh-consecutive session. |
 Kenneth J. Gruneisen started out as a licensed stockbroker in August 1987, a couple of months prior to the historic stock market crash that took the Dow Jones Industrial Average down -22.6% in a single day. He has published daily fact-based fundamental and technical analysis on high-ranked stocks online for two decades. Through FACTBASEDINVESTING.COM, Kenneth provides educational articles, news, market commentary, and other information regarding proven investment systems that work in good times and bad.
Comments contained in the body of this report are technical opinions only and are not necessarily those of Gruneisen Growth Corp. The material herein has been obtained from sources believed to be reliable and accurate, however, its accuracy and completeness cannot be guaranteed. Our firm, employees, and customers may effect transactions, including transactions contrary to any recommendation herein, or have positions in the securities mentioned herein or options with respect thereto. Any recommendation contained in this report may not be suitable for all investors and it is not to be deemed an offer or solicitation on our part with respect to the purchase or sale of any securities. |
|
 |
Retail Index Posted Another Small Gain
Kenneth J. Gruneisen - Passed the CAN SLIM® Master's Exam
Commodity-linked groups edged lower as the Oil Services Index ($OSX -0.25%), Integrated Oil Index ($XOI -0.58%), and the Gold & Silver Index ($XAU -0.39%) fell. Financials fell as the Broker/Dealer Index ($XBD -0.35%) and the Bank Index ($BKX -0.23%) both slumped and dragged the major indices lower, meanwhile the Retail Index ($RLX +0.33%) posted a small gain. The Biotechnology Index ($BTK -1.61%) led the tech sector's retreat, meanwhile the Semiconductor Index ($SOX -0.14%) and the Networking Index ($NWX +0.24%) both inched lower.Charts courtesy www.stockcharts.com
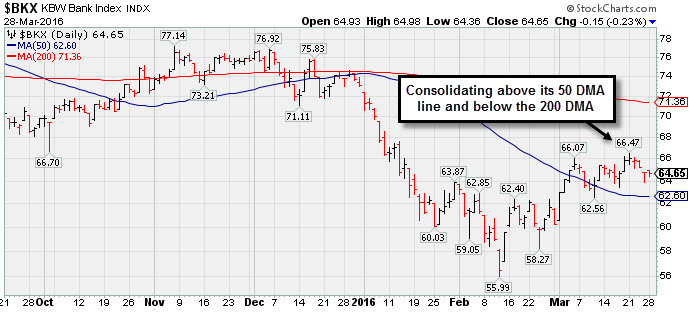
PICTURED: The Bank Index ($BKX -0.23%) is consolidating above its 50-day moving average (DMA) line and below its 200 DMA line.
| Oil Services |
$OSX |
157.42 |
-0.40 |
-0.25% |
-0.20% |
| Integrated Oil |
$XOI |
1,067.47 |
-6.18 |
-0.58% |
-0.49% |
| Semiconductor |
$SOX |
665.21 |
-0.93 |
-0.14% |
+0.26% |
| Networking |
$NWX |
356.53 |
-0.84 |
-0.24% |
-5.16% |
| Broker/Dealer |
$XBD |
158.27 |
-0.55 |
-0.35% |
-11.13% |
| Retail |
$RLX |
1,255.18 |
+4.17 |
+0.33% |
-2.20% |
| Gold & Silver |
$XAU |
67.22 |
-0.26 |
-0.39% |
+48.39% |
| Bank |
$BKX |
64.65 |
-0.15 |
-0.23% |
-11.54% |
| Biotech |
$BTK |
2,828.45 |
-46.21 |
-1.61% |
-25.84% |
|
|
|
 |
When You Get Back In Do It On The Right Foot
Kenneth J. Gruneisen - Passed the CAN SLIM® Master's Exam
Asset Management Services Using the Winning Fact-Based Investment System - Inquire Now! You can have professional help in limiting your losses and maximizing your gains in all market environments. For help with how your portfolio is managed in 2016 and beyond click here and indicate "Find a Broker". *Accounts over $250,000 please. **Serious inquires only, please. |
|
|
Color Codes Explained :
Y - Better candidates highlighted by our
staff of experts.
G - Previously featured
in past reports as yellow but may no longer be buyable under the
guidelines.
***Last / Change / Volume data in this table is the closing quote data***
|
|
|
THESE ARE NOT BUY RECOMMENDATIONS!
Comments contained in the body of this report are technical
opinions only. The material herein has been obtained
from sources believed to be reliable and accurate, however,
its accuracy and completeness cannot be guaranteed.
This site is not an investment advisor, hence it does
not endorse or recommend any securities or other investments.
Any recommendation contained in this report may not
be suitable for all investors and it is not to be deemed
an offer or solicitation on our part with respect to
the purchase or sale of any securities. All trademarks,
service marks and trade names appearing in this report
are the property of their respective owners, and are
likewise used for identification purposes only.
This report is a service available
only to active Paid Premium Members.
You may opt-out of receiving report notifications
at any time. Questions or comments may be submitted
by writing to Premium Membership Services 665 S.E. 10 Street, Suite 201 Deerfield Beach, FL 33441-5634 or by calling 1-800-965-8307
or 954-785-1121.
|
|
|