You are not logged in.
This means you
CAN ONLY VIEW reports that were published prior to Wednesday, April 9, 2025.
You
MUST UPGRADE YOUR MEMBERSHIP if you want to see any current reports.
AFTER MARKET UPDATE - FRIDAY, MARCH 27TH, 2020
Previous After Market Report Next After Market Report >>>
|
|
|
|
DOW |
-915.39 |
21,636.78 |
-4.06% |
|
Volume |
1,356,608,995 |
-16% |
|
Volume |
3,941,865,400 |
-1% |
|
NASDAQ |
-295.16 |
7,502.38 |
-3.79% |
|
Advancers |
651 |
22% |
|
Advancers |
851 |
25% |
|
S&P 500 |
-88.60 |
2,541.47 |
-3.37% |
|
Decliners |
2,302 |
78% |
|
Decliners |
2,495 |
75% |
|
Russell 2000 |
-48.33 |
1,131.99 |
-4.09% |
|
52 Wk Highs |
3 |
|
|
52 Wk Highs |
12 |
|
|
S&P 600 |
-30.78 |
669.88 |
-4.39% |
|
52 Wk Lows |
43 |
|
|
52 Wk Lows |
46 |
|
|
During market corrections it is especially important to reduce exposure, preserve your capital, and just be patient. Be safe! Historic studies have shown that the biggest up sessions have occurred during market corrections and bear markets.
Disciplined investors know to wait until a new confirmed rally marked by a solid follow-through day. The bold portion of the daily market commentary will note when that happens. For any clarification or additional help applying the fact-based investment system, we invite members to call, or contact us via the inquiry form.
|
 |
Major Indices Pulled Back Yet Ended with Solid Weekly Gains
Kenneth J. Gruneisen - Passed the CAN SLIM® Master's Exam
On Friday the Dow fell 915 points, but managed to notch its best week since 1938 with a 12.8% gain. The S&P 500 fell 3.4%, but rose 10.3% for the week. The Nasdaq Composite slipped 3.8%, trimming its weekly advance to 9.1%. Breadth was negative as decliners led advancers by nearly a 4-1 margin on the NYSE and 3-1 on the Nasdaq exchange. The reported volume totals were lighter than the prior session totals on the NYSE and on the Nasdaq exchange, revealing less selling pressure coming from the institutional crowd. Leadership remained elusive as only 1 high-ranked company from the Leaders List hit a new 52-week high and was listed on the BreakOuts Page. New 52-week lows totals still outnumbered the small new 52-week highs totals on both the NYSE and on the Nasdaq exchange. The major indices' (M criteria) have been in a noted "market correction" and investors have been prompted since February 25th to reduce market exposure. Charts used courtesy of www.stockcharts.com
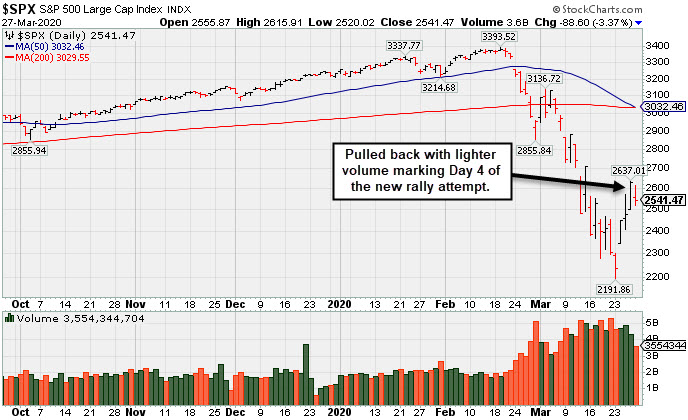
PICTURED: The S&P 500 Index pulled back with lighter volume marking Day 4 of a new rally attempt. Disciplined investors know to watch between Days 4-7 for a follow-through day of big gains from the major indices on higher volume coupled with an increase in the number of stocks hitting new highs to confirm a new market uptrend before initiating any new buying efforts.
Stocks pulled back on Friday from their best three-day winning streak since the 1930s, as investors continued to assess the economic impact of the coronavirus outbreak. Sentiment dampened after the U.S. surpassed China as the country with the most COVID-19 cases, with New York reporting more than 7,000 new infections. Equities attempted to pare losses after the House quickly passed the $2 trillion stimulus package, but the sell-off deepened after the Fed announced it would slow Treasury purchases next week.
Ten of 11 S&P 500 sectors ended in negative territory, with the Utilities group the lone advancer. The Energy sector led decliners with a 6.9% retreat as WTI crude prices notched a fifth straight week of losses. Industrials also lagged with Boeing (BA -10.27%) fell after Treasury Secretary Mnuchin noted the company would not be using federal funds. In earnings, Lululemon (LULU -5.96%) fell after failing to provide full-year guidance for 2020, saying online sales growth will not offset store closures.
On the data front, the core PCE deflator, which is the Fed’s preferred proxy of inflation, rose 1.8% year-over-year in February. Separately, a report from the University of Michigan showed March consumer sentiment tumbled to its lowest level since October 2016. Treasuries advanced, with the yield on the 10-year note down 14 basis points to 0.68%. |
 Kenneth J. Gruneisen started out as a licensed stockbroker in August 1987, a couple of months prior to the historic stock market crash that took the Dow Jones Industrial Average down -22.6% in a single day. He has published daily fact-based fundamental and technical analysis on high-ranked stocks online for two decades. Through FACTBASEDINVESTING.COM, Kenneth provides educational articles, news, market commentary, and other information regarding proven investment systems that work in good times and bad.
Comments contained in the body of this report are technical opinions only and are not necessarily those of Gruneisen Growth Corp. The material herein has been obtained from sources believed to be reliable and accurate, however, its accuracy and completeness cannot be guaranteed. Our firm, employees, and customers may effect transactions, including transactions contrary to any recommendation herein, or have positions in the securities mentioned herein or options with respect thereto. Any recommendation contained in this report may not be suitable for all investors and it is not to be deemed an offer or solicitation on our part with respect to the purchase or sale of any securities. |
|
 |
Commodity-Linked Groups Led Widespread Weakness
Kenneth J. Gruneisen - Passed the CAN SLIM® Master's Exam
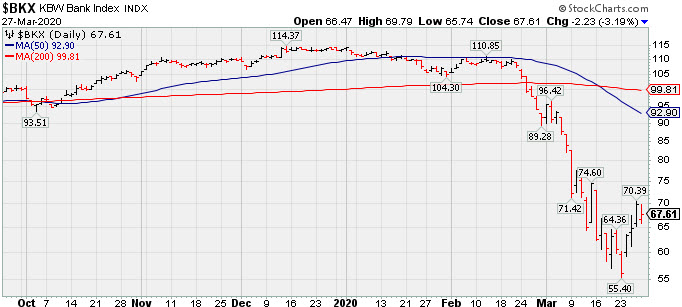
The Bank Index ($BKX -3.19%) and Broker/Dealer Index ($XBD -4.22%) both outpaced the Retail Index ($RLX -2.82%) to the downside on Friday. The tech sector was unanimously negative as the Semiconductor Index ($SOX -5.33%), Networking Index ($NWX -4.62%) and the Biotech Index ($BTK -2.21%) each posted losses. Commodity-linked groups were the weakest as the Oil Services Index ($OSX -7.42%), Integrated Oil Index ($XOI -6.38%), and the Gold & Silver Index ($XAU -7.19%) each suffered a big loss.
PICTURED: The Bank Index ($BKX -3.19%) pulled back on Friday following 3 consecutive gains off the recent low.
| Oil Services |
$OSX |
24.82 |
-1.99 |
-7.42% |
-68.30% |
| Integrated Oil |
$XOI |
591.27 |
-40.27 |
-6.38% |
-53.46% |
| Semiconductor |
$SOX |
1,488.75 |
-83.86 |
-5.33% |
-19.51% |
| Networking |
$NWX |
453.67 |
-22.00 |
-4.62% |
-22.24% |
| Broker/Dealer |
$XBD |
214.50 |
-9.44 |
-4.22% |
-26.13% |
| Retail |
$RLX |
2,162.41 |
-62.85 |
-2.82% |
-11.71% |
| Gold & Silver |
$XAU |
81.81 |
-6.34 |
-7.19% |
-23.48% |
| Bank |
$BKX |
67.61 |
-2.23 |
-3.19% |
-40.36% |
| Biotech |
$BTK |
4,339.75 |
-98.08 |
-2.21% |
-14.36% |
|
|
|
 |
No Featured Stocks
Kenneth J. Gruneisen - Passed the CAN SLIM® Master's Exam
During extremely bearish markets the number of stocks covered in this area has sometimes been reduced to zero. We suggest making no excuses for weak stocks in weak markets. Feel free to contact us if you have a need for any additional information. |
|
|
Color Codes Explained :
Y - Better candidates highlighted by our
staff of experts.
G - Previously featured
in past reports as yellow but may no longer be buyable under the
guidelines.
***Last / Change / Volume data in this table is the closing quote data***
|
|
|
THESE ARE NOT BUY RECOMMENDATIONS!
Comments contained in the body of this report are technical
opinions only. The material herein has been obtained
from sources believed to be reliable and accurate, however,
its accuracy and completeness cannot be guaranteed.
This site is not an investment advisor, hence it does
not endorse or recommend any securities or other investments.
Any recommendation contained in this report may not
be suitable for all investors and it is not to be deemed
an offer or solicitation on our part with respect to
the purchase or sale of any securities. All trademarks,
service marks and trade names appearing in this report
are the property of their respective owners, and are
likewise used for identification purposes only.
This report is a service available
only to active Paid Premium Members.
You may opt-out of receiving report notifications
at any time. Questions or comments may be submitted
by writing to Premium Membership Services 665 S.E. 10 Street, Suite 201 Deerfield Beach, FL 33441-5634 or by calling 1-800-965-8307
or 954-785-1121.
|
|
|