10/12/2016 12:33:20 PM - Slumping below its 50 DMA line toward prior lows. Last noted with caution in the 9/09/16 mid-day report - "Reported Jun '16 quarterly earnings +27% on +13% sales revenues, but prior quarterly comparisons were not strong and steady above the +25% minimum earnings guideline (C criteria). It was dropped from the Featured Stocks list on 1/27/14 due to technical deterioration."
9/9/2016 12:35:33 PM - Reported Jun '16 quarterly earnings +27% on +13% sales revenues, but prior quarterly comparisons were not strong and steady above the +25% minimum earnings guideline (C criteria). Gapped down today slumping well below its 50 DMA line toward prior lows. It was dropped from the Featured Stocks list on 1/27/14 due to technical deterioration.
8/11/2016 12:10:19 PM - Reported Jun '16 quarterly earnings +27% on +13% sales revenues, but prior quarterly comparisons were not strong and steady above the +25% minimum earnings guideline (C criteria). Found support near its 50 DMA line and consolidating in an orderly fashion near its 52- week high. It was dropped from the Featured Stocks list on 1/27/14 due to technical deterioration.
1/27/2014 6:58:02 PM - Finished in the middle of its intra-day range yet down for a 4th consecutive loss on ever-increasing volume. A rebound above the 50 DMA line is needed for its outlook to improve. It will be dropped from the Featured Stocks list due to technical deterioration.
1/24/2014 11:29:01 AM - G - Violated its 50 DMA line with today's 3rd consecutive loss on ever-increasing volume, raising concerns and triggering a technical sell signal. Only a prompt rebound above the 50 DMA line would help its outlook improve.
1/23/2014 12:51:33 PM - Y - Testing support at its 50 DMA line ($40.50 now) and slumping back below its pivot point with today's loss on higher volume. More damaging losses would raise concerns and trigger a technical sell signal.
1/21/2014 3:22:23 PM - Y - Quietly hovering near its 52-week high, holding its ground stubbornly. It remains below its "max buy" level after bullish action in recent weeks.
1/14/2014 5:23:26 PM - Y - Hovering near its 52-week high following a volume-driven gain on 1/09/14 after a Morgan Stanley analysts raised their target price. Prior reports noted - "At least +40% above average volume should be behind gains above the pivot point to trigger a proper new technical buy signal."
1/9/2014 12:59:15 PM - Y - Hitting new 52-week highs with today's volume-driven gain after gapping up following news a Morgan Stanley analysts raised their target price. It has already traded nearly 2 times average volume behind today's gain. Prior reports noted - "At least +40% above average volume should be behind gains above the pivot point to trigger a proper new technical buy signal."
1/8/2014 5:59:28 PM - Y - Touched a new 52-week high today then reversed into the red for a loss on higher volume indicating distributional pressure. At least +40% above average volume should be behind gains above the pivot point to trigger a proper new technical buy signal.
1/6/2014 7:11:17 PM - Y - Hovering in a tight range, holding its ground near its 52-week high while volume has been light behind recent gains. At least +40% above average volume should be behind gains above the pivot point to trigger a proper new technical buy signal.
12/31/2013 5:18:33 PM - Y - Rallied for a best ever close with light volume behind today's gain. At least +40% above average volume should be behind gains above the pivot point to trigger a proper new technical buy signal. See the latest FSU analysis for more details and a new annotated graph.
12/26/2013 6:26:14 PM - Y - Rallied further above the previously cited pivot point and hit another new 52-week high with light volume behind today's 10th consecutive gain. Found prompt support at its 50 DMA line recently. At least +40% above average volume should be behind gains above the pivot point to trigger a proper new technical buy signal.
12/26/2013 1:10:16 PM - Y - Rallying further above the previously cited pivot point and hitting another new 52-week high with today's 9th consecutive gain. Found prompt support at its 50 DMA line recently. At least +40% above average volume should be behind gains above the pivot point to trigger a proper new technical buy signal.
12/23/2013 1:09:43 PM - Y - Color code is changed to yellow while rallying above the previously cited pivot point and hitting a new 52-week high with today's 8th consecutive gain. Found prompt support at its 50 DMA line recently. At least +40% above average volume should be behind gains above the pivot point to trigger a proper new technical buy signal.
12/18/2013 2:07:09 PM - G - Consolidating near its 50 DMA line, stubbornly holding its ground after the damaging 12/11/13 loss raised concerns. Recently noted with caution- "Challenged its 52-week high recently but did not produce the required volume-driven gains above the pivot point to trigger a proper new technical buy signal."
12/12/2013 1:09:11 PM - G - Rebounding near its 50 DMA line with a solid gain backed by above average volume today. On the prior session it violated its 50 DMA line triggering a technical sell signal and it was noted - "Only a prompt rebound above its 50 DMA line would help its outlook improve. Challenged its 52-week high recently but did not produce the required volume-driven gains above the pivot point to trigger a proper new technical buy signal."
12/11/2013 5:00:11 PM - G - Considerable loss with above average volume today violated its 50 DMA line triggering a technical sell signal. Color code is changed to green due to the deterioration while only a prompt rebound above its 50 DMA line would help its outlook improve. Challenged its 52-week high recently but did not produce the required volume-driven gains above the pivot point to trigger a proper new technical buy signal.
12/6/2013 4:10:10 PM - Y - Reversed into the red today after challenging its 52-week high. Perched within close striking distance of its pivot point based on its 10/22/13 high plus 10 cents. Subsequent volume-driven gains above the pivot point may trigger a new (or add-on) technical buy signal.
12/3/2013 12:54:47 PM - Y - Challenged its 52-week high earlier today with above average volume behind its gain approaching the new pivot point cited based on its 10/22/13 high plus 10 cents. Subsequent volume-driven gains above the pivot point may trigger a new (or add-on) technical buy signal. Prior lows ($35.59 on 11/08/13 and $34.31 on 10/08/13) defines the next important chart support levels to watch. See the latest FSU analysis for more details and annotated daily and weekly graphs.
11/27/2013 6:27:05 PM - Y - Color code is changed to yellow with new pivot point cited based on its 10/22/13 high plus 10 cents. Subsequent volume-driven gains above the pivot point may trigger a new (or add-on) technical buy signal. Prior lows ($35.59 on 11/08/13 and $34.31 on 10/08/13) defines the next important chart support levels to watch. See the latest FSU analysis for more details and new annotated daily and weekly graphs.
11/21/2013 5:48:35 PM - G - Rebounded and closed back above its 50 DMA line today helping its technical stance improve. Prior lows ($35.59 on 11/08/13 and $34.31 on 10/08/13) defines the next important chart support levels to watch.
11/19/2013 6:34:28 PM - G - Violated its 50 DMA line and closed near the session low with a big loss on lighter than average volume today. Prior lows ($35.59 on 11/08/13 and $34.31 on 10/08/13) defines the next important chart support levels to watch.
11/14/2013 6:34:37 PM - G - Rebounded above its 50 DMA line with a solid gain on higher (near average) volume helping its technical stance improve. Prior low ($34.31 on 10/08/13) defines the next chart support level to watch.
11/13/2013 3:37:06 PM - G - Holding its ground near its 50 DMA line, but posting recent gains with very light volume. Prior low ($34.31 on 10/08/13) defines the next chart support level to watch.
11/7/2013 9:10:37 PM - G - Violated its 50 DMA line with today's loss on above average volume raising concerns and triggering a technical sell signal. It also violated an upward trendline connecting its April - October lows, finishing near the session low with the deterioration raising more serious concerns. Prior low ($34.31 on 10/08/13) defines the next chart support level to watch.
11/6/2013 4:06:36 PM - G - Posted a gain today on light volume, consolidating above its 50 DMA line. Below that important short-term average an upward trendline connecting its April - October lows defines additional technical support where further deterioration may raise more serious concerns.
10/31/2013 11:05:57 AM - G - Slumping just below its 50 DMA line and near an upward trendline connecting its April - October lows with today's 6th consecutive loss raising some concerns. Further deterioration may raise more serious concerns, and its prior low ($34.31 on 10/08/13) defines the next important support level.
10/28/2013 6:37:11 PM - G - Consolidating above its 50 DMA line and recent lows defining support after getting extended. See the latest FSU analysis for more details and new annotated daily and weekly graphs.
10/25/2013 3:01:29 PM - G - Down considerably today, retreating abruptly from new 52-week highs hit earlier this week. It is extended from any sound base. Found prompt support above prior highs in the $34 area and its 50 DMA line.
10/24/2013 1:30:02 PM - G - Pulling back from new 52-week highs hit earlier this week with today's volume-driven loss indicative of more distributional pressure. It is extended from any sound base. Found prompt support above prior highs in the $34 area and its 50 DMA line.
10/18/2013 5:14:19 PM - G - Hit another new 52-week high today with a gap up and volume-driven gain. Extended from any sound base. Found prompt support above prior highs in the $34 area and its 50 DMA line.
10/17/2013 4:02:43 PM - G - Hovering near its 52-week high, holding its ground with volume totals cooling, indicating that very few investors are exiting. Found prompt support above prior highs in the $34 area and its 50 DMA line while dipping below its "max buy" level last week.
10/11/2013 1:03:07 PM - G - Perched within close striking distance of its 52-week high. Found prompt support above prior highs in the $34 area and its 50 DMA line while dipping below its "max buy" level earlier this week.
10/10/2013 12:41:11 PM - G - Rebounding within striking distance of a best-ever close with today's 2nd consecutive gain backed by above average volume. Prior highs in the $34 area and its 50 DMA line define important support to watch.
10/8/2013 5:09:45 PM - G - Down considerably today with above average volume, sinking to prior highs in the $34 area and its 50 DMA line defining important support to watch.
10/3/2013 1:06:46 PM - G - Hit another new all-time high with today's volume-driven gain, getting more extended from its prior base. Prior highs in the $34 area and its 50 DMA line define support to watch on pullbacks.
10/1/2013 6:01:05 PM - G - Rallied for a second-best close today with light volume after a dip under its "max buy" level on the prior session. Prior highs in the $34 area and its 50 DMA line define support to watch on pullbacks.
9/25/2013 12:56:07 PM - G - Perched near its 52-week high and stubbornly holding its ground. Extended from a sound base after volume-driven gains lifted it above its "max buy" level. Prior highs in the $34 area and its 50 DMA line define support to watch on pullbacks.
9/23/2013 1:22:12 PM - G - Consolidating near its 52-week high after volume-driven gains lifted it above its "max buy" level. Prior highs in the $34 area define support above its 50 DMA line to watch on pullbacks.
9/20/2013 5:47:23 PM - G - Color code is changed to green. Reversed from new 52-week and all-time highs today, finishing near its "max buy" level. Prior highs in the $34 area define near-term support.
9/18/2013 7:38:09 PM - Y - Hit new 52-week and all-time highs today with lighter than average volume while approaching its "max buy" level. See the latest FSU analysis for more details and a new annotated graph.
9/13/2013 8:46:28 PM - Y - Tallied a 4th consecutive small loss today while holding its ground just -4.2% off its 52-week high.Found support at its 50 DMA line, important near-term support to watch. A valid secondary buy point exists up to +5% above its prior high.
9/9/2013 5:48:44 PM - Y - Rallied to a best-ever close and a new 52-week high with today's gain lacking great volume conviction. Found support at its 50 DMA line, important near-term support to watch. It did not form a base of sufficient length, however its color code was changed to yellow while a valid secondary buy point exists up to +5% above its prior high.
9/6/2013 1:02:45 PM - Y - Perched at its 52-week high following a spurt of gains from support at its 50 DMA line, important near-term support to watch. It did not form a base of sufficient length, however its color code was changed to yellow while a valid secondary buy point exists up to +5% above its prior high.
9/5/2013 1:01:54 PM - Y - Poised for a best-ever close with today's 3rd consecutive gain after finding support above its 50 DMA line, important near-term support to watch. It did not form a base of sufficient length, however its color code is changed to yellow while a valid secondary buy point exists up to +5% above its prior high.
9/4/2013 6:23:30 PM - G - Finding support above its 50 DMA line, important near-term support to watch.
8/29/2013 1:06:01 PM - G - Enduring mild distributional pressure this week and nearly testing its 50 DMA line today, important near-term support to watch.
8/26/2013 8:14:57 PM - G - Volume totals have been cooling while consolidating neat its 52-week high in a tight range. Its 50 DMA line defines important near-term support to watch.
8/19/2013 12:15:13 PM - G - Retreating from its 52-week high hit last week. Its 50 DMA line coincides with prior highs in the $29 area defining important near-term support to watch.
8/14/2013 1:26:02 PM - G - Hitting a new 52-week high today following a brief consolidation in a tight range with volume totals cooling in recent weeks, a sign that few investors have been headed for the exit. Its 50 DMA line coincides with prior highs in the $29 area defining important near-term support to watch.
8/13/2013 7:02:38 PM - G - Still holding its ground stubbornly near its 52-week high with volume totals cooling in recent weeks, a sign that few investors have been headed for the exit. Its 50 DMA line coincides with prior highs in the $29 area defining important near-term support to watch.
8/6/2013 4:31:29 PM - G - Holding its ground stubbornly near its 52-week high with small losses on light volume following volume-driven gains into new high territory. Prior highs in the $28-29 area define near-term support to watch.
7/29/2013 1:45:38 PM - G - Retreating form its 52-week high today after getting extended following 2 consecutive volume-driven gains into new high territory. Prior highs in the $28-29 area define near-term support to watch.
7/26/2013 5:07:51 PM - G - Hit another new 52-week high with a 2nd consecutive volume-driven gain, getting extended. Prior highs in the $28-29 area define near-term support to watch.
7/25/2013 2:21:45 PM - G - Color code is changed to green as it gapped up today and hit a new 52-week high, rallying above its "max buy" level. Prior highs in the $28-29 area define near-term support to watch.
7/24/2013 2:11:17 PM - Y - Color code is changed to yellow as it pulls back below its "max buy" level. Prior highs in the $28-29 area define near-term support to watch.
7/23/2013 5:49:37 PM - G - Touched a new high today but reversed into the red. Color code is changed to green as it wedged higher above its "max buy" level with gains lacking volume conviction after finding prompt support near prior highs in the $28-29 area.
7/17/2013 6:42:03 PM - Y - Posted a solid gain today for a new high close following a bout of distribution on the prior session. Found prompt support near prior highs in the $28-29 area defining initial support to watch on pullbacks.
7/16/2013 1:41:26 PM - Y - Retreating from its 52-week high following a streak of 7 consecutive gains marked by volume. Prior highs in the $28-29 area define initial support to watch on pullbacks.
7/12/2013 1:51:16 PM - Y - Hit another new 52-week high with today's 6th consecutive gain. Its gain with +130% above average volume triggered a technical buy signal while rallying above its pivot point on the prior session. When challenging its prior high an annotated weekly graph was included in the 7/10/13 mid-day report (read here) and it was covered in greater detail with an annotated daily graph in that evening's Featured Stock Update (FSU) section of the After Market Update.
7/11/2013 7:43:53 PM - Y - Gapped up and hit a new 52-week high with +130% above average volume behind today's 5th consecutive gain triggering a technical buy signal while rallying above its pivot point. An annotated weekly graph was included in the 7/10/13 mid-day report (read here) and it was noted that evening - "Additional volume-driven gains above its pivot point may trigger a proper technical buy signal. It has earned high ranks and maintained a strong quarterly and annual earnings history (C and A criteria). The number of top-rated funds owning its shares rose from 276 in Sep '12 to 403 in Jun '13, a reassuring sign concerning the I criteria. See the latest FSU analysis for more details and an annotated daily graph."
7/11/2013 1:18:53 PM - Y - Gapped up hitting new 52-week highs with ever-increasing volume behind today's 5th consecutive gain while rallying above its pivot point cited based on its 5/20/13 high plus 10 cents. An annotated weekly graph was included in the 7/10/13 mid-day report (read here) and it was noted that evening - "Additional volume-driven gains above its pivot point may trigger a proper technical buy signal. It has earned high ranks and maintained a strong quarterly and annual earnings history (C and A criteria). The number of top-rated funds owning its shares rose from 276 in Sep '12 to 403 in Jun '13, a reassuring sign concerning the I criteria. See the latest FSU analysis for more details and an annotated daily graph."
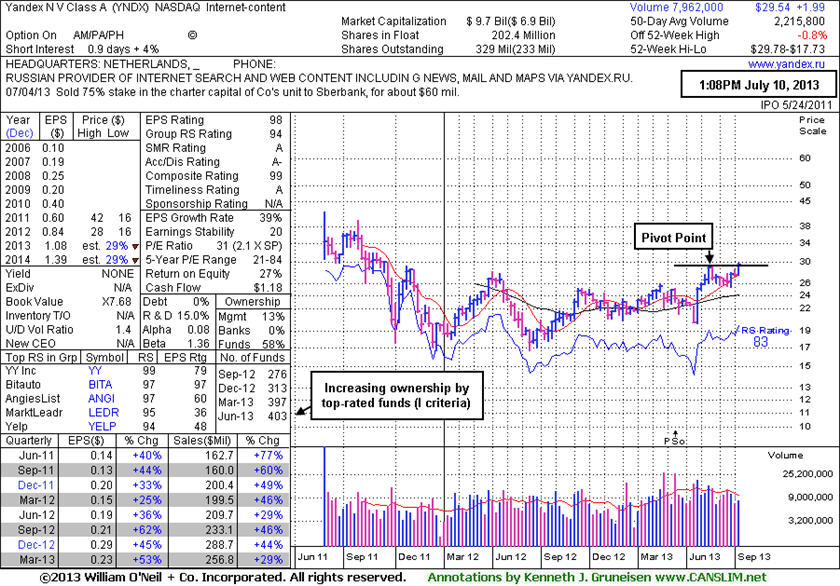
7/10/2013 6:07:00 PM - Y - Hit a new 52-week high with +135% above average volume behind today's 4th consecutive gain while challenging its pivot point cited based on its 5/20/13 high plus 10 cents. An annotated weekly graph was included in the earlier mid-day report (read here). Additional volume-driven gains above its pivot point may trigger a proper technical buy signal. It has earned high ranks and maintained a strong quarterly and annual earnings history (C and A criteria). The number of top-rated funds owning its shares rose from 276 in Sep '12 to 403 in Jun '13, a reassuring sign concerning the I criteria. See the latest FSU analysis for more details and an annotated daily graph.
7/10/2013 - Y - Color code is changed to yellow with pivot point cited based on its 5/20/13 high plus 10 cents. Volume-driven gains and a strong finish may clinch a technical buy signal. It has earned high ranks and maintained a strong quarterly and annual earnings history (C and A criteria). The number of top-rated funds owning its shares rose from 276 in Sep '12 to 403 in Jun '13, a reassuring sign concerning the I criteria.
 Ā
Ā