1/11/2013 1:04:56 PM - Gapped down today, slumping back below its 50 DMA line. Damaging volume-driven losses recently triggered technical sell signals. It was dropped from the Featured Stocks list on 1/07/13 when detailed analysis and a new annotated graph were included under the headline "Fundamental and Technical Weakness Raised Concerns".
1/7/2013 5:56:02 PM - Halted its slide after damaging volume-driven losses last week triggered a technical sell signal. Based on weaker fundamentals and deteriorating technical stance it will be dropped from the Featured Stocks list tonight. See the latest FSU analysis for more details and a new annotated graph.
1/3/2013 12:32:28 PM - G - Halting its 6-session losing streak with today's gain. Its 50 DMA line may now act as resistance following damaging volume-driven losses this week that triggered a technical sell signal.
1/2/2013 12:23:20 PM - G - Slumping further below its 50 DMA line today with another damaging volume-driven loss. Monday's loss triggered a technical sell signal, and its color code was changed to green. It stalled after the gain with +122% above average volume for a new 52-week high on 12/21/12 clinched a technical buy signal.
12/31/2012 12:44:25 PM - G - Violated its 50 DMA line with today's volume-driven loss triggering a technical sell signal, and its color code is changed to green. It stalled after the gain with +122% above average volume for a new 52-week high on 12/21/12 clinched a technical buy signal.
12/28/2012 10:01:16 AM - Y - It stalled and has been quietly holding its ground since a gain with +122% above average volume for a new 52-week high on 12/21/12 clinched a technical buy signal. No resistance remains due to overhead supply. Its 50 DMA defines near-term support to watch.
12/21/2012 5:37:26 PM - Y - Gain today with +122% above average volume for a new 52-week high clinched a technical buy signal. No resistance remains due to overhead supply.
12/18/2012 4:20:47 PM - Y - Up today with average volume for a best-ever close. Perched within close striking distance of its 52-week high today and no resistance remains due to overhead supply. Color code was changed to yellow with new pivot point cited based on its 12/12/12 high plus 10 cents.
12/17/2012 4:47:05 PM - Y - Consolidating within close striking distance of its 52-week high today and no resistance remains due to overhead supply. Color code is changed to yellow with new pivot point cited based on its 12/12/12 high plus 10 cents. See the latest FSU analysis for more details and a new annotated graph.
12/11/2012 6:26:59 PM - G - Challenged its 52-week high today and finished at a best-ever close with a solid gain on slightly above average volume. No resistance remains due to overhead supply. Quarterly comparisons for sales revenues and earnings increases have shown sequential deceleration in its growth rate raising some fundamental concerns, as recently noted.
12/4/2012 1:48:03 PM - G - Consolidating within close striking distance of its 52-week high today with very little resistance remaining due to overhead supply. Quarterly comparisons for sales revenues and earnings increases have shown sequential deceleration in its growth rate raising some fundamental concerns, as recently noted.
11/29/2012 1:05:50 PM - G - Consolidating above its 50 DMA line with little resistance remaining due to overhead supply. Quarterly comparisons for sales revenues and earnings increases have shown sequential deceleration in its growth rate raising some fundamental concerns, as recently noted.
11/23/2012 3:44:41 PM - G - Wedged above its 50 DMA line today. See the latest FSU analysis for more details and a new annotated graph.
11/19/2012 1:35:44 PM - G - Rallying back toward its 50 DMA line today which may act as resistance following last week's violation of that important short-term average. Reported earnings +24% on +19% sales revenues for the Sep '12 quarter, a notch below the +25% minimum guideline (C criteria).
11/15/2012 5:17:17 PM - G - Slumped further below its 50 DMA line today and finished -8.1% off its 52-week high. Reported earnings +24% on +19% sales revenues for the Sep '12 quarter, a notch below the +25% minimum guideline (C criteria).
11/14/2012 4:23:10 PM - G - Slumping below its 50 DMA line today and finishing -7.8% off its 52-week high. Reported earnings +24% on +19% sales revenues for the Sep '12 quarter, a notch below the +25% minimum guideline (C criteria).
11/12/2012 3:59:57 PM - G - Consolidating -5.4% off its 52-week high today and testing support again at its 50 DMA line. Reported earnings +24% on +19% sales revenues for the Sep '12 quarter, a notch below the +25% minimum guideline (C criteria).
11/7/2012 3:55:28 PM - G - Consolidating just -2.9% off its 52-week high today after recently finding support at its 50 DMA line. Reported earnings +24% on +19% sales revenues for the Sep '12 quarter, a notch below the +25% minimum guideline (C criteria). It has not formed a sound base and it is extended from a proper buy point under the fact-based system's guidelines.
11/1/2012 6:04:27 PM - G - Touched a new 52-week high today, rallying with above average volume after testing support at its 50 DMA line. It has not formed a sound base and it is extended from a proper buy point under the fact-based system's guidelines. See the latest FSU analysis for more details and a new annotated graph.
11/1/2012 1:39:14 PM - G - Touched a new 52-week high today, rallying with above average volume after testing support at its 50 DMA line. It has not formed a sound base and it is extended from a proper buy point under the fact-based system's guidelines.
10/31/2012 5:58:56 PM - G - Down today with above average volume, testing its 50 DMA line which defines important near-term support to watch. Retreating to just -4.4% from its 52-week high with a distributional loss.
10/23/2012 6:41:14 PM - G - Retreating from its 52-week high with another loss on below average volume. Its 50 DMA line defines important near-term support to watch.
10/16/2012 1:00:49 PM - G - Hitting new 52-week highs today with a big gain on below average volume. It is getting more extended from its prior base, and its 50 DMA line defines important support to watch on pullbacks.
10/9/2012 2:12:55 PM - G - Holding its ground this week with light volume totals after hitting new 52-week highs with gains on higher volume, It is extended from its prior base, and prior lows and its 50 DMA line in the $82 area define important support to watch on pullbacks.
10/3/2012 1:29:39 PM - G - Hit a new 52-week high with today's small gain on light volume, getting more extended from its prior base. Prior lows and its 50 DMA line in the $82 area define important support to watch on pullbacks.
9/28/2012 12:36:43 PM - G - Hitting a new 52-week high with today's volume-driven gain lifting it above the "max buy" level. Color code is changed to green after getting extended from its prior base. Prior highs in the $81 area and its 50 DMA line define important support to watch on pullbacks.
9/26/2012 1:12:50 PM - Y - Still holding its ground today in a tight range near its 52-week high. Prior highs in the $81 area and its 50 DMA line define important support to watch on pullbacks.
9/18/2012 5:42:38 PM - Y - Posted a gain today with below average volume. Still holding its ground in a tight range near its 52-week high since triggering a technical buy signal on 8/24/12 when highlighted in the mid-day report with a gap up gain backed by above average volume. Prior highs in the $81 area define initial support to watch on pullbacks.
9/13/2012 4:59:18 PM - Y - Posted a small gain today with near average volume. Still holding its ground in a tight range near its 52-week high since triggering a technical buy signal on 8/24/12 when highlighted in the mid-day report with a gap up gain backed by above average volume. Prior highs in the $81 area define initial support to watch on pullbacks.
9/7/2012 4:23:20 PM - Y - Still holding its ground in a tight range near its 52-week high since triggering a technical buy signal on 8/24/12 when highlighted in the mid-day report with a gap up gain backed by above average volume. Prior highs in the $81 area define initial support to watch on pullbacks.
9/4/2012 4:28:34 PM - Y - Still holding its ground since triggering a technical buy signal on 8/24/12 when highlighted in the mid-day report with a gap up gain backed by above average volume. Prior highs in the $81 area define initial support to watch on pullbacks.
8/28/2012 6:16:14 PM - Y - Holding its ground since triggering a technical buy signal on 8/24/12 when highlighted in the mid-day report with a gap up gain backed by above average volume. Prior highs in the $81 area define initial support to watch on pullbacks. See the latest FSU analysis for more details and a new annotated graph.
8/24/2012 5:41:29 PM - Y - Finished the session with a solid gain above its pivot point backed by +143% above average volume, triggering a technical buy signal while rallying from a very tight trading range where volume totals had cooled for several weeks. It was highlighted in yellow in the earlier mid-day report with a pivot point based on its 7/26/12 high plus 10 cents. The considerable gain with above average volume followed news that its generic Lidoderm(R) received FDA approval, an encouraging development concerning the N criteria. The 5/09/12 mid-day report noted - "Its improved fundamentals make it a worthy candidate for investors' watchlists. Sales revenues showed impressive acceleration while the 3 latest quarterly comparisons through Mar '12 showed earnings increases above the +25% guideline satisfying the C criteria. It also has maintained a strong annual earnings (A criteria) history."
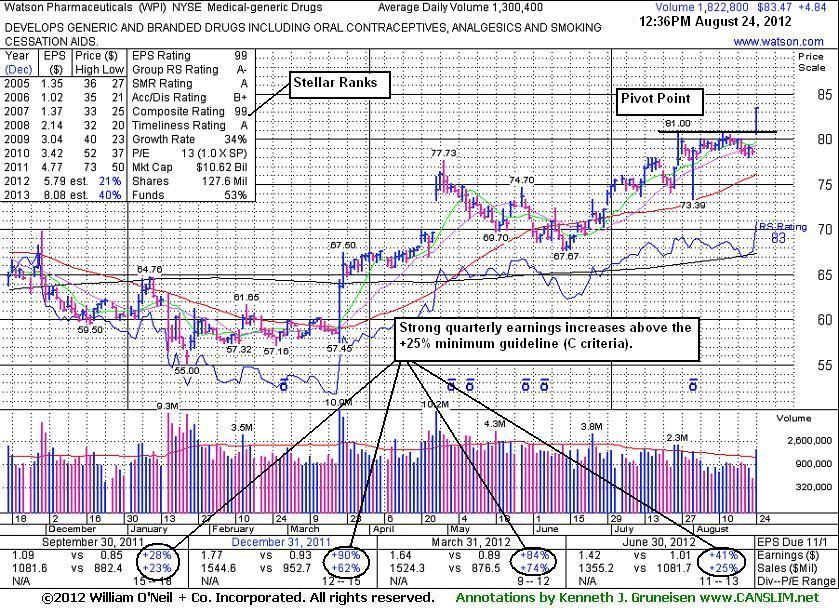
8/24/2012 - Y - Color code is changed to yellow with pivot point cited based on its 7/26/12 high plus 10 cents. Gapped up today and hit a new 52-week high, rallying from a very tight trading range where volume totals had cooled for several weeks. The considerable gain with above average volume followed news that its generic Lidoderm(R) received FDA approval, and encouraging development concerning the N criteria. Last noted in the 5/09/12 mid-day report - "Its improved fundamentals make it a worthy candidate for investors' watchlists. Sales revenues showed impressive acceleration while the 3 latest quarterly comparisons through Mar '12 showed earnings increases above the +25% guideline satisfying the C criteria. It also has maintained a strong annual earnings (A criteria) history."�
5/9/2012 1:25:31 PM - Consolidating near prior highs in the $73 area since spiking to new 52-week highs with a "breakaway gap" and volume-driven gains in late-April. It may form a base-on-base pattern while the broader market (M criteria) struggles to halt the latest correction, meanwhile its improved fundamentals make it a worthy candidate for investors' watchlists. Sales revenues showed impressive acceleration while the 3 latest quarterly comparisons through Mar '12 showed earnings increases above the +25% guideline satisfying the C criteria. It also has maintained a strong annual earnings (A criteria) history. It rebounded from a slump below its 200 DMA line during its consolidation since last noted in the 9/20/11 mid-day report - "Earnings history is below guidelines of the fact-based system. Completed a Secondary Offering on 11/11/10."
9/20/2011 1:48:06 PM - Gapped up today for a 6th consecutive gain and hit a new 52-week high. It slumped near its 200 DMA line during its consolidation in the interim since noted in the 7/27/11 mid-day report - "Earnings history is below guidelines of the fact-based system. Completed a Secondary Offering on 11/11/10."
9/19/2011 12:59:19 PM - Today's 5th consecutive gain has it rallying within close striking distance of its 52-week high. It slumped near its 200 DMA line during its consolidation in the interim since last noted in the 7/27/11 mid-day report - "Earnings history is below guidelines of the fact-based system. Completed a Secondary Offering on 11/11/10."
7/27/2011 1:24:40 PM - Hit a new 52-week high on the prior session then reversed into the red for a 2nd consecutive loss with above average volume. While stubbornly holding its ground and staying well above support at its 50 DMA line, prior mid-day reports noted - "Earnings history is below guidelines of the fact-based system. Completed a Secondary Offering on 11/11/10."
7/26/2011 1:33:15 PM - Hit a new 52-week high today and then reversed into the red. While stubbornly holding its ground and staying well above support at its 50 DMA line, prior mid-day reports noted - "Earnings history is below guidelines of the fact-based system. Completed a Secondary Offering on 11/11/10."
7/25/2011 1:53:21 PM - Hovering near its 52-week high today with volume totals below average in recent weeks. Stubbornly holding its ground, staying well above support at its 50 DMA line. Prior mid-day reports noted - "Earnings history is below guidelines of the fact-based system. Completed a Secondary Offering on 11/11/10."
7/7/2011 1:35:48 PM - Hovering near its 52-week high today. Stubbornly holding its ground while recently wedging higher, staying well above support at its 50 DMA line. Prior mid-day reports noted - "Earnings history is below guidelines of the fact-based system. Completed a Secondary Offering on 11/11/10."
6/28/2011 1:28:40 PM - Hit another new 52-week high today after a gap up. Recently wedging higher, staying well above support at its 50 DMA line. Prior mid-day reports noted - "Earnings history is below guidelines of the fact-based system. Completed a Secondary Offering on 11/11/10."
5/26/2011 2:07:29 PM - Hit a new 52-week high today after trading in a tight range in recent weeks. It found support near its 50 DMA line during its recent consolidation. Prior mid-day reports noted - "Earnings history is below guidelines of the fact-based system. Completed a Secondary Offering on 11/11/10."
5/19/2011 1:29:11 PM - Today marks its 3rd consecutive mid-day report appearance. Hovering in a tight range near its 52-week high in recent weeks, extended from any sound base. It found support near its 50 DMA line during its recent consolidation. Earnings history is below guidelines of the fact-based system. Completed a Secondary Offering on 11/11/10.
5/18/2011 1:34:34 PM - Hovering in a tight range near its 52-week high in recent weeks, extended from any sound base. It found support near its 50 DMA line during its recent consolidation. Earnings history is below guidelines of the fact-based system. Completed a Secondary Offering on 11/11/10.
5/17/2011 12:48:20 PM - Hovering in a tight range near its 52-week high, extended from any sound base. It found support near its 50 DMA line during its recent consolidation Earnings history is below guidelines of the fact-based system. Completed a Secondary Offering on 11/11/10."
5/3/2011 1:46:36 PM - Hit another new 52-week high today then reversed into the red. The 5/02/11 mid-day report noted - "Extended from any sound base. It found support near its 50 DMA line during its consolidation since last noted in the 1/26/11 mid-day report. Earnings history is below guidelines of the fact-based system. Completed a Secondary Offering on 11/11/10."
5/2/2011 1:35:55 PM - Hit a new 52-week high today, extended from any sound base. It found support near its 50 DMA line during its consolidation since last noted in the 1/26/11 mid-day report. Earnings history is below guidelines of the fact-based system. Completed a Secondary Offering on 11/11/10.
1/26/2011 2:12:04 PM - Hit a new 52-week high today with its 5th consecutive gain. It found support above its 50 DMA line and continued higher since the 11/12/10 mid-day report noted - "Earnings history is below guidelines of the fact-based system. Touched a new high today and then reversed into the red. Completed a Secondary Offering on 11/11/10 after recent volume-driven gains to new 52-week highs."
11/12/2010 1:03:15 PM - Earnings history is below guidelines of the fact-based system. Touched a new high today and then reversed into the red. Completed a Secondary Offering on 11/11/10 after recent volume-driven gains to new 52-week highs.
11/11/2010 1:09:35 PM - Gapped down today, pulling back after recent volume-driven gains to new 52-week highs. Earnings history is below guidelines of the fact-based system.