5/5/2022 12:51:55 PM - Found support near its 50 DMA line ($121.57) and rallied to new highs with recent volume-driven gains. Reported strong sales revenues and earnings increases in quarterly comparisons through Mar '22 versus the year ago periods. Fundamental concerns remain due to its up and down annual earnings (A criteria) history.
5/3/2022 12:45:16 PM - Found support near its 50 DMA line ($120) and wedged higher in recent weeks. Reported strong sales revenues and earnings increases in quarterly comparisons through Mar '22 versus the year ago periods. Fundamental concerns remain due to its up and down annual earnings (A criteria) history.
8/1/2018 1:20:17 PM - Finding support near its 200 DMA line. Due to report Junb '18 earnings news. Reported better earnings in the Sep, Dec '17, and Mar '18 quarters. Fundamental concerns remain due to its up and down annual earnings (A criteria) history. It was dropped from the Featured Stocks list on 9/11/14.
5/3/2018 1:32:57 PM - Still sputtering below its 50 DMA line. Reported better earnings in the Sep, Dec '17, and Mar '18 quarters, however fundamental concerns remain. It was dropped from the Featured Stocks list on 9/11/14.
4/9/2018 1:17:17 PM - Slumped below its 50 DMA line with recent volume-driven losses. Reported better earnings in the Sep and Dec '17 quarters. Fundamental concerns remain. It was dropped from the Featured Stocks list on 9/11/14.
4/4/2018 12:29:22 PM - Slumped below its 50 DMA line with recent volume-driven losses. Reported better earnings in the Sep and Dec '17 quarters. Fundamental concerns remain. It was dropped from the Featured Stocks list on 9/11/14.
2/21/2018 1:06:59 PM - Reported better earnings in the Sep and Dec '17 quarters. Fundamental concerns remain. It was dropped from the Featured Stocks list on 9/11/14.
9/29/2014 6:17:08 PM - Churned higher volume today while slumping below prior highs in the $92 area and further below its 50 DMA line ($91.99). Damaging losses triggered technical sell signals. Recent fundamental concerns were noted. It will be dropped from the Featured Stocks list tonight.
9/23/2014 5:16:07 PM - G - Churned higher volume today while slumping and testing prior highs in the $92 area and its 50 DMA line ($91.50). More damaging losses would raise greater concerns and trigger technical sell signals. Recent fundamental concerns were noted.
9/16/2014 8:17:56 PM - G - Churned higher volume today while consolidating above prior highs in the $92 area defining support above its 50 DMA line. Subsequent violations would raise greater concerns and trigger technical sell signals. Technical strength has continued despite recent fundamental concerns.
9/11/2014 6:28:28 PM - G - Consolidating above prior highs in the $92 area defining support above its 50 DMA line. Subsequent violations would raise greater concerns and trigger technical sell signals. Technical strength has continued despite recent fundamental concerns. See the latest FSU analysis for more details and new annotated graphs.
9/9/2014 7:10:04 PM - G - Consolidating above prior highs in the $92 area defining support above its 50 DMA line. Subsequent violations would raise greater concerns and trigger technical sell signals. Technical strength has continued despite having reported earnings +11% on +6% sales revenues for the Jun '14 quarter, below the +25% minimum earnings guideline (C criteria), raising fundamental concerns.
9/2/2014 6:30:11 PM - G - Hit another new 52-week high with higher volume (near average) behind today's 4th consecutive gain. Its 50 DMA line defines support where a subsequent violation would raise greater concerns and trigger a technical sell signal. Technical strength has continued despite having reported earnings +11% on +6% sales revenues for the Jun '14 quarter, below the +25% minimum earnings guideline (C criteria), raising fundamental concerns.
8/26/2014 5:33:32 PM - G - Perched at its 52-week high, and its 50 DMA line defines support where a subsequent violation would raise greater concerns and trigger a technical sell signal. Technical strength has continued despite having reported earnings +11% on +6% sales revenues for the Jun '14 quarter, below the +25% minimum earnings guideline (C criteria), raising fundamental concerns.
8/21/2014 6:00:18 PM - G - Technical strength has continued despite having reported earnings +11% on +6% sales revenues for the Jun '14 quarter, below the +25% minimum earnings guideline (C criteria), raising fundamental concerns. Hit a new 52-week high with today's 6th consecutive gain. Its 50 DMA line defines support where a subsequent violation would raise greater concerns and trigger a technical sell signal. See the latest FSU analysis for more details and new annotated graphs.
8/18/2014 1:40:29 PM - G - Reported earnings +11% on +6% sales revenues for the Jun '14 quarter, below the +25% minimum earnings guideline (C criteria), raising fundamental concerns. Gapped up today and hit a new 52-week high. Found support at its 50 DMA line ($85.98) where a subsequent violation would raise greater concerns and trigger a technical sell signal.
8/8/2014 4:08:52 PM - G - Reported earnings +11% on +6% sales revenues for the Jun '14 quarter, below the +25% minimum earnings guideline (C criteria), raising fundamental concerns. Found support this week at its 50 DMA line ($85.05) where a subsequent violation would raise greater concerns and trigger a technical sell signal.
8/5/2014 12:15:10 PM - G - Reported earnings +11% on +6% sales revenues for the Jun '14 quarter, below the +25% minimum earnings guideline (C criteria), raising fundamental concerns. Gapped down today for a loss with above average volume, testing support at its 50 DMA line ($84.56).
7/30/2014 5:42:51 PM - G - Pulled back with above average volume today, retreating from its 52-week high after getting extended from any sound base pattern. Its 50 DMA line defines important near-term support to watch on pullbacks.
7/25/2014 6:39:03 PM - G - Hit another new 52-week high with today's 8th consecutive gain, getting more extended from any sound base pattern. Its 50 DMA line defines important near-term support to watch on pullbacks. See the latest FSU analysis for more details and new annotated graphs.
7/21/2014 6:21:09 PM - G - Hit another new 52-week high with today's 4th consecutive gain, getting more extended from any sound base pattern. Its 50 DMA line ($81.60) defines important near-term support to watch on pullbacks.
7/14/2014 6:23:40 PM - G - Hovering near its 52-week high, extended from any sound base pattern. Its 50 DMA line ($80.57) defines important near-term support to watch on pullbacks.
7/7/2014 5:56:05 PM - G - Perched at its 52-week high, extended from any sound base pattern. Its 50 DMA line defines important near-term support to watch on pullbacks. See the latest FSU analysis for more details and new annotated graphs.
7/3/2014 2:53:26 PM - G - Inched to another new 52-week high with today's 6th consecutive gain, getting more extended from any sound base pattern. Prior highs near $77 define important near-term support to watch on pullbacks.
6/27/2014 4:53:22 PM - G - Hovering near its 52-week high, extended from any sound base pattern. Prior highs near $77 define important near-term support to watch on pullbacks.
6/20/2014 5:51:52 PM - G - Inched to another new 52-week high with today's 4th consecutive gain. Prior highs near $77 define important near-term support to watch on pullbacks.
6/13/2014 5:56:43 PM - G - Quietly hovering near its 52-week high. Prior highs near $77 define important near-term support to watch on pullbacks. See the latest FSU analysis for more details and new annotated graphs.
6/11/2014 6:31:23 PM - G - Quietly hovering near its 52-week high. Prior highs near $77 define important near-term support to watch on pullbacks.
6/4/2014 6:10:34 PM - G - Hit a new 52-week high with today's volume-driven gain. Recent lows near $73 define important near-term support to watch on pullbacks.
5/30/2014 6:09:01 PM - G - Perched at its 52-week high after 5 consecutive weekly gains. Recent lows near $73 define important near-term support to watch on pullbacks. See the latest FSU analysis for more details and new annotated graphs.
5/27/2014 6:01:28 PM - G - Touched a new 52-week high today after stubbornly holding its ground. Prior highs in the $69 area define near-term support to watch.
5/20/2014 6:39:28 PM - G - Hovering near its 52-week high after 3 consecutive gains. Prior highs in the $69 area define near-term support to watch.
5/13/2014 5:47:53 PM - G - Quietly consolidating -3.7% off its 52-week high. Prior highs in the $69 area define near-term support to watch. Reported +28% earnings on +19% sales for the Mar '14 quarter.
5/8/2014 6:29:39 PM - G - Pulled back from its 52-week high today after 4 consecutive gains. Prior highs in the $69 area define near-term support to watch. Reported +28% earnings on +19% sales for the Mar '14 quarter.
5/6/2014 6:27:59 PM - G - Hit yet another new 52-week high while rallying further above its "max buy" level with today's considerable gain adding to its recent spurt of volume-driven gains. Prior highs in the $69 area define near-term support to watch. Reported +28% earnings on +19% sales for the Mar '14 quarter.
5/5/2014 2:43:19 PM - G - Color code is changed to green while hitting a new 52-week high and rallying beyond its "max buy" level with today's considerable volume-driven gain. Reported strong earnings for the Mar '14 quarter.
4/30/2014 12:43:10 PM - Y - Highlighted in yellow with pivot point cited based on its 4/04/14 high in the 4/29/14 mid-day report (read here). The plastics maker separated its ethylene assets into a tax-advantaged partnership in which it plans to sell shares to the public. Holding its ground today, it gapped up and tallied a considerable gain with more than 4 times average volume for a new 52-week high on the prior session triggering a technical buy signal while rallying from a "double bottom" base. Quarterly earnings increases have been above the +25% minimum (C criteria) in comparisons through Dec '13. Keep in mind that 3 out of 4 stocks tend to move in the same direction of the major averages (M criteria) and confirming gains from the major averages are still needed as reassurance the broader market is strong. See the latest FSU analysis for more details and new annotated graphs.
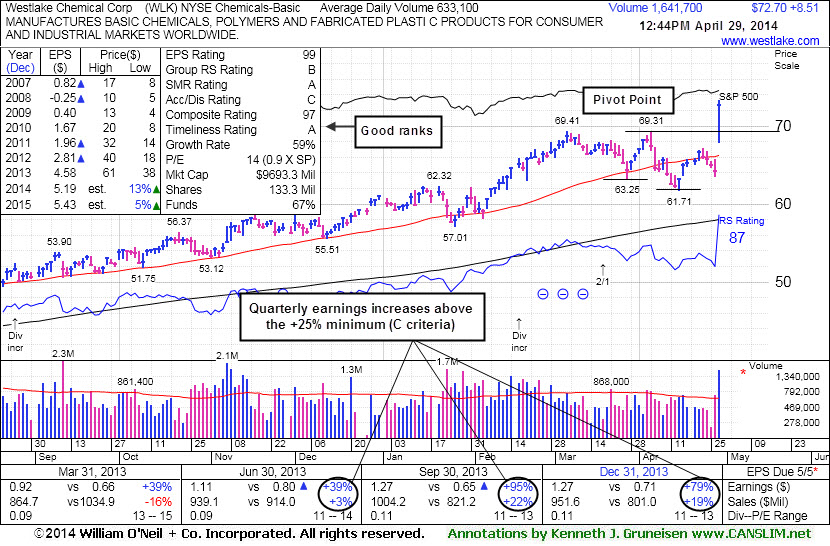
4/29/2014 5:40:00 PM - Y - Highlighted in yellow with pivot point cited based on its 4/04/14 high in the earlier mid-day report (read here). The plastics maker separated its ethylene assets into a tax-advantaged partnership in which it plans to sell shares to the public. Gapped up and tallied a considerable gain with more than 4 times average volume for a new 52-week high, triggering a technical buy signal while rallying from a "double bottom" base. Quarterly earnings increases have been above the +25% minimum (C criteria) in comparisons through Dec '13. Keep in mind that 3 out of 4 stocks tend to move in the same direction of the major averages (M criteria) and confirming gains from the major averages are still needed as reassurance the broader market is strong. See the latest FSU analysis for more details and new annotated graphs.
4/29/2014 12:51:52 PM - Y - Color code is changed to yellow with pivot point cited based on its 4/04/14 high. The plastics maker separated its ethylene assets into a tax-advantaged partnership in which it plans to sell shares to the public. Gapped up today for a considerable volume-driven gain and a new 52-week high, rallying from a "double bottom" base. Quarterly earnings increases have been above the +25% minimum (C criteria) in comparisons through Dec '13. Keep in mind that 3 out of 4 stocks tend to move in the same direction of the major averges (M criteria) and confirming gains from the major averages are still needed as reassurance the broader market is strong.
9/11/2013 2:12:03 PM - Gapped down from its 52-week high today. Fundamental concerns remain. Found support at its 200 DMA line then rebounded and rallied to new highs since noted in the 4/04/13 mid-day report with caution - "Earnings history is not a match with the fact-based investment system's guidelines."
9/9/2013 1:27:01 PM - Hit a new 52-week high with today's 5th consecutive gain. Fundamental concerns remain. Found support at its 200 DMA line then rebounded and rallied to new highs since last noted in the 4/04/13 mid-day report with caution - "Earnings history is not a match with the fact-based investment system's guidelines."
4/4/2013 1:20:51 PM - Slumped below its 50 DMA line and toward prior lows in the $83 area with a streak of 6 consecutive losses marked by ever-increasing volume. Prior mid-day reports cautioned - "Earnings history is not a match with the fact-based investment system's guidelines."
2/19/2013 1:21:24 PM - Perched at its 52-week high today while tallying a 2nd consecutive small gain backed by above average volume. No resistance remains due to overhead supply. Prior mid-day reports noted - "Earnings history is not a match with the fact-based investment system's guidelines."
12/7/2012 1:11:26 PM - Challenging its 52-week high with today's gain. Recently rebounded from a slump below its 50 DMA line after violating that important short-term average with damaging distributional losses. No resistance remains due to overhead supply. Prior mid-day reports noted - "Earnings history is not a match with the fact-based investment system's guidelines."
11/20/2012 12:46:19 PM - Consolidating near its 50 DMA line today after recently violating that important short-term average with damaging distributional losses. Little resistance remains due to overhead supply. The 11/13/12 mid-day report noted - "Earnings history is not a match with the fact-based investment system's guidelines."
11/13/2012 1:00:45 PM - Consolidating near its 50 DMA line today. No resistance remains due to overhead supply. Earnings history is not a match with the fact-based investment system's guidelines.
4/12/2011 1:45:21 PM - Perched near its all-time high, holding its ground and rising further above its 50 DMA line since last noted in the 3/14/11 mid-day report - "No resistance remaining due to overhead supply. Held its ground above its 2006-2007 highs in the $37 area while enduring distributional pressure and slumping under its 50 DMA line in the interim since noted in the 1/06/11 mid-day report - 'Recent quarters show great improvement but its earnings history has been below guidelines of the fact based investment system. It was last noted long ago in the 3/09/05 mid-day report. '"
3/14/2011 12:34:50 PM - Gapped up and touched another new all-time high today. Held its ground above prior highs and well above its 50 DMA line since last noted in the 2/22/11 with heavy volume behind its gain - "No resistance remaining due to overhead supply. Held its ground above its 2006-2007 highs in the $37 area while enduring distributional pressure and slumping under its 50 DMA line in the interim since noted in the 1/06/11 mid-day report - 'Recent quarters show great improvement but its earnings history has been below guidelines of the fact based investment system. It was last noted long ago in the 3/09/05 mid-day report. '"
2/22/2011 1:57:06 PM - Gapped up for another new all-time high today with heavy volume behind its gain. The 2/18/11 mid-day report noted - "No resistance remaining due to overhead supply. Held its ground above its 2006-2007 highs in the $37 area while enduring distributional pressure and slumping under its 50 DMA line in the interim since noted in the 1/06/11 mid-day report - 'Recent quarters show great improvement but its earnings history has been below guidelines of the fact based investment system. It was last noted long ago in the 3/09/05 mid-day report. '"
2/18/2011 1:52:11 PM - At a new all-time high today with no resistance remaining due to overhead supply. Held its ground above its 2006-2007 highs in the $37 area while enduring distributional pressure and slumping under its 50 DMA line in the interim since noted in the 1/06/11 mid-day report - "Recent quarters show great improvement but its earnings history has been below guidelines of the fact based investment system. It was last noted long ago in the 3/09/05 mid-day report. "
2/15/2011 1:02:16 PM - Quietly perched near its all-time high with no resistance remaining due to overhead supply. Held its ground above its 2006-2007 highs in the $37 area while enduring distributional pressure and slumping under its 50 DMA line in the interim since noted in the 1/06/11 mid-day report - "Recent quarters show great improvement but its earnings history has been below guidelines of the fact based investment system. It was last noted long ago in the 3/09/05 mid-day report. "
2/7/2011 1:58:46 PM - Spiking near its all-time high with today's 3rd consecutive volume-driven gain. Held its ground above its 2006-2007 highs in the $37 area while enduing distributional pressure and slumping under its 50 DMA line in the interim since noted in the 1/06/11 mid-day report - "Recent quarters show great improvement but its earnings history has been below guidelines of the fact based investment system. It was last noted long ago in the 3/09/05 mid-day report. "
1/6/2011 1:35:46 PM - Hovering near its all-time high. Held its ground stubbornly and rallied well above its 2006-2007 highs in the $37 area since last noted in the 11/04/10 mid-day report - "Recent quarters show great improvement but its earnings history has been below guidelines of the fact based investment system. It was last noted long ago in the 3/09/05 mid-day report. "
11/4/2010 1:47:00 PM - Rallying to new 52-week highs with a second consecutive gain backed by heavy volume, approaching all-time highs in the $37. Recent quarters show great improvement but its earnings history has been below guidelines of the fact based investment system. It was last noted long ago in the 3/09/05 mid-day report.
3/9/2005 12:43:45 PM - New IPO, short history. Impressive action.
2/17/2005 12:53:38 PM - New IPO, short history. Impressive action.
2/14/2005 1:23:53 PM - New IPO, short history.
2/11/2005 12:58:06 PM - New IPO, short history.
12/22/2004 12:44:34 PM - New IPO, short history.
12/15/2004 12:43:51 PM - New IPO, short history.
11/29/2004 12:47:34 PM - New IPO, short history.
11/18/2004 1:01:20 PM - New IPO, short history.
11/17/2004 12:53:04 PM - New IPO, short history.
11/16/2004 12:49:23 PM - New IPO, short history.
11/5/2004 12:38:07 PM - New IPO, short history.
11/3/2004 1:09:24 PM - New IPO, short history.
11/2/2004 12:38:20 PM - New IPO, short history.