2/12/2015 1:30:42 PM - Fundamental are not a match with the C criteria which call for 3 or 4 quarterly earnings reports above the +25% minimum guideline. Last noted in the 11/21/12 mid-day report with caution - "Poor market conditions (M criteria) are an overriding concern until the major averages are back in a new confirmed rally. It found support above its 200 DMA line and rebounded impressively after it was dropped from the Featured Stocks list on 7/20/12."
11/21/2012 12:30:59 PM - Fundamentals remain strong (C and A criteria) as it reported earnings +43% on +24% sales revenues for the Sep '12 quarter. Trading -9% off its 52-week high today, it recently found support at its 200 DMA line after damaging volume-driven losses. Last noted in the 11/09/12 mid-day report - "Poor market conditions (M criteria) are an overriding concern until the major averages are back in a new confirmed rally. It found support above its 200 DMA line and rebounded impressively after it was dropped from the Featured Stocks list on 7/20/12."
11/9/2012 1:27:46 PM - Fundamentals remain strong (C and A criteria) as it reported earnings +43% on +24% sales revenues for the Sep '12 quarter. Trading up today after early weakness below its 200 DMA line. On the prior session it gapped down for a damaging volume-driven loss and it was noted in the mid-day report - "Poor market conditions (M criteria) are an overriding concern until the major averages are back in a new confirmed rally. It found support above its 200 DMA line and rebounded impressively after it was dropped from the Featured Stocks list on 7/20/12."
11/8/2012 12:57:17 PM - Fundamentals remain strong (C and A criteria) as it reported earnings +43% on +24% sales revenues for the Sep '12 quarter. Today it gapped down for a damaging volume-driven loss and it is slumping near its 200 DMA line. Poor market conditions (M criteria) are an overriding concern until the major averages are back in a new confirmed rally. It found support above its 200 DMA line and rebounded impressively after it was dropped from the Featured Stocks list on 7/20/12.
11/7/2012 12:50:21 PM - Fundamentals remain strong (C and A criteria) while consolidating -5.5% off its 52-week high today, sputtering near its 50 DMA line. Due to report earnings after the session's close. Poor market conditions (M criteria) are an overriding concern until the major averages are back in a new confirmed rally. It found support above its 200 DMA line and rebounded impressively after it was dropped from the Featured Stocks list on 7/20/12.
10/23/2012 12:47:17 PM - Slumping -7.3% off its 52-week high today, failing to rebound following a damaging 10/19/12 loss on above average volume that violated its 50 DMA line. It had stayed mostly above that important short-term average since gapping up on 7/26/12 after reporting earnings +26% on +14% sales revenues for the quarter ended June 30, 2012 versus the year ago period, and the mid-day report noted - "The considerable gain and rebound above its 50 DMA helps its technical stance and outlook improve, however it did not form a sound base pattern since dropped from the Featured Stocks list on 7/20/12. Prior highs up through the $97 level may act as resistance."
7/27/2012 1:06:47 PM - Holding its ground today while perched -4.5% off its 52-week high. Gapped up on 7/26/12 after reporting earnings +26% on +14% sales revenues for the quarter ended June 30, 2012 versus the year ago period, and the mid-day report noted - "The considerable gain and rebound above its 50 DMA helps its technical stance and outlook improve, however it did not form a sound base pattern since dropped from the Featured Stocks list on 7/20/12. Prior highs up through the $97 level may act as resistance."
7/26/2012 12:54:51 PM - Gapped up today after reporting earnings +26% on +14% sales revenues for the quarter ended June 30, 2012 versus the year ago period. The considerable gain and rebound above its 50 DMA helps its technical stance and outlook improve, however it did not form a sound base pattern since dropped from the Featured Stocks list on 7/20/12. Prior highs up through the $97 level may act as resistance.
7/20/2012 5:20:17 PM - Gapped down today and suffered a considerable loss with nearly 4 times average volume. A weak finish on the prior session triggered technical sell signals by violating its 50 DMA and previously noted lows. Based on the damaging action it will be dropped from the Featured Stocks list tonight.
7/19/2012 2:18:30 PM - G - Violating its 50 DMA line with today's damaging loss with above average volume following an analyst downgrade and its color code is changed to green. It is also slumping below prior highs in the $91.50 area, triggering technical sell signals. Only a prompt rebound above its 50 DMA would help its technical stance improve.
7/13/2012 5:46:20 PM - Y - Volume totals have been cooling while consolidating below its "max buy" level. Prior highs in the $91.50 area and its 50 DMA line define important support to watch where violations may trigger technical sell signals. See the latest FSU analysis for more details and a new annotated graph.
7/12/2012 4:45:15 PM - Y - Color code is changed to yellow after quietly consolidating below its "max buy" level. Recently hovering above its pivot point near its 52-week high with no resistance remaining due to overhead supply. Prior highs in the $91.50 area and its 50 DMA line define important support to watch on pullbacks where violations may trigger technical sell signals.
7/5/2012 1:12:05 PM - G - Color code is changed to green after inching above its "max buy" level. Recently hovering near its 52-week high with no resistance remaining due to overhead supply. Its prior highs in the $91.50 area define initial support to watch on pullbacks.
6/29/2012 6:24:00 PM - Y - Hovering near its 52-week high today with no resistance remaining due to overhead supply. Its prior highs in the $91.50 area define initial support to watch on pullbacks.
6/28/2012 6:00:05 PM - Y - Pulled back from its 52-week high today with higher and above average volume indicating distributional pressure. No resistance remains due to overhead supply. Its 50 DMA line and prior lows define important near-term support.
6/27/2012 5:53:58 PM - Y - Hovering near its 52-week high, pulling back today on below average volume. Color code is changed to yellow after quietly dipping below its "max buy" level. No resistance remains due to overhead supply. Its 50 DMA line and prior lows define important near-term support.
6/22/2012 5:29:49 PM - G - Rallied to a new high close and new 52-week high with +80% above average volume behind its gain today. Color code is changed to green after closing above its "max buy" level. No resistance remains due to overhead supply. Its 50 DMA line and prior lows define important near-term support.
6/20/2012 1:12:47 PM - Y - Inching to another new 52-week high while on track for a 5th consecutive gain today. Its 6/15/12 gain with +72% above average volume confirmed a technical buy signal. No resistance remains due to overhead supply. Its 50 DMA line and prior lows define important near-term support.
6/15/2012 8:32:58 PM - Y - Rallied to a new 52-week high today with +72% above average volume, confirming a technical buy signal. No resistance remains due to overhead supply. Its 50 DMA line and prior lows define important near-term support.
6/15/2012 12:42:16 PM - Y - Wedging to new 52-week highs today without especially heavy volume. No resistance remains due to overhead supply. Its 50 DMA line and prior lows define important near-term support. New pivot point is cited based on its 5/04/12 high plus 10 cents. See the latest FSU analysis for more details and a new annotated graph.
6/13/2012 6:17:24 PM - Y - Churned above average volume today near its 52-week high with no resistance remaining due to overhead supply. Its 50 DMA line and prior lows define important near-term support. New pivot point is cited based on its 5/04/12 high plus 10 cents. See the latest FSU analysis for more details and a new annotated graph.
6/13/2012 12:29:10 PM - Y - Churning above average volume today near its 52-week high with no resistance remaining due to overhead supply. Its 50 DMA line and prior lows define important near-term support. As previously noted - "Confirming gains backed by higher volume, and a FTD from at least one of the major averages would be important and reassuring signs worth watching for."
6/12/2012 2:37:35 PM - Y - Quietly perched near its 52-week high with no resistance remaining due to overhead supply. Its 50 DMA line defines important near-term support. Confirming gains backed by higher volume, and a FTD from at least one of the major averages would be important and reassuring signs worth watching for.
6/6/2012 6:14:17 PM - Y - Today's gain on average volume led to a best-ever close near its 52-week high. Color code was changed to yellow based on recent resilience while no new pivot point was cited. The high-ranked Retail - Super/Mini Markets firm found prompt support near its 50 DMA line after damaging losses negated the latest technical breakout. Confirming gains backed by higher volume, and a FTD from at least one of the major averages would be important and reassuring signs worth watching for.
6/5/2012 4:58:15 PM - Y - Perched just -3.4% off its 52-week high today and its color code is changed to yellow based on recent resilience while no new pivot point is being cited. The high-ranked Retail - Super/Mini Markets firm found prompt support near its 50 DMA line after damaging losses negated the latest technical breakout. Confirming gains backed by higher volume, and a FTD from at least one of the major averages would be reassuring signs.
6/1/2012 12:25:45 PM - G - Encountered distributional pressure this week while rebounding toward its 52-week high. Recently found prompt support near its 50 DMA line but damaging losses negated the latest technical breakout after it stalled following its considerable "breakaway gap" on 5/03/12.
5/29/2012 5:00:16 PM - G - Up today with average volume. Found prompt support last week as it rebounded above its 50 DMA line following a streak of 5 consecutive losses which completely negated the latest breakout. It stalled following its considerable "breakaway gap" on 5/03/12.
5/21/2012 4:55:02 PM - G - Gain today with slightly higher above average volume was a sign of prompt support as it rebounded above its 50 DMA line following a streak of 5 consecutive losses which completely negated the latest breakout. It stalled following its considerable "breakaway gap" on 5/03/12, meanwhile the broader market (M criteria) fell into the latest correction.
5/17/2012 5:52:19 PM - G - Violated its 50 DMA line today with its 4th consecutive loss, triggering a technical sell signal. Color code is changed to green. The weak close below its old high close ($85.97 on 3/13/12) completely negated the latest breakout and raised more serious concerns. It stalled following its considerable "breakaway gap" on 5/03/12, meanwhile the broader market (M criteria) fell into the latest correction.
5/17/2012 1:42:29 PM - Y - Consolidating near its 50 DMA line today, an important support level. A weak close below its old high close ($85.97 on 3/13/12) would completely negate the latest breakout and raise more serious concerns. It stalled following its considerable "breakaway gap" on 5/03/12, meanwhile the broader market (M criteria) fell into the latest correction.
5/11/2012 7:07:48 PM - Y - Consolidating above prior highs since its considerable "breakaway gap" on 5/03/12 that cleared an orderly flat base pattern. The is no resistance remaining due to overhead supply. See the latest FSU analysis for more details and a new annotated graph.
5/8/2012 12:41:16 PM - Y - Pulling back toward prior highs with today's 3rd consecutive loss following its considerable "breakaway gap" that cleared an orderly flat base pattern. The is no resistance remaining due to overhead supply. Quarterly comparisons have shown strong earnings increases above the +25% guideline (C criteria). Its annual earnings (A criteria) history has been improving since a downturn in FY '08.
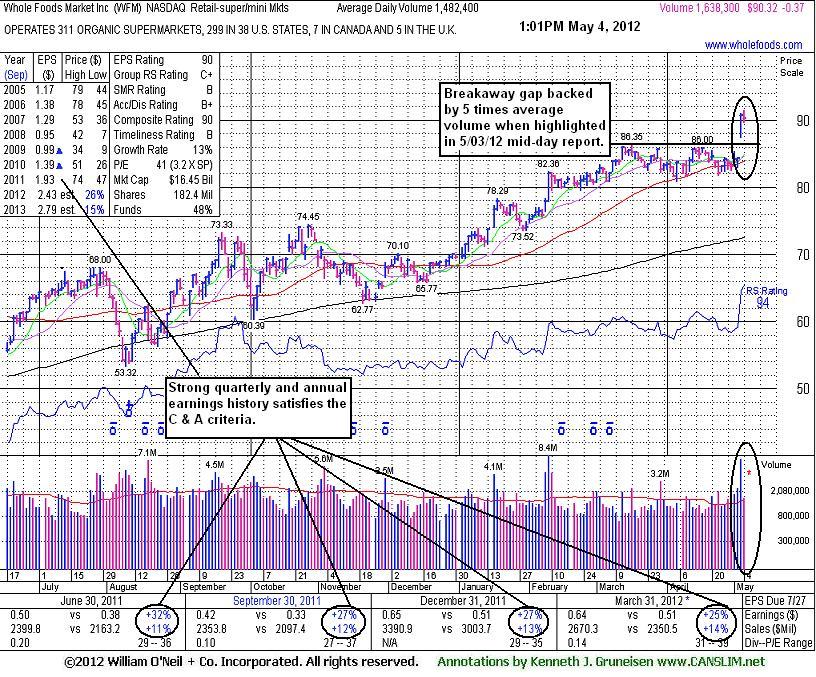
5/4/2012 1:09:32 PM - Y - Holding its ground today after highlighted in yellow in the 5/03/12 mid-day report while breaking out above the pivot point based on its 52-week high plus 10 cents. Its considerable "breakaway gap" for a new 52-week high was backed by 5 times average volume as it cleared an orderly flat base pattern. The is no resistance remaining due to overhead supply. Reported earnings +25% on +14% sales revenues for the quarter ended March 31, 2012 versus the year ago period. Quarterly comparisons have shown strong earnings increases above the +25% guideline. Its annual earnings (A criteria) history has been improving since a downturn in FY '08.
5/3/2012 1:32:47 PM - Y - Color code is changed to yellow with pivot point based on its 52-week high plus 10 cents. Today's considerable "breakaway gap" and volume-driven gain has it hitting a new 52-week high, breaking out of an orderly flat base pattern. The is no resistance remaining due to overhead supply. Reported earnings +25% on +14% sales revenues for the quarter ended March 31, 2012 versus the year ago period. Last noted in the 4/24/12 mid-day report - "Quarterly comparisons have shown strong earnings increases above the +25% guideline. Its annual earnings (A criteria) history has been improving since a downturn in FY '08."
4/24/2012 12:51:28 PM - Consolidating near its 50 DMA line and just -4.0% off its 52-week high, building on an orderly flat base pattern. The is no resistance remaining due to overhead supply. Due to report earnings after the market closes on Wednesday, May 2, 2012. Quarterly comparisons have shown strong earnings increases above the +25% guideline. Its annual earnings (A criteria) history has been improving since a downturn in FY '08.
3/29/2012 1:34:06 PM - Down today with above average volume. It recently wedged into new 52-week high territory with gains lacking great volume conviction. It is extended from prior highs in the $74 area, yet no resistance remains due to overhead supply. Quarterly comparisons have shown strong earnings increases above the +25% guideline. Its annual earnings (A criteria) history has been improving since a downturn in FY '08.
2/10/2012 1:37:05 PM - Holding its ground today following 2 considerable volume-driven gains into new 52-week high territory. It is extended from prior highs in the $74 area, yet no resistance remains due to overhead supply. Found support near its 200 DMA line when consolidating since noted in the 11/01/11 mid-day report - "Quarterly comparisons have shown strong earnings increases above the +25% guideline, however sales revenues increases have gradually decelerated from +15-11% and its annual earnings (A criteria) history has not been strong and steady."
2/9/2012 12:59:47 PM - Today's 2nd considerable volume-driven gain into new 52-week high territory has it getting extended from prior highs in the $74 area. No resistance remains due to overhead supply. Found support near its 200 DMA line when consolidating since noted in the 11/01/11 mid-day report - "Quarterly comparisons have shown strong earnings increases above the +25% guideline, however sales revenues increases have gradually decelerated from +15-11% and its annual earnings (A criteria) history has not been strong and steady."
1/17/2012 12:24:22 PM - Today's considerable gain with above average volume has it hitting a new 52-week high, leaving no resistance remaining due to overhead supply. Found support near its 200 DMA line when consolidating since noted in the 11/01/11 mid-day report - "Quarterly comparisons have shown strong earnings increases above the +25% guideline, however sales revenues increases have gradually decelerated from +15-11% and its annual earnings (A criteria) history has not been strong and steady."
1/5/2012 1:50:13 PM - Today it is perched -2.9% off its 52-week high after a streak of small gains without great volume conviction. Found support near its 200 DMA line when consolidating since last noted in the 11/01/11 mid-day report - "Quarterly comparisons have shown strong earnings increases above the +25% guideline, however sales revenues increases have gradually decelerated from +15-11% and its annual earnings (A criteria) history has not been strong and steady."
11/1/2011 1:43:59 PM - Quarterly comparisons have shown strong earnings increases above the +25% guideline, however sales revenues increases have gradually decelerated from +15-11% and its annual earnings (A criteria) history has not been strong and steady. It is perched -7.3% off its 52-week high after a small gap down today.