10/25/2023 12:32:25 PM - Testing its 200 DMA line ($231) after volume-driven losses. Reported earnings +21% on +11% sales revenues for the Sep '23 quarter versus the year-ago period. Prior quarterly comparisons were also below the +25% minimum earnings (C criteria) guideline.
9/15/2023 12:49:18 PM - Gapped down on the prior session testing its 50 DMA line ($241) with a volume-driven loss. Reported earnings +9% on +12% sales revenues for the Jun '23 quarter versus the year-ago period. Prior quarterly comparisons were below the +25% minimum earnings (C criteria) guideline.
9/14/2023 12:30:25 PM - Gapped down today testing its 50 DMA line ($241) with a volume-driven loss. Reported earnings +9% on +12% sales revenues for the Jun '23 quarter versus the year-ago period. Prior quarterly comparisons were below the +25% minimum earnings (C criteria) guideline.
3/20/2023 12:44:14 PM - Slumped well below its 50 DMA line with recent volume-driven losses but found support above its 200 DMA line ($207.77) last week. Prior mid-day reports noted - "Reported earnings +20% on +12% sales revenues for the Dec '22 quarter versus the year-ago period, its 2nd consecutive quarterly comparison below the +25% minimum earnings (C criteria) guideline."
3/17/2023 1:22:33 PM - Slumped below its 50 DMA line recently but finding support above its 200 DMA line this week. Reported earnings +20% on +12% sales revenues for the Dec '22 quarter versus the year-ago period, its 2nd consecutive quarterly comparison below the +25% minimum earnings (C criteria) guideline.
3/16/2023 1:14:58 PM - Slumping further below its 50 DMA line toward its 200 DMA line with volume-driven losses this week. Reported earnings +20% on +12% sales revenues for the Dec '22 quarter versus the year-ago period, its 2nd consecutive quarterly comparison below the +25% minimum earnings (C criteria) guideline.
3/2/2020 12:58:23 PM - Abruptly retreated from its all-time high and found prompt support at its 200 DMA line. Last noted with caution in the 1/31/20 mid-day report - "Reported earnings +12% on +10% sales revenues for the Dec '19 quarter, its 5th consecutive quarterly comparison below the +25% minimum earnings (C criteria) guideline. Since dropped from the Featured Stocks list on 10/24/18 it went through a deep consolidation then rebounded and made progress into new high territory."
1/31/2020 1:27:47 PM - Reported earnings +12% on +10% sales revenues for the Dec '19 quarter, its 5th consecutive quarterly comparison below the +25% minimum earnings (C criteria) guideline. Since dropped from the Featured Stocks list on 10/24/18 it went through a deep consolidation then rebounded and made progress into new high territory.
9/10/2019 12:59:12 PM - Reported earnings +14% on +11% sales revenues for the Jun '19 quarter, its 3rd consecutive quarterly comparison below the +25% minimum earnings (C criteria) guideline. Since dropped from the Featured Stocks list on 10/24/18 it went through a deep consolidation then rebounded and made progress into new high territory.
7/5/2019 12:43:55 PM - Reported earnings +18% on +8% sales revenues for the Mar '19 quarter, its 2nd consecutive quarterly comparison below the +25% minimum earnings (C criteria) guideline. Since dropped from the Featured Stocks list on 10/24/18 it went through a deep consolidation then rebounded and made progress into new high territory.
1/31/2019 1:19:10 PM - Reported earnings +20% on +13% sales revenues for the Dec '18 quarter, below the +25% minimum earnings (C criteria) guideline. Sputtering below its 200 DMA line ($137) again. More damaging losses below the recent low ($121.60 on 12/24/18) would raise serious concerns. It was dropped from the Featured Stocks list on 10/24/18.
12/6/2018 12:53:32 PM - Up from the session's early low after again undercutting its 200 DMA line ($134) which recently acted as support. More damaging losses below the recent low ($129.54 on 11/20/18) would raise serious concerns. A rebound above the 50 DMA line ($140.61) is needed for its outlook to improve. It was dropped from the Featured Stocks list on 10/24/18 amid broad market weakness (M criteria). Reported earnings +34% on +12% sales revenues for the Sep '18 quarter, continuing its strong earnings track record.
11/20/2018 12:46:34 PM - Up from the session's early low and sputtering near its 200 DMA line ($133.78) which recently has acted as support. More damaging losses would raise serious concerns. A rebound above the 50 DMA line ($142.57) is needed for its outlook to improve. It was dropped from the Featured Stocks list on 10/24/18 amid broad market weakness (M criteria). Reported earnings +34% on +12% sales revenues for the Sep '18 quarter, continuing its strong earnings track record.
10/30/2018 12:38:26 PM - Sputtering below its 200 DMA line ($132.50) which recently has acted as support, and more damaging losses would raise serious concerns. A rebound above the 50 DMA line ($143.84) is needed for its outlook to improve. It was dropped from the Featured Stocks list on 10/24/18 amid broad market weakness (M criteria). Reported earnings +34% on +12% sales revenues for the Sep '18 quarter, continuing its strong earnings track record.
10/25/2018 1:27:56 PM - Reported earnings +34% on +12% sales revenues for the Sep '18 quarter, continuing its strong earnings track record. Its 200 DMA line ($132) recently has acted as support, but more damaging losses would raise serious concerns. A rebound above the 50 DMA line ($144) is needed for its outlook to improve. It was dropped from the Featured Stocks list on 10/24/18 amid broad market weakness (M criteria).
10/24/2018 5:58:00 PM - Slumped near its 200 DMA line ($132) which recently acted as support. A rebound above the 50 DMA line ($144) is needed for its outlook to improve. It will be dropped from the Featured Stocks list tonight.
10/22/2018 6:06:47 PM - G - Volume totals have been cooling and a rebound above the 50 DMA line ($144) still is needed for its outlook to improve. Found support after slumping near its 200 DMA line ($132).
10/17/2018 5:47:18 PM - G - Following noted technical sell signals, a rebound above the 50 DMA line ($144) is needed for its outlook to improve. Found support after slumping near its 200 DMA line ($131) last week. See the latest FSU analysis for more details and a new annotated graph.
10/12/2018 1:03:00 PM - G - Bouncing today after slumping near its 200 DMA line ($131) following noted technical sell signals. A rebound above the 50 DMA line ($144) is needed for its outlook to improve.
10/11/2018 1:03:18 PM - G - Sputtering above its 200 DMA line ($131) which defines the next important support after losses violating its 50 DMA line and recent low ($142.55 on 9/05/18) triggered technical sell signals. A rebound above the 50 DMA line ($144) is needed for its outlook to improve.
10/10/2018 12:21:39 PM - G - Slumping even further below its 50 DMA line ($144) and recent low ($142.55 on 9/05/18) with today's big loss after recently noted technical sell signals. Only a rebound above the 50 DMA line would help its outlook improve.
10/8/2018 1:05:35 PM - G - Violated its 50 DMA line ($144) and recent low ($142.55 on 9/050/18) triggering technical sell signals. Only a rebound above the 50 DMA line would help its outlook improve.
10/2/2018 10:35:22 AM - G - Pulling back today after hitting another new all-time high on the prior session. Very extended from any sound base. Its 50 DMA line ($144) and recent low ($142.55 on 9/050/18) define important near-term support to watch on pullbacks. Fundamentals remain strong.
9/24/2018 4:24:15 PM - G - Perched near its all-time high, very extended from any sound base. Its 50 DMA line ($142.77) and recent low ($135.31 on 7/30/18) define important near-term support to watch on pullbacks. Fundamentals remain strong.
9/18/2018 6:01:46 PM - G - Very extended from any sound base. Its 50 DMA line ($141) and recent low ($135.31 on 7/30/18) define important near-term support to watch on pullbacks. Fundamentals remain strong.
9/13/2018 5:40:45 PM - G - Endured distributional pressure and it is extended from any sound base. Its 50 DMA line ($141) and recent low ($135.31 on 7/30/18) define important near-term support to watch on pullbacks. Fundamentals remain strong. See the latest FSU analysis for more details and an annotated graph.
9/5/2018 5:56:52 PM - G - Suffered a large loss with heavy volume today, action indicative of distributional pressure. It is extended from any sound base. Its 50 DMA line ($139) and recent low ($135.31 on 7/30/18) define important near-term support to watch on pullbacks. Fundamentals remain strong.
9/1/2018 10:06:50 AM - G - Holding its ground stubbornly perched at its all-time high, extended from any sound base. Its 50 DMA line ($139) and recent low ($135.31 on 7/30/18) define important near-term support to watch on pullbacks. Fundamentals remain strong.
8/24/2018 4:55:11 PM - G - Hit another new all-time high with today's gain backed by light volume. Its 50 DMA line ($138) and recent low ($135.31 on 7/30/18) define important near-term support to watch on pullbacks. Fundamentals remain strong.
8/17/2018 6:13:00 PM - G - Remains perched near its all-time high, extended from any sound base. Its 50 DMA line ($137.30) and recent low ($135.31 on 7/30/18) define important near-term support to watch on pullbacks. Fundamentals remain strong.
8/13/2018 7:13:27 PM - G - Remains perched near its all-time high, extended frm any sound base. Its 50 DMA line ($136.78) and recent low ($135.31 on 7/30/18) define important near-term support to watch on pullbacks. Fundamentals remain strong.
8/3/2018 2:42:33 PM - G - Remains perched near its all-time high after recent losses tested support near the prior high in the $136 area and its 50 DMA line ($135). Reported earnings +40% on +15% sales revenues for the Jun '18 quarter.
7/27/2018 5:16:51 PM - G - Extended from any sound base, stubbornly holding its ground perched at its all-time high. Reported earnings +40% on +15% sales revenues for the Jun '18 quarter. The prior high in the $136 area and its 50 DMA line ($135) define near term support. See the latest FSU analysis for more details and a new annotated graph.
7/23/2018 4:34:44 PM - G - Due to report earnings news on 7/25/18 after the close. Volume and volatility often increase near earnings news. Extended from any sound base, stubbornly holding its ground perched at its all-time high. The 50 DMA line ($134) defines support above the prior low ($129.53 on 6/25/18).
7/16/2018 6:16:15 PM - G - Quietly holding its ground perched at its all-time high following a spurt of volume-driven gains. Found support above its 50 DMA line ($133) and above prior highs in the $126 area.
7/9/2018 5:29:11 PM - G - Color code is changed to green after rising back above its "max buy" level. Found support above its 50 DMA line ($131.89) and above prior highs in the $126 area.
7/2/2018 6:29:00 PM - Y - Color code is changed to yellow while consolidating below its "max buy" level. Finding support above its 50 DMA line ($131) and above prior highs in the $126 area.
6/25/2018 5:53:45 PM - G - Big volume-driven loss today tested its 50 DMA line ($130.22) while retreating from its all-time high. Prior highs in the $126 area and its 50 DMA line ($130) define near-term support to watch on pullbacks.
6/18/2018 5:33:15 PM - G - Posted a volume-driven gain today for its second best close of all time. Prior highs in the $126 area and its 50 DMA line ($129) define near-term support to watch on pullbacks.
6/11/2018 6:09:11 PM - G - Hovering near its "max buy" level. Prior highs in the $126 area and its 50 DMA line ($127) define near-term support to watch on pullbacks. See the latest FSU analysis for more details and a new annotated graph.
6/6/2018 3:17:29 PM - G - Hitting new all-time highs above its "max buy" level with today's 6th consecutive gain and its color code is changed to green. Prior highs in the $126 area and its 50 DMA line ($126) define near-term support to watch on pullbacks.
5/31/2018 4:06:13 PM - Y - Endured distributional pressure this week while still stubbornly holding its ground in a tight range near its all-time high. Prior highs in the $126 area and its 50 DMA line ($125) define near-term support to watch on pullbacks.
5/23/2018 4:36:24 PM - Y - Stubbornly and quietly holding its ground in a tight range near its all-time high. Reported earnings +29% on +13% sales revenues for the Mar '18 quarter, and 3 of the past 4 quarterly comparisons were above the +25% minimum earnings guideline (C criteria).
5/16/2018 2:09:02 PM - Y - Stubbornly holding its ground and inching higher after a technical breakout noted in the 4/26/18 mid-day report. Reported earnings +29% on +13% sales revenues for the Mar '18 quarter, and 3 of the past 4 quarterly comparisons were above the +25% minimum earnings guideline (C criteria).
5/9/2018 3:47:33 PM - Y - Inching to new highs with today's 5th consecutive small gain backed by below average volume. Held its ground stubbornly after a technical breakout noted in the 4/26/18 mid-day report. Reported earnings +29% on +13% sales revenues for the Mar '18 quarter, and 3 of the past 4 quarterly comparisons were above the +25% minimum earnings guideline (C criteria).
5/2/2018 5:16:00 PM - Y - Touched a new high today but reversed into the red. Finished strong after highlighted in yellow with pivot point cited based on its 1/29/18 high plus 10 cents in the 4/26/18 mid-day report. Reported earnings +29% on +13% sales revenues for the Mar '18 quarter, and 3 of the past 4 quarterly comparisons were above the +25% minimum earnings guideline (C criteria).
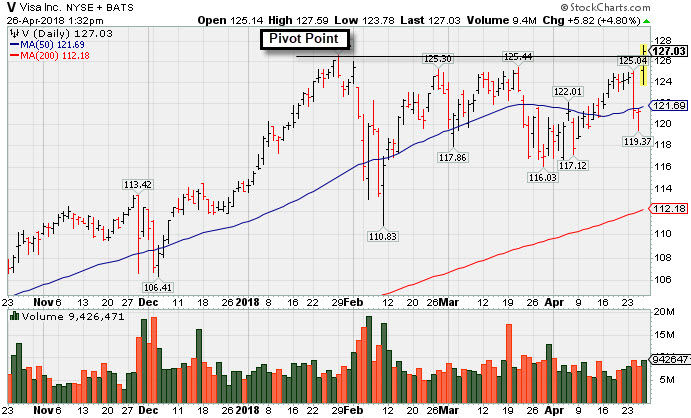
4/26/2018 7:12:26 PM - Y - Finished strong after highlighted in yellow with pivot point cited based on its 1/29/18 high plus 10 cents in the earlier mid-day report. Reported earnings +29% on +13% sales revenues for the Mar '18 quarter, and 3 of the past 4 quarterly comparisons were above the +25% minimum earnings guideline (C criteria). See the latest FSU analysis for more details and a new annotated graph.
4/26/2018 1:35:54 PM - Y - Color code is changed to yellow with pivot point cited based on its 1/29/18 high plus 10 cents. Gapped up today hitting a new all-time high, and a strong finish may clinch a convincing technical buy signal. Reported earnings +29% on +13% sales revenues for the Mar '18 quarter, and 3 of the past 4 quarterly comparisons were above the +25% minimum earnings guideline (C criteria).
12/4/2017 12:33:26 PM - Violating its 50 DMA line with today's 3rd volume-driven loss in the span of 4 sessions, retreating from a new all-time high hit last week. Last noted with caution in the 10/25/17 mid-day report - "Reported earnings +15% on +14% sales revenues for the Sep '17 quarter, below the +25% minimum earnings guideline (C criteria)."
10/25/2017 1:29:13 PM - Hitting a new all-time high today, extended from any sound base. Reported earnings +15% on +14% sales revenues for the Sep '17 quarter, below the +25% minimum earnings guideline (C criteria).
4/22/2016 12:42:40 PM - Gapped down today with a volume-driven loss after wedging to new highs with recent gains lacking great volume conviction. Reported earnings +8% on +6% sales revenues for the Mar '16 quarter and fundamental concerns remain. Prior quarterly comparisons did not show strong and steady earnings increases above the +25% minimum guideline (C criteria).
1/19/2016 12:30:44 PM - Consolidating near its 200 DMA line. Reported earnings +15% on +11% sales revenues for the Sep '15 quarter and fundamental concerns remain. Prior quarterly comparisons did not show strong and steady earnings increases above the +25% minimum guideline (C criteria).
11/3/2015 1:26:06 PM - Reported earnings +15% on +11% sales revenues for the Sep '15 quarter. Rebounding near 52-week and all-time highs with today's gain following a pullback on heavy volume. Prior mid-day reports cautioned members - "Reported earnings +37% on +12% sales revenues for the Jun '15 quarter but fundamental concerns remain. Prior quarterly comparisons had earnings increases below the +25% minimum guideline (C criteria)."
11/2/2015 1:04:40 PM - Reported earnings +15% on +11% sales revenues for the Sep '15 quarter. Gapped down today, retreating with heavy volume behind its loss after wedging to new 52-week and all-time highs with recent gains lacking great volume conviction. The 10/23/15 mid-day report cautioned members - "Reported earnings +37% on +12% sales revenues for the Jun '15 quarter but fundamental concerns remain. Prior quarterly comparisons had earnings increases below the +25% minimum guideline (C criteria)."
10/23/2015 1:28:18 PM - Quietly touched new 52-week and all-time highs today and no resistance remains due to overhead supply. Found support near its 200 DMA line and rebounded since last noted with caution in the 8/25/15 mid-day report - "Reported earnings +37% on +12% sales revenues for the Jun '15 quarter but fundamental concerns remain. Prior quarterly comparisons had earnings increases below the +25% minimum guideline (C criteria)."
8/25/2015 1:18:08 PM - Making its 3rd consecutive mid-day report appearance, today it is rebounding above its 50 DMA line. Deeply undercut its 200 DMA line on the prior session before rebounding impressively. Noted with caution in the 7/24/15 mid-day report when hitting its 52-week high - "Reported earnings +37% on +12% sales revenues for the Jun '15 quarter but fundamental concerns remain. Prior quarterly comparisons had earnings increases below the +25% minimum guideline (C criteria)."
8/24/2015 2:16:39 PM - Making its 2nd consecutive mid-day report appearance, it gapped down today and deeply undercut its 200 DMA line before rebounding impressively. Stalled after hitting new 52-week and all-time highs with a gap up gain when noted with caution in the 7/24/15 mid-day report - "Reported earnings +37% on +12% sales revenues for the Jun '15 quarter but fundamental concerns remain. Prior quarterly comparisons had earnings increases below the +25% minimum guideline (C criteria)."
8/21/2015 1:25:47 PM - Retreating near its 50 DMA line. Stalled after hitting new 52-week and all-time highs with a gap up gain when last noted with caution in the 7/24/15 mid-day report - "Reported earnings +37% on +12% sales revenues for the Jun '15 quarter but fundamental concerns remain. Prior quarterly comparisons had earnings increases below the +25% minimum guideline (C criteria)."
7/24/2015 1:10:38 PM - Hitting new 52-week and all-time highs with today's gap up gain. Reported earnings +37% on +12% sales revenues for the Jun '15 quarter but fundamental concerns remain. Prior mid-day reports cautioned members - "Prior quarterly comparisons had earnings increases below the +25% minimum guideline (C criteria)."
7/20/2015 12:58:41 PM - Hitting a new 52-week and all-time high with today's gap up gain. Fundamental concerns remain. Made gradual progress since last noted in the 1/20/15 mid-day with caution - "Prior quarterly comparisons had earnings increases below the +25% minimum guideline (C criteria)."
1/20/2015 1:06:13 PM - Consolidating near its 50 DMA line today. Made gradual progress since last noted in the 10/31/14 mid-day with caution following a considerable gap up and volume-driven gain - "Reported earnings +18% on +9% sales revenues for the Sep '14 quarter, and prior quarterly comparisons had earnings increases below the +25% minimum guideline (C criteria)."
10/31/2014 1:03:23 PM - Hitting new 52-week highs today following a considerable gap up and volume-driven gain on the prior session. Reported earnings +18% on +9% sales revenues for the Sep '14 quarter, and prior quarterly comparisons had earnings increases below the +25% minimum guideline (C criteria). Technically, it cleared a long base formed since last noted in the 1/30/14 mid-day report with caution - "It showed impressive resilience since technical deterioration and some fundamental concerns led to it being noted and dropped from the Featured Stocks list on 6/01/12."
1/30/2014 1:24:39 PM - Consolidating above important support at its 50 DMA line. Reported earnings +21% on +11% sales revenues for the Dec '13 quarter, and prior quarterly comparisons had earnings increases below the +25% minimum guideline (C criteria). Prior mid-day reports noted - "It showed impressive resilience since technical deterioration and some fundamental concerns led to it being noted and dropped from the Featured Stocks list on 6/01/12."
5/2/2013 1:12:00 PM - Gapped up today hitting new 52-week and all-time highs, rising from an orderly flat base-on-base pattern above important support at its 50 DMA line. Reported earnings +20% on +15% sales revenues for the Mar '13 quarter, its 5th consecutive quarterly comparison with earnings below the +25% minimum guideline (C criteria). Prior mid-day reports noted - "It showed impressive resilience since technical deterioration and some fundamental concerns led to it being noted and dropped from the Featured Stocks list on 6/01/12."
2/7/2013 1:34:25 PM - Churning above average volume in recent weeks while hovering at its 52-week and all-time highs making no meaningful headway, a sign of distributional pressure. Stayed well above its 50 DMA line in recent weeks. Reported earnings +22% on +12% sales revenues for the Sep '12 quarter, its 3rd consecutive quarterly comparison with earnings increasing just below the +25% minimum guideline (C criteria). Prior mid-day reports noted - "It showed impressive resilience since technical deterioration and some fundamental concerns led to it being noted and dropped from the Featured Stocks list on 6/01/12."
1/18/2013 12:59:46 PM - Small gap down today, retreating from its 52-week and all-time high hit last week. Stubbornly held its ground and rallied further since last noted in the 11/01/12 mid-day report with caution - "Found support while consolidating above its 50 DMA line in recent weeks. Reported earnings +21% on +15% sales revenues for the Sep '12 quarter. Three of the past 4 quarterly comparisons showed earnings increases below the +25% minimum guideline (C criteria). It showed impressive resilience since technical deterioration and some fundamental concerns led to it being noted and dropped from the Featured Stocks list on 6/01/12."
11/1/2012 1:33:06 PM - Trading up for a new 52-week high with today's 4th consecutive gain backed by above average volume. Found support while consolidating above its 50 DMA line in recent weeks. Reported earnings +21% on +15% sales revenues for the Sep '12 quarter. Three of the past 4 quarterly comparisons showed earnings increases below the +25% minimum guideline (C criteria). It showed impressive resilience since technical deterioration and some fundamental concerns led to it being noted and dropped from the Featured Stocks list on 6/01/12.
9/11/2012 12:38:41 PM - Trading near its 52-week high today after consolidating above its 50 DMA line in recent weeks in an orderly fashion. Reported earnings +24% on +12% sales revenues for the Jun '12 quarter. It rebounded through all overhead supply up through the $125 area, showing impressive resilience since technical deterioration and some fundamental concerns led to it being noted and dropped from the Featured Stocks list on 6/01/12.
7/26/2012 12:44:16 PM - Small gap up today, trading near its 52-week high while consolidating above its 50 DMA line. Reported earnings +24% on +12% sales revenues for the Jun '12 quarter. It rebounded through all overhead supply up through the $125 area, showing impressive resilience since technical deterioration and some fundamental concerns led to it being noted and dropped from the Featured Stocks list on 6/01/12.
7/16/2012 12:50:19 PM - Gapped up today and hit a new 52-week high. Found support at its 50 DMA line on a pullback last week. It rebounded through all overhead supply up through the $125 area, showing impressive resilience since technical deterioration and some fundamental concerns led to it being noted and dropped from the Featured Stocks list on 6/01/12.
7/9/2012 12:36:05 PM - Gapped down today, slumping toward its 50 DMA line. Last week it wedged to new high territory without great volume conviction. It rebounded through all overhead supply up through the $125 area since last noted on 6/01/12 when, based on technical deterioration and some fundamental concerns, it was dropped from the Featured Stocks list.
6/1/2012 2:00:47 PM - Slumping further below its 50 DMA line, today's 3rd consecutive loss has it trading under the prior low ($112.50 on 5/18/12) raising more serious concerns. It now faces overhead supply up through the $125 area that may be a source of resistance. Based on its technical deterioration it will be dropped from the Featured Stocks list tonight.
5/30/2012 12:36:00 PM - G - Hovering near its 50 DMA line after volume-driven gains helped it rebound from recent lows. The prior low ($112.50 on 5/18/12) defines important near-term support below its 50 DMA where any subsequent violation may raise more serious concerns and trigger a more worrisome technical sell signal.
5/29/2012 4:58:15 PM - G - Up today with slightly above average volume, rebounding back above its 50 DMA line which helped its outlook improve.
5/21/2012 4:51:13 PM - G - Up today with lighter volume, rebounding toward it 50 DMA line which has acted as a resistance level after the technical violation on 5/03/12. The longer it lingers below its 50 DMA line the worse its outlook becomes.
5/16/2012 6:43:45 PM - G - Still consolidating below its 50 DMA line which has acted as a resistance level after the technical violation on 5/03/12. The longer it lingers below its 50 DMA line the worse its outlook becomes. See the latest FSU analysis for more details and a new annotated graph.
5/16/2012 1:18:48 PM - G - Still consolidating below its 50 DMA line which has acted as a resistance level after the technical violation on 5/03/12. The longer it lingers below its 50 DMA line the worse its outlook becomes.
5/10/2012 11:28:36 AM - G - Consolidating just under its 50 DMA line which has acted as a resistance level after the technical violation on 5/03/12. Color code is changed to green. A rebound above its 50 DMA line is needed for its technical stance and outlook to improve.
5/4/2012 12:57:25 PM - Y - Rebounding near its 50 DMA line which may now act as a resistance level after the technical violation on the prior session. Previously noted - "Reported earnings +30% on +15% sales revenues for the quarter ended March 31, 2012 versus the year ago period. It dipped below its 50 DMA line with today's 2nd consecutive loss with above average volume, trading to its lowest level since its 4/13/12 gain backed by +49% above average volume technically confirmed a buy signal."
5/3/2012 1:21:45 PM - Y - Reported earnings +30% on +15% sales revenues for the quarter ended March 31, 2012 versus the year ago period. It dipped below its 50 DMA line with today's 2nd consecutive loss with above average volume, trading to its lowest level since its 4/13/12 gain backed by +49% above average volume technically confirmed a buy signal.
4/26/2012 4:07:37 PM - Y - Gain today on light volume helped it finish a penny below its best-ever close. Found support near its 50 DMA line this week. Sputtering since its 4/13/12 gain backed by +49% above average volume technically confirmed a buy signal. Its 50 DMA line defines support to watch well above prior highs in the $103-104 area.
4/23/2012 2:37:54 PM - Y - Dipped below its 50 DMA line earlier in the session and volume is running at an above average pace today while on track for its 4th consecutive loss. Sputtering since its 4/13/12 gain backed by +49% above average volume technically confirmed a buy signal. Its 50 DMA line defines support to watch well above prior highs in the $103-104 area.
4/20/2012 2:02:55 PM - Y - Volume totals have been cooling this week while it has been holding its ground. Its 4/13/12 gain backed by +49% above average volume technically confirmed a buy signal. Its 50 DMA line defines support to watch well above prior highs in the $103-104 area.
4/16/2012 5:39:38 PM - Y - Pulled back today with a loss on above average volume. Friday's gain backed by +49% above average volume technically confirmed a buy signal. Its 50 DMA line defines support to watch well above prior highs in the $103-104 area.
4/12/2012 4:25:10 PM - Y - Touched a new all-time high and finished a penny above its best-ever close with a gain on near average volume today. Wedged higher without great volume conviction behind gains in recent weeks. Its 50 DMA line defines support to watch well above prior highs in the $103-104 area.
4/10/2012 6:08:09 PM - Y - Pulled back from its all-time high with a loss on below average volume today. Wedged higher without great volume conviction behind gains in recent weeks. Its 50 DMA line defines support to watch well above prior highs in the $103-104 area.
4/4/2012 10:59:55 AM - Y - Hovering near its all-time high today, wedging higher without great volume conviction behind gains in recent weeks. Volume-driven gains may trigger a new (or add-on) technical buy signal, meanwhile its 50 DMA line defines support to watch well above prior highs in the $103-104 area.
3/28/2012 11:47:08 AM - Y - Touched another new all-time high on 3/26/12 with a gain on average volume. Volume-driven gains may trigger a new (or add-on) technical buy signal, meanwhile its 50 DMA line defines support to watch above prior highs in the $103-104 area.
3/19/2012 6:46:14 PM - Y - Touched a new all-time high with a gain on average volume today. Volume-driven gains may trigger a new (or add-on) technical buy signal, meanwhile its 50 DMA line defines support to watch above prior highs in the $103-104 area.
3/12/2012 6:30:53 PM - Y - Consolidating near its all-time high with volume totals cooling while forming an advanced "3-weeks tight" pattern. Color code is changed to yellow with new pivot point based on its 2/29/12 high plus 10 cents. Volume-driven gains may trigger a new (or add-on) technical buy signal, meanwhile prior highs in the $103-104 area define support to watch along with its 50 DMA line.
3/7/2012 6:45:03 PM - G - Recently wedged to new high territory with below average volume conviction behind its gains. Prior highs in the $103-104 area define support to watch. See the latest FSU analysis for more details and a new annotated weekly graph.
3/6/2012 1:42:21 PM - G - Small gap down today. Recently wedged to new high territory with below average volume conviction behind its gains. Its 50 DMA line and prior highs in the $103-104 area define support to watch.
2/29/2012 4:56:40 PM - G - Reversed and finished in the red today with slightly higher (but still below average) volume after inching to new high territory this week with below average volume conviction behind its recent 2 weeks' gains. Prior highs in the $103-104 area define initial support to watch on pullbacks.
2/24/2012 3:53:40 PM - G - Inching to new high territory this week with below average volume conviction behind its gains. Prior highs in the $103-104 area define initial support to watch on pullbacks.
2/22/2012 4:12:05 PM - G - Up today with below average volume for a best-ever close. Prior highs in the $103-104 area define initial support to watch on pullbacks.
2/14/2012 6:38:36 PM - G - Ended at a best-ever close today with a gain on average volume. Prior highs in the $103-104 area define initial support to watch on pullbacks.
2/10/2012 1:34:00 PM - G - Perched at its all-time high, extended from its prior base after rallying beyond its "max buy" level. Leadership (L criteria) in the group of Finance -Credit Card Payment Processing firms is a reassuring sign. Prior highs in the $103-104 area define initial support.
2/9/2012 12:53:04 PM - G - Off earlier highs following a considerable gap up gain to a new all-time high. Its color code was changed to green after rallying beyond its "max buy" level. Leadership (L criteria) in the group of Finance -Credit Card Payment Processing firms is a reassuring sign. Prior highs in the $103-104 area define initial support.
2/9/2012 10:02:19 AM - G - Considerable gap up gain today for another new all-time high and its color code is changed to green after rallying beyond its "max buy" level. Leadership (L criteria) in the group of Finance -Credit Card Payment Processing firms is a reassuring sign. Prior highs in the $103-104 area define initial support.
2/8/2012 5:52:18 PM - Y - Up again today with above average volume for another new all-time high amid more strength in the group of Finance -Credit Card Payment Processing firms. Prior highs in the $103-104 area define initial support.
2/3/2012 6:58:28 PM - Y - Gapped up again today for another new all-time high amid more strength in the group of Finance -Credit Card Payment Processing firms. Technically, its volume-driven gain above the new pivot point cited triggered a new (or add-on) buy signal. Prior highs in the $103-104 area define initial support.
2/2/2012 1:08:56 PM - Y - Gapped up today and hit a new all-time high amid strength in the group of Finance -Credit Card Payment Processing firms. No overhead supply remains to act as resistance. Its recent consolidation was not recognized as a sound basic base pattern, however some analysts may consider it an advanced "3-weeks tight" or longer consolidation in a tight trading range worthy of consideration. Color code is changed to yellow with a new pivot point based on its 1/19/12 high plus 10 cents. Prior highs in the $103-104 area define initial support. Its recent low ($98.33 on 1/11/12) and its 50 DMA line define important chart support to watch on pullbacks.
2/1/2012 3:26:10 PM - G - No overhead supply remains to act as resistance, however its recent consolidation is not recognized as a sound basic base pattern. Its recent low ($98.33 on 1/11/12) and its 50 DMA line define chart support to watch on pullbacks.
1/26/2012 5:25:02 PM - G - It has posted gains on lighter volume following its negative reversal after touching a new all-time high on 1/19/12 when last noted - "No overhead supply remains to act as resistance. Its recent low ($98.33 on 1/11/12) and its 50 DMA line define chart support to watch on pullbacks. "
1/19/2012 5:46:35 PM - G - Reversed into the red for a loss today with slightly higher (near average) volume than the prior session after touching another new all-time high. No overhead supply remains to act as resistance. Its recent low ($98.33 on 1/11/12) and its 50 DMA line define chart support to watch on pullbacks.
1/17/2012 4:49:30 PM - G - Gain today has it perched near its all-time high and no overhead supply remains to act as resistance. Its 50 DMA line defines chart support to watch on pullbacks.
1/12/2012 3:36:24 PM - G - Gain today halted a streak of 4consecutive losses. Its 50 DMA line defines chart support to watch on pullbacks.
1/10/2012 5:51:06 PM - G - Down today for a 4th loss in the span of 5 sessions, slumping near its "max buy" level. Prior highs in the $95 area and its 50 DMA line define chart support to watch on pullbacks.
1/5/2012 4:29:22 PM - G - Overcame early weakness and managed a positive reversal today for a small gain on below average volume. It is extended from its prior base and trading above its "max buy" level. Prior highs in the $95 area and its 50 DMA line define chart support to watch on pullbacks.
12/29/2011 5:40:35 PM - G - Up today with below average volume, rising to a best-ever close. It is extended from its prior base and trading above its "max buy" level. Prior highs in the $95 area and its 50 DMA line define chart support to watch on pullbacks.
12/27/2011 1:18:01 PM - G - Reversed into the red today after early gains helped it inch higher into new all-time high territory. It is extended from its prior base and trading above its "max buy" level. Prior highs in the $95 area and its 50 DMA line define chart support to watch on pullbacks.
12/23/2011 6:24:30 PM - G - Gain today with light volume helped it rally further into new all-time high territory. It is extended from its prior base and trading above its "max buy" level. Prior highs in the $95 area and its 50 DMA line define chart support to watch on pullbacks.
12/20/2011 1:48:22 PM - G - Inching higher today into new all-time high territory. Color code is changed to green as it is getting extended from its prior base and trading above its "max buy" level. Prior highs in the $95 area and its 50 DMA line define chart support to watch on pullbacks.
12/19/2011 5:42:59 PM - Y - Up today with slightly above average volume for its best close of all-time, bucking the mostly negative action in the broader market. See the latest FSU analysis for more details and a new annotated graph.
12/16/2011 4:50:04 PM - Y - Up today with near average volume, finishing at its second best close of all-time. See the latest FSU analysis for more details and a new annotated graph.
12/15/2011 5:39:22 PM - Y - Encountered distributional pressure today and ended the session near its low with a loss on slightly higher (above average) volume. See the latest FSU analysis for more details and a new annotated graph.
12/14/2011 6:03:42 PM - Y - Posted a small gain today with higher (near average) volume, bucking the mostly negative broader market. Still hovering near its 52-week high with volume totals recently cooling. Proof of serious institutional demand requires at least +50% heavier than average volume behind a meaningful gain.
12/9/2011 3:48:47 PM - Y - Still hovering near its 52-week high with volume totals recently cooling. Proof of serious institutional demand requires at least +50% heavier than average volume behind a meaningful gain.
12/7/2011 6:38:53 PM - Y - Still perched near its 52-week high. Proof of serious institutional demand requires at least +50% heavier than average volume behind a meaningful gain.
11/30/2011 12:48:14 PM - Y - Gapped up today challenging its 52-week high without great volume conviction helping it rally. Proof of serious institutional demand requires at least +50% heavier than average volume behind a meaningful gain.
11/28/2011 7:53:33 PM - Y - Gap up gain today with below average volume helped it rally above its 50 DMA line, improving its technical stance, and its color code its changed to yellow.
11/25/2011 3:32:23 PM - G - Down today on lighter volume while slumping further below its 50 DMA line. Color code is changed to green after violating the previously noted chart support triggering a more worrisome technical sell signal.
11/18/2011 5:51:25 PM - Y - Down today on lighter volume finishing near its 50 DMA line previously noted as near-term chart support to watch. A violation of that important short-term average line would trigger more worrisome technical sell signals.
11/17/2011 7:08:02 PM - Y - Loss today led to a slump near its 50 DMA line previously noted as near-term chart support to watch. A violation of that important short-term average line would trigger more worrisome technical sell signals.
11/16/2011 6:14:30 PM - Y - Small loss today with light volume, slumping back below its pivot point. Perched within close striking distance of its 52-week high, yet it did not trigger a proper new technical buy signal since recently highlighted in yellow as an ideal looking set-up. A volume-driven gain to new highs would be a reassuring sign of institutional buying demand. Meanwhile, its 50 DMA line defines near-term chart support to watch.
11/11/2011 2:13:05 PM - Y - Today's gain with light volume has it inching above its pivot point and poised for possibly its best close ever. Perched within close striking distance of its 52-week high, yet it did not trigger a proper new technical buy signal since recently highlighted in yellow as an ideal looking set-up. A volume-driven gain to new highs would be a reassuring sign of institutional buying demand. Meanwhile, its 50 DMA line defines near-term chart support to watch.
11/8/2011 7:28:35 PM - Y - Today's gain on near average volume led to its second best close ever. Still perched within close striking distance of its 52-week high, it did not trigger a proper new technical buy signal since recently highlighted in yellow as an ideal looking set-up. Its 50 DMA line defines near-term chart support to watch.
11/4/2011 6:44:31 PM - Y - Quietly hovering within close striking distance of its 52-week high. It did not trigger a proper new technical buy signal since recently highlighted in yellow as an ideal looking set-up. Its 50 DMA line defines near-term chart support to watch.
11/2/2011 6:14:33 PM - Y - Finished in the lower third of its intra-day range today after encountering more distributional pressure. It did not trigger a proper new technical buy signal since recently highlighted in yellow as an ideal looking set-up. Its 50 DMA line defines near-term chart support to watch.
11/1/2011 5:24:37 PM - Y - Gapped down today for a damaging loss on above average volume indicative of distributional pressure. It did not trigger a proper new technical buy signal since recently highlighted in yellow as an ideal looking set-up. Its 50 DMA line defines near-term chart support to watch.
10/31/2011 6:40:46 PM - Y - Reversed into the red again today after touching a new 52-week high and briefly trading above its pivot point. It did not trigger a proper new technical buy signal since recently highlighted in yellow as an ideal looking set-up. Reported earnings +34% on +13% sales revenues for the quarter ended September 30, 2011 versus the year ago period, beating earnings expectations while it missed on revenues.
10/28/2011 6:52:24 PM - Y - Inched to a new 52-week high and traded above its pivot point today, however volume was near average, not heavy enough to trigger a proper new technical buy signal. Reported earnings +34% on +13% sales revenues for the quarter ended September 30, 2011 versus the year ago period, beating earnings expectations while it missed on revenues.
10/28/2011 1:55:26 PM - Y - Inching to a new 52-week high and trading above its pivot point today. Reported earnings +34% on +13% sales revenues for the quarter ended September 30, 2011 versus the year ago period, beating earnings expectations while it missed on revenues.
10/27/2011 2:03:49 PM - Y - Reported earnings +34% on +13% sales revenues for the quarter ended September 30, 2011 versus the year ago period, beating earnings expectations while it missed on revenues. See the latest FSU analysis for more details and a new annotated weekly graph illustrating the latest base.
10/26/2011 5:53:49 PM - Y - Rebounded from an early loss today for a positive reversal and gain with above average volume. Reported results for the quarter ended September 30, 2011 after the close and earnings reportedly beat expectations while it missed on revenues. See the latest FSU analysis for more details and a new annotated weekly graph illustrating the latest base.
10/25/2011 7:09:18 PM - Y - Down today with higher but still below average volume. A new pivot point was cited based on its 52-week high plus 10 cents and its color code was changed to yellow. Subsequent volume-driven gains may trigger a new technical buy signal. See the latest FSU analysis for more details and a new annotated weekly graph illustrating the latest base.
10/24/2011 6:34:58 PM - Y - New pivot point is cited based on its 52-week high plus 10 cents and its color code is changed to yellow. Subsequent volume-driven gains may trigger a new technical buy signal. See the latest FSU analysis for more details and a new annotated weekly graph illustrating the latest base.
10/20/2011 6:32:53 PM - G - Posted a small gain today with lighter than average volume after a damaging distribution day on the prior session. Choppy action in recent weeks is not recognized as a sound base pattern.
10/18/2011 4:24:04 PM - G - Gain today with lighter than average volume leaves it perched near its all-time high. Choppy action in recent weeks is not recognized as a sound base pattern.
10/17/2011 4:09:40 PM - G - Pulled back quietly today after 5 consecutive gains with lighter than average volume. Choppy action in recent weeks is not recognized as a sound base pattern.
10/14/2011 3:18:02 PM - G - Up again today for a 5th consecutive gain with lighter than average volume, poised for a best-ever close. Choppy action in recent weeks is not recognized as a sound base pattern.
10/12/2011 5:46:13 PM - G - Up again today for a 3rd consecutive gain with lighter than average volume while rebounding further above its 50 DMA line. See the latest FSU analysis for more details and a new annotated graph.
10/11/2011 6:06:05 PM - G - Up again today with light volume while rebounding further above its 50 DMA line. See the latest FSU analysis for more details and a new annotated graph.
10/10/2011 4:38:46 PM - G - Rebounding above its 50 DMA line which recently began sloping downward. See the latest FSU analysis for more details and a new annotated graph.
10/7/2011 6:54:32 PM - G - Perched near its 50 DMA line which recently began sloping downward. It recently stalled after rallying to a new all-time high. Mastercard Inc (MA), its peer in the Finance - Credit Card/Payment Processing group, remains below its 50 DMA line after recently dropped from the Featured Stocks list.
10/6/2011 5:34:14 PM - G - Following a positive reversal on 10/04/11 its subsequent 2 gains have lacked volume conviction. Today's gain helped it rise above its 50 DMA line which recently began sloping downward. It recently stalled after rallying to a new all-time high. Mastercard Inc (MA), its peer in the Finance - Credit Card/Payment Processing group, remains below its 50 DMA line after recently dropped from the Featured Stocks list.
10/4/2011 7:30:27 PM - G - Managed a positive reversal today. Recent losses violated its 50 DMA line raising concerns. Color code was changed to green, meanwhile a prompt rebound above its short-term average is needed for its outlook to improve. It recently stalled after rallying to a new all-time high.
9/30/2011 7:48:38 PM - G - Loss today on lighter than average volume violated its 50 DMA line raising concerns. Color code is changed to green, meanwhile a prompt rebound above its short-term average is needed for its outlook to improve. It recently stalled after rallying to a new all-time high.
9/27/2011 8:12:18 PM - Y - Consolidating quietly just under its pivot point and above important support at its 50 DMA line. It recently stalled after rallying to a new all-time high.
9/22/2011 1:20:12 PM - Y - Up from earlier lows after a gap down today amid widespread market weakness. It raised concerns by abruptly diving back into its prior base and testing support at its 50 DMA line. See the latest FSU analysis for more details and an annotated daily graph.
9/22/2011 10:03:41 AM - Y - Gapped down today amid widespread market weakness, raising concerns while abruptly diving back into its prior base and testing support at its 50 DMA line. See the latest FSU analysis for more details and an annotated daily graph.
9/21/2011 7:12:54 PM - Y - Pulled back today with volume near average. Its considerable gain for a new all-time high with volume +54% above average helped it break out from an 11-week base and trigger a technical buy signal on the prior session. See the latest FSU analysis for more details and an annotated daily graph.
9/20/2011 1:45:26 PM - Y - Considerable gain today for a new all-time high with volume running at an above average pace, clearing an 11-week base during which it found impressive support near its 200 DMA line. Color code is changed to yellow with pivot point based on its 7/07/11 high plus 10 cents. Quarterly and annual earnings history has been strong.