5/13/2019 5:16:22 PM - Gapped down for a 3rd consecutive session today after prior losses triggered technical sell signals. A rebound above the 50 DMA line ($155) is needed for its outlook to improve. It will be dropped from the Featured Stocks list tonight. Recently reported earnings +29% on +14% sales revenues for the Mar '19 quarter.
5/10/2019 10:20:06 AM - G - Reported earnings +29% on +14% sales revenues for the Mar '19 quarter. Gapped down for a 2nd consecutive session today violating its 50 DMA line ($156) and abruptly undercutting the prior high ($148.68 on 2/27/19) triggering technical sell signals. A rebound above the 50 DMA line is needed for its outlook to improve.
5/9/2019 1:12:58 PM - G - Today's volume-driven loss undercut its 50 DMA line ($156) and nearly tested the prior high ($148.68 on 2/27/19) defining near-term support to watch. Due to report earnings news. Volume and volatility often increase near earnings news.
5/7/2019 6:12:41 PM - G - Due to report earnings news on 5/08/19. Volume and volatility often increase near earnings news. Pulling back from its all-time high after getting very extended from any sound base. Its 50 DMA line ($155) and prior high ($148.68 on 2/27/19) define near-term support to watch. Fundamentals remain strong.
5/6/2019 6:33:05 PM - G - Churned above average volume today yet remains perched near its all-time high, very extended from any sound base. Its 50 DMA line ($155) and prior high ($148.68 on 2/27/19) define near-term support to watch. Fundamentals remain strong.
4/29/2019 5:51:03 PM - G - Hovering near its all-time high, very extended from any sound base. Its 50 DMA line ($152) and prior high ($148.68 on 2/27/19) define near-term support to watch. Fundamentals remain strong.
4/25/2019 1:15:11 PM - G - Pulling back from its all-time high after getting very extended from any sound base. Its 50 DMA line ($150.70) and prior high ($148.68 on 2/27/19) define near-term support to watch. Fundamentals remain strong.
4/24/2019 5:47:34 PM - G - Perched at its all-time high, very extended from any sound base after a big rally. Its 50 DMA line ($150) and prior high ($148.68 on 2/27/19) define near-term support to watch. Fundamentals remain strong.
4/17/2019 5:39:55 PM - G - Reversed into the red for a loss today on higher volume after hitting another new all-time high, breaking a streak of 5 consecutive gains backed by average of lighter volume. Extended from any sound base after a big rally. Its prior high ($148.68 on 2/27/19) and its 50 DMA line ($145.87) define near-term support to watch. Fundamentals remain strong.
4/12/2019 5:01:45 PM - G - Hit a new all-time high with today's 3rd consecutive gain backed by lighter volume. Extended from any sound base, but held its ground stubbornly after a big rally. Its 50 DMA line ($142) and prior low ($136.08 on 3/08/19) define near-term support to watch on pullbacks. Fundamentals remain strong. See the latest FSU analysis for more details and a new annotated graph.
4/9/2019 4:00:49 PM - G - Stubbornly holding its ground perched near its all-time high with volume totals cooling. It did not form a sound base of sufficient length but held its ground stubbornly after a big rally. Its 50 DMA line ($139) and prior low ($136.08 on 3/08/19) define near-term support to watch. Fundamentals remain strong.
4/2/2019 6:09:25 PM - G - Hit yet another new all-time high with today's 4th consecutive volume-driven gain. It did not form a sound base of sufficient length but held its ground stubbornly after a big rally. Its prior low ($136.08 on 3/08/19) and 50 DMA line ($133.51) define near-term support to watch. Fundamentals remain strong.
3/28/2019 1:18:04 PM - G - Hit a new all-time high with today's volume-driven gain. It did not form a sound base of sufficient length but held its ground stubbornly after a big rally. Its 50 DMA line ($130.50) defines near-term support to watch above prior highs. Fundamentals remain strong.
3/27/2019 6:12:45 PM - G - Churned heavy volume today yet it remains perched near its all-time high, extended from the prior base. Its 50 DMA line ($129.59) defines near-term support to watch above prior highs.Fundamentals remain strong.
3/22/2019 6:51:44 PM - G - Still perched near its all-time high with volume totals cooling, very extended from the prior base. Fundamentals remain strong. Prior high ($115) defines initial support to watch on pullbacks.
3/18/2019 5:59:00 PM - G - Still holding its ground in a tight range perched near its all-time high with volume totals cooling, very extended from the prior base. Fundamentals remain strong. Prior high ($115) defines initial support to watch on pullbacks.
3/12/2019 5:51:52 PM - G - Holding its ground perched near its all-time high with volume totals cooling, very extended from the prior base. Fundamentals remain strong. Prior high ($115) defines initial support to watch on pullbacks.
3/5/2019 8:49:08 PM - G - Stubbornly holding its ground perched near its all-time high, very extended from the prior base. Fundamentals remain strong. Prior high ($115) defines initial support to watch on pullbacks. See the latest FSU analysis for more details and a new annotated graph.
3/4/2019 8:29:58 PM - G - Holding its ground perched near its all-time high, very extended from the prior base. Fundamentals remain strong. Prior high ($115) defines initial support to watch on pullbacks.
2/27/2019 1:56:47 PM - G - Very extended from the prior base with today's 13th consecutive gain. Bullish action came after it reported earnings +75% on +23% sales revenues for the Dec '18 quarter. Prior high ($115) defines initial support to watch on pullbacks.
2/20/2019 5:03:25 PM - G - Rallied further above its "max buy" level with today's 8th consecutive gain. Bullish action came after it reported earnings +75% on +23% sales revenues for the Dec '18 quarter. Prior high ($115) defines initial support to watch on pullbacks.
2/14/2019 6:11:59 PM - G - Rallied further above its "max buy" level with today's 5th consecutive gain. Bullish action came after it reported earnings +75% on +23% sales revenues for the Dec '18 quarter. Prior high ($115) defines initial support to watch on pullbacks.
2/11/2019 1:13:04 PM - G - Color code is changed to green after rallying above its "max buy" level. It was highlighted in yellow with new pivot point cited based on its 12/12/18 high plus 10 cents as its gapped up hitting a new all-time high on the prior session. Bullish action came after it reported earnings +75% on +23% sales revenues for the Dec '18 quarter.
2/8/2019 1:12:18 PM - Y - Color code is changed to yellow with new pivot point cited based on its 12/12/18 high plus 10 cents. Gapped up today hitting a new all-time high. Bullish action came after it reported earnings +75% on +23% sales revenues for the Dec '18 quarter.
2/5/2019 3:59:16 PM - G - Encountering mild distributional pressure today while reversing an early gain. Still quietly consolidating above its 50 DMA line ($105.18). Faces some resistance due to overhead supply up to the $115 level. Prior low ($92.08 on 12/24/18) defines the next important support.
1/31/2019 5:59:57 PM - G - Still quietly consolidating above its 50 DMA line ($105.10). Faces some resistance due to overhead supply up to the $115 level. Prior low ($92.08 on 12/24/18) defines the next important support. See the latest FSU analysis for more details and a new annotated graph.
1/28/2019 5:59:36 PM - G - Still quietly consolidating above its 50 DMA line ($105.18). Faces some resistance due to overhead supply up to the $115 level. Prior low ($92.08 on 12/24/18) defines the next important support. Fundamentals remain strong.
1/22/2019 6:09:58 PM - G - Faces some resistance due to overhead supply up to the $115 level. Quietly consolidating near its 50 DMA line ($104.75). Prior low ($92.08 on 12/24/18) defines the next important support. Fundamentals remain strong.
1/17/2019 5:07:42 PM - G - Posted a gain today with below average volume. A convincing rebound above its 50 DMA line ($104.18) is needed for its outlook to improve. Prior low ($92.08 on 12/24/18) defines the next important support. Fundamentals remain strong. See the latest FSU analysis for more details and an annotated graph.
1/15/2019 5:10:15 PM - G - Posted a small gain today. Color code was changed to green after slumping back below its 50 DMA line ($103.78) on the prior session hurting its outlook. Prior low ($92.08 on 12/24/18) defines the next important support. Fundamentals remain strong. See the latest FSU analysis for more details and a new annotated graph.
1/15/2019 5:07:17 PM - G - Posted a small gain today. Color code was changed to green after slumping back below its 50 DMA line ($103.78) on the prior session hurting its outlook. Prior low ($92.08 on 12/24/18) defines the next important support. Fundamentals remain strong. See the latest FSU analysis for more details and a new annotated graph.
1/14/2019 5:00:32 PM - G - Color code is changed to green after slumping back below its 50 DMA line ($103.58) hurting its outlook. Prior low ($92.08 on 12/24/18) defines the next important support. Fundamentals remain strong.
1/11/2019 5:16:43 PM - Y - Perched near its "max buy" level. Recent rebound above its 50 DMA line ($103.35) helped its outlook improve. Fundamentals remain strong.
1/7/2019 6:39:28 PM - Y - Color code is changed to yellow after rebounding above its 50 DMA line ($101.87) with a light volume gain today helping its outlook to improve. Fundamentals remain strong.
1/4/2019 6:30:42 PM - G - Its 50 DMA line ($101.60) recently acted as resistance. A rebound above the 50 DMA line is needed for its outlook to improve. Fundamentals remain strong. See the latest FSU analysis for more details and an annotated graph.
1/2/2019 7:08:07 PM - G - Halted its slide last week, however, a rebound above the 50 DMA line ($101.26) is still needed for its outlook to improve. Fundamentals remain strong. See the latest FSU analysis for more details and a new annotated graph.
12/28/2018 4:57:53 PM - G - Posted a 3rd consecutive gain today on light volume. A rebound above the 50 DMA line ($100.91) is needed for its outlook to improve.
12/26/2018 4:55:10 PM - G - Posted a gain today on light volume. A rebound above the 50 DMA line ($100.50) is needed for its outlook to improve.
12/21/2018 5:27:03 PM - G - Slumped further below its 50 DMA line ($100.08) with today's 7th consecutive loss. A rebound above the 50 DMA line is needed for its outlook to improve.
12/19/2018 6:05:29 PM - G - Color code is changed to green after undercutting the prior high ($101.33 on 9/25/18) as today's 5th consecutive loss also led to a close below its 50 DMA line ($99.66).
12/17/2018 5:42:04 PM - Y - Pulled back below its "max buy" level with today's 3rd consecutive loss and its color code is changed to yellow. Prior high ($101.33 on 9/25/18) defines initial support to watch above its 50 DMA line ($99.28).
12/12/2018 5:32:32 PM - G - Posted a gain today with higher (near average) volume for a best-ever close. Prior high ($101.33 on 9/25/18) defines initial support to watch on pullbacks.
12/11/2018 6:34:19 PM - G - Volume totals have been cooling while consolidating above its "max buy" level near its all-time high. Prior high ($101.33 on 9/25/18) defines initial support to watch on pullbacks. See the latest FSU analysis for more details and a new annotated graph.
12/7/2018 5:17:47 PM - G - Retreated from its all-time high with recent losses on lighter volume. Prior high ($101.33 on 9/25/18) defines initial support to watch on pullbacks.
12/4/2018 5:34:09 PM - G - Retreated from its all-time high with a big loss today on lighter volume. Prior high ($101.33 on 9/25/18) defines initial support to watch on pullbacks.
12/3/2018 5:33:59 PM - G - Posted a gain today with above average volume for a new all-time high. Prior high ($101.33 on 9/25/18) defines initial support to watch on pullbacks.
11/27/2018 6:34:57 PM - G - Volume totals have been cooling while still stubbornly holding its ground near its all-time high. Prior high ($101.33 on 9/25/18) defines initial support to watch on pullbacks.
11/20/2018 1:12:16 PM - G - After intra-day lows today briefly undercut its "max buy" level it is still stubbornly holding its ground near its all-time high. Disciplined investors avoid chasing stocks more than +5% above the pivot point. Prior high ($101.33 on 9/25/18) defines initial support to watch on pullbacks.
11/14/2018 1:28:57 PM - G - Color code is changed to green while trading above its "max buy" level and near its all-time high. Disciplined investors avoid chasing stocks more than +5% above the pivot point. Prior high ($101.33 on 9/25/18) defines initial support to watch on pullbacks.
11/12/2018 6:47:16 PM - Y - Pulled back today below its "max buy" level. Quickly got extended and finished strong after highlighted in yellow in the 11/09/18 mid-day report with new pivot point cited based on its 9/25/18 high plus 10 cents. Reported earnings +27% on +15% sales revenues for the Sep '18 quarter, marking its 3rd consecutive quarterly comparison above the +25% minimum earnings guideline (C criteria), helping it better match the fact-based investment system's fundamental guidelines. After a small downturn in FY '15 its annual earnings (A criteria) growth has been strong. See the latest FSU analysis for more details and a new annotated graph.
11/12/2018 3:12:17 PM - Y - Pulling back today near its "max buy" level. Quickly got extended and finished strong after highlighted in yellow in the 11/09/18 mid-day report with new pivot point cited based on its 9/25/18 high plus 10 cents. Reported earnings +27% on +15% sales revenues for the Sep '18 quarter, marking its 3rd consecutive quarterly comparison above the +25% minimum earnings guideline (C criteria), helping it better match the fact-based investment system's fundamental guidelines. After a small downturn in FY '15 its annual earnings (A criteria) growth has been strong.
11/9/2018 1:42:48 PM - Y - Color code is changed to yellow with new pivot point cited based on its 9/25/18 high plus 10 cents. Gapped up today hitting a new all-time high with heavy volume behind its 4th consecutive gain. Reported earnings +27% on +15% sales revenues for the Sep '18 quarter, marking its 3rd consecutive quarterly comparison above the +25% minimum earnings guideline (C criteria), helping it better match the fact-based investment system's fundamental guidelines. After a small downturn in FY '15 its annual earnings (A criteria) growth has been strong.
10/9/2018 12:35:55 PM - Pulled back from its all-time high with today's 4th consecutive loss testing its 50 DMA line ($89.52). Prior mid-day reports repeatedly noted - "Reported earnings +35% on +18% sales revenues for the Jun '18 quarter. Prior quarterly comparisons were not strong and steady above the +25% minimum earnings guideline (C criteria), and fundamental concerns remain. It was dropped from the Featured Stocks list on 5/04/12."
9/24/2018 12:39:17 PM - Perched near its all-time high today following a spurt of volume-driven gains. Prior mid-day reports repeatedly noted - "No resistance remains due to overhead supply and it is perched at its 52-week high. Reported earnings +35% on +18% sales revenues for the Jun '18 quarter. Prior quarterly comparisons were not strong and steady above the +25% minimum earnings guideline (C criteria), and fundamental concerns remain. It was dropped from the Featured Stocks list on 5/04/12."
9/19/2018 12:51:03 PM - Perched near its all-time high today following a spurt of volume-driven gains. Prior mid-day reports repeatedly noted - "No resistance remains due to overhead supply and it is perched at its 52-week high. Reported earnings +35% on +18% sales revenues for the Jun '18 quarter. Prior quarterly comparisons were not strong and steady above the +25% minimum earnings guideline (C criteria), and fundamental concerns remain. It was dropped from the Featured Stocks list on 5/04/12."
9/18/2018 12:49:40 PM - Perched at its all-time high today following 4 consecutive volume-driven gains. Prior mid-day reports repeatedly noted - "No resistance remains due to overhead supply and it is perched at its 52-week high. Reported earnings +35% on +18% sales revenues for the Jun '18 quarter. Prior quarterly comparisons were not strong and steady above the +25% minimum earnings guideline (C criteria), and fundamental concerns remain. It was dropped from the Featured Stocks list on 5/04/12."
9/17/2018 12:46:04 PM - Perched at its all-time high today following 4 consecutive volume-driven gains. Prior mid-day reports repeatedly noted - "No resistance remains due to overhead supply and it is perched at its 52-week high. Reported earnings +35% on +18% sales revenues for the Jun '18 quarter. Prior quarterly comparisons were not strong and steady above the +25% minimum earnings guideline (C criteria), and fundamental concerns remain. It was dropped from the Featured Stocks list on 5/04/12."
9/14/2018 12:57:55 PM - Hitting yet another new all-time high with today's 4th consecutive volume-driven gain. Prior mid-day reports repeatedly noted - "No resistance remains due to overhead supply and it is perched at its 52-week high. Reported earnings +35% on +18% sales revenues for the Jun '18 quarter. Prior quarterly comparisons were not strong and steady above the +25% minimum earnings guideline (C criteria), and fundamental concerns remain. It was dropped from the Featured Stocks list on 5/04/12."
9/13/2018 1:23:40 PM - Hitting yet another new all-time high with today's 3rd consecutive volume-driven gain. Prior mid-day reports repeatedly noted - "No resistance remains due to overhead supply and it is perched at its 52-week high. Reported earnings +35% on +18% sales revenues for the Jun '18 quarter. Prior quarterly comparisons were not strong and steady above the +25% minimum earnings guideline (C criteria), and fundamental concerns remain. It was dropped from the Featured Stocks list on 5/04/12."
9/12/2018 12:51:11 PM - Hitting another new all-time high with today's 2nd consecutive volume-driven gain. Prior mid-day reports repeatedly noted - "No resistance remains due to overhead supply and it is perched at its 52-week high. Reported earnings +35% on +18% sales revenues for the Jun '18 quarter. Prior quarterly comparisons were not strong and steady above the +25% minimum earnings guideline (C criteria), and fundamental concerns remain. It was dropped from the Featured Stocks list on 5/04/12."
9/11/2018 12:35:39 PM - Hitting a new all-time high today. Prior mid-day reports repeatedly noted - "No resistance remains due to overhead supply and it is perched at its 52-week high. Reported earnings +35% on +18% sales revenues for the Jun '18 quarter. Prior quarterly comparisons were not strong and steady above the +25% minimum earnings guideline (C criteria), and fundamental concerns remain. It was dropped from the Featured Stocks list on 5/04/12."
9/6/2018 1:29:33 PM - Prior mid-day reports noted - "No resistance remains due to overhead supply and it is perched at its 52-week high. Reported earnings +35% on +18% sales revenues for the Jun '18 quarter. Prior quarterly comparisons were not strong and steady above the +25% minimum earnings guideline (C criteria), and fundamental concerns remain. It was dropped from the Featured Stocks list on 5/04/12."
9/5/2018 12:40:21 PM - No resistance remains due to overhead supply and it is perched at its 52-week high. Reported earnings +35% on +18% sales revenues for the Jun '18 quarter. Prior quarterly comparisons were not strong and steady above the +25% minimum earnings guideline (C criteria), and fundamental concerns remain. It was dropped from the Featured Stocks list on 5/04/12.
8/29/2018 1:02:47 PM - No resistance remains due to overhead supply but there was a "negative reversal" after it touched a new 52-week high today. Reported earnings +35% on +18% sales revenues for the Jun '18 quarter. Prior quarterly comparisons were not strong and steady above the +25% minimum earnings guideline (C criteria), and fundamental concerns remain. It was dropped from the Featured Stocks list on 5/04/12.
8/24/2018 1:10:50 PM - Meeting resistance at its 50 DMA line ($84.89) when trying to rebound. Since a noted "negative reversal" on 6/20/18 at its 52-week high it went through a choppy consolidation. Reported earnings +35% on +18% sales revenues for the Jun '18 quarter. Prior quarterly comparisons were not strong and steady above the +25% minimum earnings guideline (C criteria), and fundamental concerns remain. It was dropped from the Featured Stocks list on 5/04/12.
7/10/2018 1:11:28 PM - Found support above its 50 DMA line during the consolidation since a noted "negative reversal" on 6/20/18 at its 52-week high. Went through a choppy consolidation then rebounded impressively since noted in the 1/24/18 mid-day report - "Prior quarterly comparisons were below the +25% minimum earnings guideline (C criteria) and fundamental concerns remain. It was dropped from the Featured Stocks list on 5/04/12."
6/22/2018 1:16:27 PM - There was a "negative reversal" on 6/20/18 after reaching another new 52-week high. Went through a choppy consolidation then rebounded impressively since last noted in the 1/24/18 mid-day report - "Prior quarterly comparisons were below the +25% minimum earnings guideline (C criteria) and fundamental concerns remain. It was dropped from the Featured Stocks list on 5/04/12."
1/24/2018 1:14:24 PM - Hit another new 52-week high today then reversed into the red. Found support near its 50 DMA line and then showed bullish action since noted with caution in the 12/18/17 mid-day report - "Reported earnings +16% on +20% sales revenues for the Sep '17 quarter. Prior quarterly comparisons were below the +25% minimum earnings guideline (C criteria) and fundamental concerns remain. It was dropped from the Featured Stocks list on 5/04/12."
1/12/2018 12:44:13 PM - Touched another new 52-week high on the prior session. Found support near its 50 DMA line and then showed bullish action since last noted with caution in the 12/18/17 mid-day report - "Reported earnings +16% on +20% sales revenues for the Sep '17 quarter. Prior quarterly comparisons were below the +25% minimum earnings guideline (C criteria) and fundamental concerns remain. It was dropped from the Featured Stocks list on 5/04/12."
12/18/2017 1:05:16 PM - Hitting a new 52-week high today. Found support near its 50 DMA line last week. Reported earnings +16% on +20% sales revenues for the Sep '17 quarter. Prior quarterly comparisons were below the +25% minimum earnings guideline (C criteria) and fundamental concerns remain. It was dropped from the Featured Stocks list on 5/04/12.
9/5/2017 12:42:46 PM - Undercutting its 50 DMA line today, adding to a spurt of damaging losses marked by above average volume. Noted with caution in prior mid-day reports - "Reported earnings +9% on +23% sales revenues for the Jun '17 quarter. Prior quarterly comparisons were below the +25% minimum earnings guideline (C criteria) and fundamental concerns remain. It was dropped from the Featured Stocks list on 5/04/12."
8/28/2017 1:40:49 PM - Pulling back from its all-time high with a streak of losses on ever-increasing volume. Last noted with caution in the 8/04/17 mid-day report - "Reported earnings +9% on +23% sales revenues for the Jun '17 quarter. Prior quarterly comparisons were below the +25% minimum earnings guideline (C criteria) and fundamental concerns remain. It was dropped from the Featured Stocks list on 5/04/12."
8/4/2017 12:50:12 PM - Reported earnings +9% on +23% sales revenues for the Jun '17 quarter. Gapped up on the prior session hitting a new all-time high. Prior quarterly comparisons were below the +25% minimum earnings guideline (C criteria) and fundamental concerns remain. It was dropped from the Featured Stocks list on 5/04/12.
2/10/2017 12:58:50 PM - Reported earnings +24% on +32% sales revenues for the Dec '16 quarter. Gapped down today violating its 50 DMA line with a damaging volume-driven loss. The 2/09/17 mid-day report cautioned members - "It has been recently wedging into new all-time high territory with gains lacking great volume conviction. Found support near its 50 DMA line during its ongoing ascent in recent months. Reported earnings +55% on +35% sales revenues for the Sep '16 quarter, marking its 3rd consecutive quarterly comparisons above the +25% minimum guideline (C criteria). Fundamental concerns remain due to its up and down annual earnings (A criteria) history. It was dropped from the Featured Stocks list on 5/04/12."
2/9/2017 12:37:22 PM - Hit a new 52-week high today and it has been recently wedging into new all-time high territory with gains lacking great volume conviction. Found support near its 50 DMA line during its ongoing ascent in recent months. Reported earnings +55% on +35% sales revenues for the Sep '16 quarter, marking its 3rd consecutive quarterly comparisons above the +25% minimum guideline (C criteria). Fundamental concerns remain due to its up and down annual earnings (A criteria) history. It was dropped from the Featured Stocks list on 5/04/12.
12/22/2016 12:38:53 PM - Hit a new 52-week high today and it has been recently wedging into new all-time high territory with gains lacking great volume conviction. Found support near its 50 DMA line during its ongoing ascent in recent months. Reported earnings +55% on +35% sales revenues for the Sep '16 quarter, marking its 3rd consecutive quarterly comparisons above the +25% minimum guideline (C criteria). Fundamental concerns remain due to its up and down annual earnings (A criteria) history. It was dropped from the Featured Stocks list on 5/04/12.
10/13/2016 10:55:20 AM - Abruptly retreating from its 52-week high and violated its 50 DMA line with a big volume-driven loss. Prior mid-day reports cautioned - "Reported earnings +38% on +28% sales revenues for the Jun '16 quarter but fundamental concerns remain. Survived but failed to impress since dropped from the Featured Stocks list on 5/04/12."
10/12/2016 12:27:12 PM - Abruptly retreating from its 52-week high and violating its 50 DMA line with today's big volume-driven loss. Prior mid-day reports cautioned - "Reported earnings +38% on +28% sales revenues for the Jun '16 quarter but fundamental concerns remain. Survived but failed to impress since dropped from the Featured Stocks list on 5/04/12."
9/15/2016 12:28:21 PM - Touching a new 52-week high today. Held its ground stubbornly after considerable volume-driven gains. Last noted with caution in the 8/08/16 mid-day report - "Reported earnings +38% on +28% sales revenues for the Jun '16 quarter but fundamental concerns remain. Survived but failed to impress since dropped from the Featured Stocks list on 5/04/12."
8/8/2016 1:00:46 PM - Gapped up on the prior session hitting a new 52-week high with a considerable volume-driven gain, but the 8/05/16 mid-day report cautioned members - "Reported earnings +38% on +28% sales revenues for the Jun '16 quarter but fundamental concerns remain. Survived but failed to impress since dropped from the Featured Stocks list on 5/04/12."
8/5/2016 12:55:04 PM - Gapped up today hitting a new 52-week high. Reported earnings +38% on +28% sales revenues for the Jun '16 quarter but fundamental concerns remain. Survived but failed to impress since dropped from the Featured Stocks list on 5/04/12.
7/25/2016 12:16:29 PM - Undercut its 50 DMA line then rebounded and rallied to new highs since last noted with caution in the 6/08/16 mid-day report - "Faces resistance due to overhead supply. Reported earnings +34% on +14% sales revenues for the Mar '16 quarter. Reported +9% earnings on +6% sales revenues for the Dec '15 quarter and fundamental concerns remain. Survived but failed to impress since dropped from the Featured Stocks list on 5/04/12."
6/8/2016 11:59:23 AM - Perched at its 52-week high. Following a 5/06/16 gap up and volume-driven gain it was noted - "Faces resistance due to overhead supply. Reported earnings +34% on +14% sales revenues for the Mar '16 quarter. Reported +9% earnings on +6% sales revenues for the Dec '15 quarter and fundamental concerns remain. Survived but failed to impress since dropped from the Featured Stocks list on 5/04/12."
5/24/2016 1:15:56 PM - Hitting a new 52-week high with higher volume behind today's 5th consecutive gain. Following a 5/06/16 gap up and volume-driven gain it was noted - "Faces resistance due to overhead supply. Reported earnings +34% on +14% sales revenues for the Mar '16 quarter. Reported +9% earnings on +6% sales revenues for the Dec '15 quarter and fundamental concerns remain. Survived but failed to impress since dropped from the Featured Stocks list on 5/04/12."
5/23/2016 12:35:16 PM - Holding its ground perched near its 52-week high since last noted on 5/06/16 after a big gap up and volume-driven gain - "Faces resistance due to overhead supply. Reported earnings +34% on +14% sales revenues for the Mar '16 quarter. Reported +9% earnings on +6% sales revenues for the Dec '15 quarter and fundamental concerns remain. Survived but failed to impress since dropped from the Featured Stocks list on 5/04/12."
5/6/2016 1:20:00 PM - Hitting a new 52-week high with today's gap up and volume-driven gain, but it faces resistance due to overhead supply. Reported earnings +34% on +14% sales revenues for the Mar '16 quarter. Prior mid-day reports cautioned members - "Reported +9% earnings on +6% sales revenues for the Dec '15 quarter and fundamental concerns remain. Survived but failed to impress since dropped from the Featured Stocks list on 5/04/12."
5/3/2016 1:00:37 PM - Hovering near its 52-week high, but prior mid-day reports cautioned members - "Reported +9% earnings on +6% sales revenues for the Dec '15 quarter and fundamental concerns remain. Survived but failed to impress since dropped from the Featured Stocks list on 5/04/12."
5/2/2016 1:02:15 PM - Hovering near its 52-week high, holding its ground since the 4/27/16 mid-day report cautioned members - "Reported +9% earnings on +6% sales revenues for the Dec '15 quarter and fundamental concerns remain. Survived but failed to impress since dropped from the Featured Stocks list on 5/04/12."
4/27/2016 1:32:22 PM - Perched near its 52-week high today. Reported +9% earnings on +6% sales revenues for the Dec '15 quarter and fundamental concerns remain. Survived but failed to impress since dropped from the Featured Stocks list on 5/04/12.
3/14/2014 12:34:59 PM - Perched near its 52-week high today's following a "negative reversal" on the prior session. Held its ground above its 50 DMA line while consolidating and enduring distributional pressure since noted with caution in the 2/18/14 mid-day report - "Reported strong sales revenues and earnings increases in the Sep and Dec '13 quarterly comparisons, but fundamental concerns remain as prior quarterly earnings were sub par (C criteria). It went through a deep consolidation then rebounded since dropped from the Featured Stocks list on 5/04/12. Damaging technical action had negated its breakout with a gap down on 5/02/12 as it violated its recent lows and undercut its 50 DMA line triggering sell signals with its largest point loss on the highest volume ever."
3/13/2014 12:38:05 PM - Hitting a new 52-week high with today's 3rd consecutive volume-driven gain. Held its ground above its 50 DMA line while consolidating and enduring distributional pressure since noted with caution in the 2/18/14 mid-day report - "Reported strong sales revenues and earnings increases in the Sep and Dec '13 quarterly comparisons, but fundamental concerns remain as prior quarterly earnings were sub par (C criteria). It went through a deep consolidation then rebounded since dropped from the Featured Stocks list on 5/04/12. Damaging technical action had negated its breakout with a gap down on 5/02/12 as it violated its recent lows and undercut its 50 DMA line triggering sell signals with its largest point loss on the highest volume ever."
3/12/2014 12:36:24 PM - Held its ground above its 50 DMA line while consolidating and enduring distributional pressure since noted with caution in the 2/18/14 mid-day report - "Reported strong sales revenues and earnings increases in the Sep and Dec '13 quarterly comparisons, but fundamental concerns remain as prior quarterly earnings were sub par (C criteria). It went through a deep consolidation then rebounded since dropped from the Featured Stocks list on 5/04/12. Damaging technical action had negated its breakout with a gap down on 5/02/12 as it violated its recent lows and undercut its 50 DMA line triggering sell signals with its largest point loss on the highest volume ever."
3/11/2014 12:54:54 PM - Held its ground above its 50 DMA line while consolidating and enduring distributional pressure since last noted with caution in the 2/18/14 mid-day report - "Reported strong sales revenues and earnings increases in the Sep and Dec '13 quarterly comparisons, but fundamental concerns remain as prior quarterly earnings were sub par (C criteria). It went through a deep consolidation then rebounded since dropped from the Featured Stocks list on 5/04/12. Damaging technical action had negated its breakout with a gap down on 5/02/12 as it violated its recent lows and undercut its 50 DMA line triggering sell signals with its largest point loss on the highest volume ever."
2/18/2014 12:48:43 PM - Hitting a new 52-week high with today's volume-driven gain. Reported strong sales revenues and earnings increases in the Sep and Dec '13 quarterly comparisons, but fundamental concerns remain as prior quarterly earnings were sub par (C criteria). It went through a deep consolidation then rebounded since dropped from the Featured Stocks list on 5/04/12. Damaging technical action had negated its breakout with a gap down on 5/02/12 as it violated its recent lows and undercut its 50 DMA line triggering sell signals with its largest point loss on the highest volume ever.
5/4/2012 1:28:33 PM - It will be dropped from the Featured Stocks list tonight. Damaging technical action negated its breakout with a gap down on 5/02/12 as it violated its recent lows and undercut its 50 DMA line triggering sell signals with its largest point loss on the highest volume ever.
5/3/2012 6:23:21 PM - G - Held its ground today but failed to rebound above its 50 DMA line and its color code is changed to green. Reported earnings +100% on +79% sales revenues for the quarter ended March 31, 2012 versus the year ago period. Gapped down on 5/02/12 and violated its recent lows then quickly undercut its 50 DMA line, raising concerns and triggering technical sell signals with its largest point loss on the highest volume ever. The prior gain backed by more than 3 times average volume had confirmed a technical buy signal as it rallied from an advanced "ascending base" pattern. Volume and volatility often increase near earnings news.
5/2/2012 3:56:32 PM - G - Reported earnings +100% on +79% sales revenues for the quarter ended March 31, 2012 versus the year ago period. Gapped down today and violated its recent lows then quickly undercut its 50 DMA line, raising concerns and triggering a technical sell signal with its largest point loss on the highest volume ever. The prior gain backed by more than 3 times average volume had confirmed a technical buy signal as it rallied from an advanced "ascending base" pattern. Volume and volatility often increase near earnings news.
5/2/2012 10:10:16 AM - Y - Gapped down today and slumped near recent lows after reporting earnings +100% on +79% sales revenues for the quarter ended March 31, 2012 versus the year ago period. The prior gain backed by more than 3 times average volume had confirmed a technical buy signal as it rallied from an advanced "ascending base" pattern. Volume and volatility often increase near earnings news. The prior low ($30.25 on 4/09/12) defines initial support above its 50 DMA line.
5/1/2012 6:26:05 PM - Y - Hit a new 52-week high with today's gain backed by more than 3 times average volume confirming a technical buy signal. Volume-driven gains helped it rally above the pivot point of the previously noted advanced "ascending base" pattern. Prior low ($30.25 on 4/09/12) defines initial support above its 50 DMA line.
5/1/2012 12:44:18 PM - Y - Challenging its 52-week high with another gain today backed by above average volume, rising back above the pivot point of previously noted advanced "ascending base" pattern. Prior low ($30.25 on 4/09/12) defines initial support above its 50 DMA line.
4/30/2012 1:18:31 PM - Y - Today's loss has it slumping under the pivot point which it had technically cleared with its prior gain backed by +75% above average volume, rising from the previously noted advanced "ascending base" pattern. Prior low ($30.25 on 4/09/12) defines initial support above its 50 DMA line.
4/27/2012 3:51:44 PM - Y - Rallying today with +47% above average volume thus far, trading above its pivot point within close striking distance of its best-ever close. Formed an advanced "ascending base" pattern marked by 3 pullbacks of 10-20% following its previous breakout. Prior low ($30.25 on 4/09/12) defines initial support above its 50 DMA line.
4/26/2012 4:03:34 PM - Y - Up today with higher (near average) volume, finishing the session -8.3% off its all-time high. Formed an advanced "ascending base" pattern marked by 3 pullbacks of 10-20% following its previous breakout. Prior low ($30.25 on 4/09/12) defines initial support above its 50 DMA line.
4/23/2012 2:33:14 PM - Y - Still pulling back from its all-time high. Formed an advanced "ascending base" pattern marked by 3 pullbacks of 10-20% following its previous breakout. Prior low ($30.25 on 4/09/12) defines initial support above its 50 DMA line.
4/20/2012 6:01:58 PM - Y - Pulling back from an all-time high hit last week. Formed an advanced "ascending base" pattern marked by 3 pullbacks of 10-20% following its previous breakout. See the latest FSU analysis for more details and a new annotated graph.
4/16/2012 1:51:18 PM - Y - Pulling back today from high today from an all-time high hit on the prior session. Its color code was changed to yellow with new pivot point cited based on its 3/26/12 high plus 10 cents after forming an advanced "ascending base" pattern marked by 3 pullbacks of 10-20% following its previous breakout. A volume-driven gain did not yet trigger a proper new (or add-on) technical buy signal.
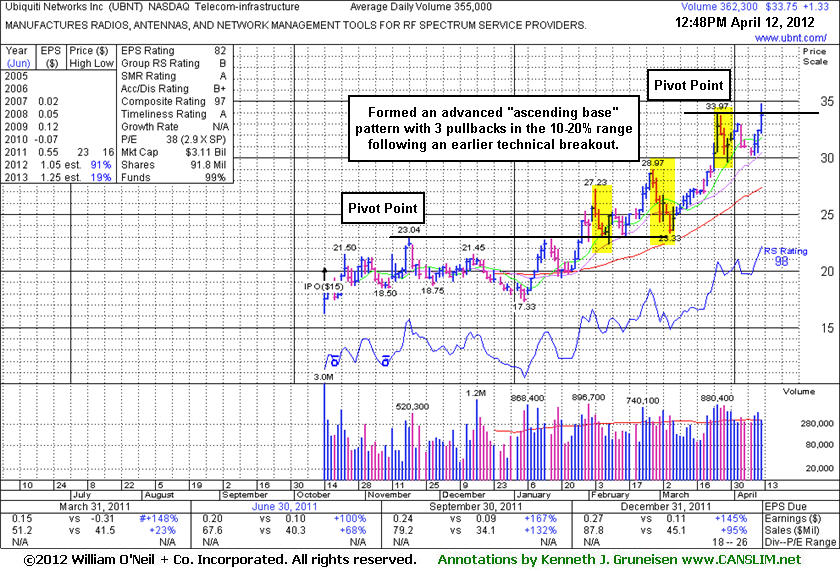
4/12/2012 12:52:50 PM - Y - Hit another new high today. Its color code is changed to yellow with new pivot point cited based on its 3/26/12 high plus 10 cents after forming an advanced "ascending base" pattern marked by 3 pullbacks of 10-20% following its previous breakout. A strong finish may trigger a new (or add-on) technical buy signal.
4/12/2012 11:46:00 AM - Y - Hit another new high today. Its color code is changed to yellow with new pivot point cited based on its 3/26/12 high plus 10 cents after forming an advanced "ascending base" pattern marked by 3 pullbacks of 10-20% following its previous breakout. A strong finish may trigger a new (or add-on) technical buy signal.
4/11/2012 5:00:21 PM - G - Posted a solid gain on higher volume. It is extended from the previous base. Its 50 DMA line defines important near-term support to watch on pullbacks.
4/10/2012 6:04:47 PM - G - Posted a gain on higher volume today, bucking widespread market weakness. It is extended from the previous base. Its 50 DMA line defines important near-term support to watch on pullbacks.
4/4/2012 10:56:34 AM - G - Pulling back today amid widespread market weakness. It is extended from the previous base. Its 50 DMA line defines important near-term support to watch on pullbacks.
3/30/2012 12:33:51 PM - G - Perched near its 52-week high today, extended from the previous base. Its 50 DMA line defines important near-term support to watch on pullbacks.
3/28/2012 5:12:43 PM - G - Pulled back today for a second consecutive loss on above average volume after hitting a new 52-week high on Monday. It is extended from the previous base, and its 50 DMA line defines important near-term support to watch on pullbacks.
3/27/2012 5:04:50 PM - G - Pulled back today after hitting a new 52-week high on the prior session. It is extended from the previous base, and its 50 DMA line defines important near-term support to watch on pullbacks.
3/26/2012 1:21:51 PM - G - Considerable volume-driven gain again today for another new 52-week high, getting more extended from the previous base. Its 50 DMA line defines important near-term support to watch on pullbacks.
3/23/2012 9:04:37 PM - G - Rallied for a new 52-week high today with a solid gain backed by more than twice its daily average volume, getting more extended from the previous base. Its 50 DMA line defines important near-term support to watch on pullbacks.
3/21/2012 6:15:07 PM - G - Rallied for a best-ever close and challenged its 52-week high today with a solid gain backed by +58% above average volume. Its color code is changed to green after rallying well above its previously cited "max buy" level. See the latest FSU analysis for more details and a new annotated graph.
3/16/2012 6:00:32 PM - Y - Quietly consolidating within close striking distance of its 52-week high. They teach in the Certification that a stock may be bought from its 10-week moving average (WMA) up to +5% above the latest high (in this case $28.97 on 2/28/12 plus another 5%) following an earlier technical breakout.
3/12/2012 6:24:28 PM - Y - Up today below above average for a 4th consecutive gain, closing further above its previously noted "max buy" level. No new pivot point was cited and it remained color coded yellow, as they teach in the Certification that a stock may be bought from its 10-week moving average (WMA) up to +5% above the latest high ($28.97 on 2/28/12 plus another 5%) following an earlier technical breakout.
3/7/2012 6:02:21 PM - Y - Up today with lighter (yet still above average) volume, closing back above its "max buy" level. No new pivot point is cited and it remains color coded yellow, as they teach in the Certification that a stock may be bought from its 10-week moving average (WMA) up to +5% above the latest high ($28.97 on 2/28/12 plus another 5%) following an earlier technical breakout.
3/6/2012 11:22:24 AM - Y - Slumping below its "max buy" level today and its color code is changed to yellow again. While no new pivot point is cited, they teach in the Certification that a stock may be bought from its 10-week moving average (WMA) up to +5% above the latest high ($28.97 on 2/28/12) following an earlier technical breakout.
3/2/2012 1:14:13 PM - G - Rallying today with above average volume following 3 consecutive losses. It is still extended from its prior base. Patient investors may watch for secondary buy points to possibly develop and be noted.
3/1/2012 5:01:06 PM - G - Higher volume was behind today's 3rd consecutive loss, and its close in the lower half of its intra-day range was indicative of distributional pressure. It is still extended from its prior base. Patient investors may watch for secondary buy points to possibly develop and be noted.
2/29/2012 4:36:57 PM - G - Down today for a loss on light volume following recent volume-driven gains. It is too extended from its prior base to be considered buyable under the investment system's guidelines, and patient investors may watch for secondary buy points to possibly develop and be noted.
2/27/2012 1:14:27 PM - G - Hitting another new high today, on track for a 4th consecutive gain. It is too extended from its prior base to be considered buyable under the investment system's guidelines, and patient investors may watch for secondary buy points to possibly develop and be noted.
2/24/2012 3:48:38 PM - G - Hit a new high today, adding to the prior session's considerable volume-driven gain. It is too extended from its prior base to be considered buyable under the investment system's guidelines, and patient investors may watch for secondary buy points to possibly develop and be noted.
2/23/2012 6:24:26 PM - G - Considerable volume-driven gain today for a best-ever close. Prior highs in the $23 area acted as support on pullbacks following its recent technical breakout.
2/17/2012 10:57:50 AM - G - Small gap up today, and its color code is changed to green after rising back above its "max buy" level. Prior highs in the $23 area acted as support on pullbacks following its recent technical breakout.
2/16/2012 5:28:42 PM - Y - Posted a gain today with below average volume following 3 consecutive losses on below average volume. Consolidating above prior highs in the $23 area noted as initial support to watch on pullbacks.
2/15/2012 6:49:41 PM - Y - Color code is changed to yellow after 3 consecutive losses on below average volume. Consolidating just above its pivot point and prior highs in the $23 area noted as initial support to watch on pullbacks.
2/9/2012 4:09:28 PM - G - Overcame early weakness and managed a positive reversal today, finishing near the session high with a solid gain on near average volume. Prior highs in the $23 area define initial support to watch on pullbacks.
2/6/2012 2:04:20 PM - G - Down again today following a negative reversal on the prior session from a new all-time high. Prior highs in the $23 area define initial support to watch on pullbacks.
2/3/2012 6:53:36 PM - G - Reversed into the red today and closed near the session low with a loss after earlier gains for a new all-time high. It is extended from its prior base. See the latest FSU analysis for more details and a new annotated graph.
2/2/2012 2:56:32 PM - G - Gapped up today rallying to a new high above the "max buy" level and its color code is changed to green. See the latest FSU analysis for more details and a new annotated graph.
2/1/2012 5:07:42 PM - Y - Finished in the upper third of its intra-day range today after briefly undercutting its pivot point. See the latest FSU analysis for more details and a new annotated graph.
2/1/2012 3:03:00 PM - Y - Up from the morning's low after briefly undercutting its pivot point, enduring distributional pressure today. Prior highs near $23 define initial chart support to watch following the technical buy signal triggered on 1/30/12 with a considerable volume-driven gain. Quarterly earnings increases have been strong. Reported earnings +145% on +95% sales revenues for the quarter ended December 31, 2011 versus the year ago period. Limited trading history is a concern, yet it built a sound base pattern.
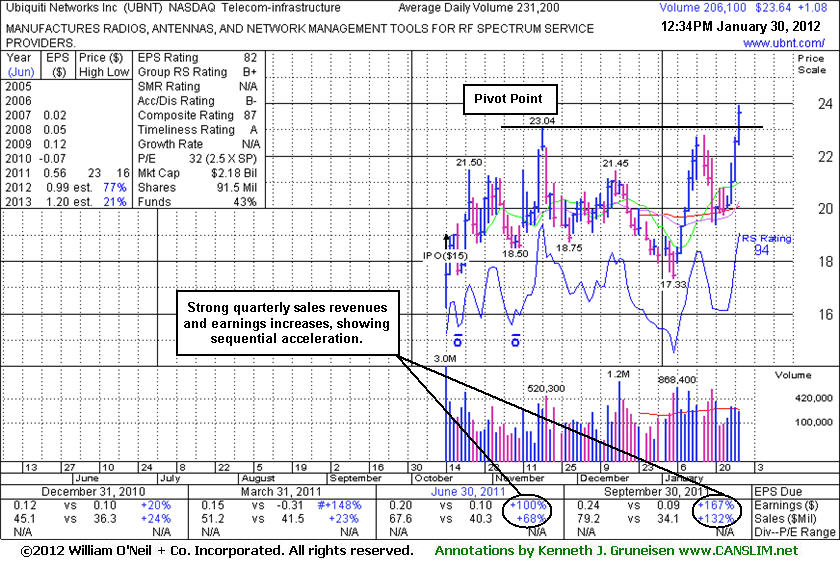
1/31/2012 1:04:52 PM - Y - Hit another new 52-week high today but reversed into the red following 4 consecutive gains. A strong gain backed by more than 2 times average volume and a strong finish on 1/30/12 triggered a technical buy signal. Quarterly earnings increases have been strong through Sep '11. Limited trading history is a concern, yet it built a sound base pattern.
1/30/2012 12:43:32 PM - Y - Hit a new 52-week high with volume running at an above average pace behind today's 4th consecutive gain. In Friday's mid-day report it was featured in yellow with a pivot point cited based on its 52-week high plus 10 cents. A strong finish may clinch a technical buy signal. Quarterly earnings in ceases have been strong through Sep '11. Limited trading history is a concern, yet it has built a sound base pattern since last noted 11/11/11 shortly after its 10/14/11 IPO at $15.
1/27/2012 1:35:45 PM - Y - Color code is changed to yellow with pivot point cited based on its 52-week high plus 10 cents. Gain today has it nearly challenging its 52-week high, but disciplined investors would watch for a proper technical buy signal before taking action. Quarterly earnings in ceases have been strong through Sep '11. Limited trading history is a concern, yet it has built a sound base pattern since last noted 11/11/11 shortly after its 10/14/11 IPO at $15.
11/11/2011 1:09:37 PM - Gapped up today and matched its 52-week high, yet it is now off its session high and in the lower third of its intra-day range. Limited trading history is a concern and it is up considerably from its 10/14/11 IPO at $15.