11/20/2015 12:48:27 PM - Finding support at its 200 DMA line this week. Fundamental concern remain. Earnings were +10% on +28% sales revenues for the Sep '15 quarter, and prior quarters were below the +25% minimum earnings guideline (C criteria). Made gradual progress since dropped from the Featured Stocks list on 10/01/14 based on fundamental and technical weakness.
7/23/2015 1:05:06 PM - Gapped up today hitting new all time highs. Fundamental concern remain. Earnings were -13% on +29% sales revenues for the Jun '15 quarter, its 2nd quarterly comparison of waning earnings. The fact-based investment system requires the past 3 or 4 earning increases to be above the +25% minimum guideline (C criteria). Found support above its 200 DMA line during its consolidation and made gradual progress since dropped from the Featured Stocks list on 10/01/14 based on fundamental and technical weakness."
7/17/2015 12:45:02 PM - Rebounding today following a gap down and volume-driven loss on the prior session while consolidating near its all time high. Fundamental concern remain since noted with caution in prior mid-day reports - "Earnings were -17% on +25% sales revenues for the Mar '15 quarter. Reported earnings +33% on +31% sales revenues for the Dec '14 quarter, an improvement after the 2 prior quarterly comparisons had earnings increases below the +25% minimum guideline. Found support above its 200 DMA line during its consolidation since dropped from the Featured Stocks list on 10/01/14 based on fundamental and technical weakness."
7/16/2015 12:59:16 PM - Gapped down today, retreating from its all time high with a volume-driven loss. Fundamental concern remain since noted with caution in prior mid-day reports - "Earnings were -17% on +25% sales revenues for the Mar '15 quarter. Reported earnings +33% on +31% sales revenues for the Dec '14 quarter, an improvement after the 2 prior quarterly comparisons had earnings increases below the +25% minimum guideline. Found support above its 200 DMA line during its consolidation since dropped from the Featured Stocks list on 10/01/14 based on fundamental and technical weakness."
7/13/2015 1:09:13 PM - Gapped up today hitting a new all time high. Fundamental concern remain since last noted with caution in the 6/05/15 mid-day report - "Earnings were -17% on +25% sales revenues for the Mar '15 quarter. Reported earnings +33% on +31% sales revenues for the Dec '14 quarter, an improvement after the 2 prior quarterly comparisons had earnings increases below the +25% minimum guideline. Found support above its 200 DMA line during its consolidation since dropped from the Featured Stocks list on 10/01/14 based on fundamental and technical weakness."
6/5/2015 12:57:44 PM - Gapped up today and rebounded above its 50 DMA line, but it faces resistance due to overhead supply up through the $88 level. Last noted with caution in the 4/22/15 mid-day report when retreating from its all-time high with 2 consecutive big volume-driven losses - "Earnings were -17% on +25% sales revenues for the Mar '15 quarter. Reported earnings +33% on +31% sales revenues for the Dec '14 quarter, an improvement after the 2 prior quarterly comparisons had earnings increases below the +25% minimum guideline. Found support above its 200 DMA line during its consolidation since dropped from the Featured Stocks list on 10/01/14 based on fundamental and technical weakness."
4/22/2015 1:03:18 PM - Abruptly retreating from new 52-week and all-time highs with 2 consecutive volume-driven losses following a report that earnings were -17% on +25% sales revenues for the Mar '15 quarter. Prior mid-day reports cautioned - "Reported earnings +33% on +31% sales revenues for the Dec '14 quarter, an improvement after the 2 prior quarterly comparisons had earnings increases below the +25% minimum guideline. Found support above its 200 DMA line during its consolidation since dropped from the Featured Stocks list on 10/01/14 based on fundamental and technical weakness."
4/21/2015 12:55:07 PM - Abruptly retreating from new 52-week and all-time highs hit on the prior session with a gap down and volume-driven loss today following earnings news for the Mar '15 quarter. Bullish action has continued since noted in the 2/05/15 mid-day report with caution - "Reported earnings +33% on +31% sales revenues for the Dec '14 quarter, an improvement after the 2 prior quarterly comparisons had earnings increases below the +25% minimum guideline. Found support above its 200 DMA line during its consolidation since dropped from the Featured Stocks list on 10/01/14 based on fundamental and technical weakness."
4/13/2015 12:50:19 PM - Hitting yet another new 52-week and all-time high today. Bullish action has continued since noted in the 2/05/15 mid-day report with caution - "Reported earnings +33% on +31% sales revenues for the Dec '14 quarter, an improvement after the 2 prior quarterly comparisons had earnings increases below the +25% minimum guideline. Found support above its 200 DMA line during its consolidation since dropped from the Featured Stocks list on 10/01/14 based on fundamental and technical weakness."
4/9/2015 1:17:31 PM - Hitting another new 52-week and all-time high today. Bullish action has continued since last noted in the 2/05/15 mid-day report with caution - "Reported earnings +33% on +31% sales revenues for the Dec '14 quarter, an improvement after the 2 prior quarterly comparisons had earnings increases below the +25% minimum guideline. Found support above its 200 DMA line during its consolidation since dropped from the Featured Stocks list on 10/01/14 based on fundamental and technical weakness."
2/5/2015 12:52:34 PM - Touched new 52-week and all-time highs today then reversed into the red. Reported earnings +33% on +31% sales revenues for the Dec '14 quarter, an improvement after the 2 prior quarterly comparisons had earnings increases below the +25% minimum guideline. Found support above its 200 DMA line during its consolidation since dropped from the Featured Stocks list on 10/01/14 based on fundamental and technical weakness.
1/27/2015 12:54:47 PM - Rebounded above its 50 DMA line and it is perched within striking distance of its 52-week high with today's 7th consecutive gain. Found support above its 200 DMA line during its consolidation since dropped from the Featured Stocks list on 10/01/14 based on fundamental and technical weakness.
1/5/2015 1:23:22 PM - Slumping below its 50 DMA line and undercutting prior lows with today's 4th consecutive loss. Due to fundamental and technical deterioration it was dropped from the Featured Stocks list on 10/01/14.
10/23/2014 1:27:14 PM - Encountered resistance at its 50 DMA line this week. Due to fundamental and technical deterioration it was dropped from the Featured Stocks list on 10/01/14.
10/1/2014 2:03:18 PM - Slicing below its 50 DMA line with today's damaging loss amid widespread market weakness (M criteria) raising concerns and triggering technical sell signals. Due to noted fundamental and technical deterioration it will be dropped from the Featured Stocks list tonight.
9/26/2014 12:35:07 PM - G - Consolidating above its 50 DMA line within striking distance of its 52-week high. Prior notes cautioned members - "Fundamental concerns were raised by earnings reported +0% on +34% sales revenues for the Jun '14 quarter, below the +25% minimum earnings guideline (C criteria)."
9/24/2014 5:32:59 PM - G - Rebounded above its 50 DMA line helping its outlook improve with today's 2nd consecutive gain on lighter volume. Prior notes cautioned members - "Fundamental concerns were raised by earnings reported +0% on +34% sales revenues for the Jun '14 quarter, below the +25% minimum earnings guideline (C criteria)."
9/22/2014 5:47:30 PM - G - Violated its 50 DMA line with today's 2nd consecutive loss with above average volume triggering a technical sell signal. Only a prompt rebound would help its outlook improve. Prior notes cautioned members - "Fundamental concerns were raised by earnings reported +0% on +34% sales revenues for the Jun '14 quarter, below the +25% minimum earnings guideline (C criteria)."
9/19/2014 5:46:19 PM - G - Slumped toward its 50 DMA line ($67.51) with higher volume today, retreating from its 52-week high. Prior notes cautioned members - "Fundamental concerns were raised by earnings reported +0% on +34% sales revenues for the Jun '14 quarter, below the +25% minimum earnings guideline (C criteria)."
9/18/2014 1:06:16 PM - G - Found support at its 50 DMA line ($67.31) recently after retreating from its 52-week high. Prior notes cautioned members - "Fundamental concerns were raised by earnings reported +0% on +34% sales revenues for the Jun '14 quarter, below the +25% minimum earnings guideline (C criteria)."
9/15/2014 7:25:46 PM - G - Testing support at its 50 DMA line ($66.73) with higher volume behind today's 5th consecutive loss while retreating from its 52-week high. Fundamental concerns were raised by earnings reported +0% on +34% sales revenues for the Jun '14 quarter, below the +25% minimum earnings guideline (C criteria). See the latest FSU analysis for more details and new annotated graphs.
9/15/2014 3:34:46 PM - G - Testing support at its 50 DMA line ($66.73) with higher volume behind today's 5th consecutive loss while retreating from its 52-week high. Fundamental concerns were raised by earnings reported +0% on +34% sales revenues for the Jun '14 quarter, below the +25% minimum earnings guideline (C criteria), yet the company raised its guidance.
9/9/2014 7:08:21 PM - G - Finished near the session low today with a loss on higher volume indicative of distributional pressure. No resistance remains due to overhead supply. Fundamental concerns were raised by earnings reported +0% on +34% sales revenues for the Jun '14 quarter, below the +25% minimum earnings guideline (C criteria), yet the company raised its guidance.
9/2/2014 6:28:51 PM - G - Finished near the session high and at a best-ever close with today's considerable volume-driven gain. No resistance remains due to overhead supply. Fundamental concerns were raised by earnings reported +0% on +34% sales revenues for the Jun '14 quarter, below the +25% minimum earnings guideline (C criteria), yet the company raised its guidance.
8/25/2014 3:33:55 PM - G - Stubbornly holding its ground near its all-time high and no resistance remains due to overhead supply. Recently reported earnings +0% on +34% sales revenues for the Jun '14 quarter, below the +25% minimum earnings guideline (C criteria), yet the company raised its guidance.
8/18/2014 7:11:08 PM - G - Recently reported earnings +0% on +34% sales revenues for the Jun '14 quarter, below the +25% minimum earnings guideline (C criteria), yet the company raised its guidance. Finished at a new all-time high close today and no resistance remains due to overhead supply.
8/6/2014 6:48:24 PM - G - Recently reported earnings +0% on +34% sales revenues for the Jun '14 quarter, below the +25% minimum earnings guideline (C criteria), yet the company raised its guidance. Hold its ground stubbornly near all-time highs with no resistance remaining due to overhead supply.
7/31/2014 3:56:28 PM - G - Pulling back today with higher volume, enduring distributional pressure. Recently reported earnings +0% on +34% sales revenues for the Jun '14 quarter, below the +25% minimum earnings guideline (C criteria), yet the company raised its guidance.
7/30/2014 5:41:37 PM - G - Recently reported earnings +0% on +34% sales revenues for the Jun '14 quarter, below the +25% minimum earnings guideline (C criteria), yet the company raised its guidance. Holding its ground at its 52-week high following a considerable "breakaway gap" on 7/24/14. See the latest FSU analysis for more details and new annotated graphs.
7/25/2014 12:48:38 PM - G - Color code is changed to green. Reported earnings +0% on +34% sales revenues for the Jun '14 quarter, below the +25% minimum earnings guideline (C criteria), yet the company raised its guidance. Holding its ground at its 52-week high today following a considerable "breakaway gap" on the prior session with more than 4 times average volume. A breakaway gap is the one noted exception where investors may chase a stock more than +5% above prior highs, however risk increases.
7/24/2014 6:14:23 PM - Y - Reported Jun '14 quarterly results and raised guidance. Hit a new 52-week high with today's "breakaway gap" and 5th consecutive gain on heavy volume, rallying from the previously noted "cup-with-handle" base. A breakaway gap is the one noted exception where investors may chase a stock more than +5% above prior highs, however risk increases.
7/24/2014 1:04:15 PM - Y - Reported strong Jun '14 quarterly results and raised guidance. Hitting new 52-week highs and trading up considerably with today's "breakaway gap" and 5th consecutive gain on ever-increasing volume, rallying from the previously noted "cup-with-handle" base. A breakaway gap is the one noted exception where investors may chase a stock more than +5% above prior highs, however risk increases.
7/24/2014 10:14:15 AM - Y - Reported strong Jun '14 quarterly results and raised guidance. Hitting a new 52-week high and trading up considerably with today's "breakaway gap" and 5th consecutive gain on ever-increasing volume, rallying from the previously noted "cup-with-handle" base. A breakaway gap is the one noted exception where investors may chase a stock more than +5% above prior highs, however risk increases.
7/22/2014 1:02:38 PM - Y - Rising today near its pivot point following a previously noted "cup-with-handle" base. Gains above the pivot point backed by at least +40% above average volume may trigger a proper technical buy signal.
7/15/2014 4:29:40 PM - Y - Holding its ground since highlighted in yellow in the 7/10/14 mid-day report (read here) forming cup-with-handle base. Volume-driven gains above the pivot point are still needed to trigger a proper technical buy signal.
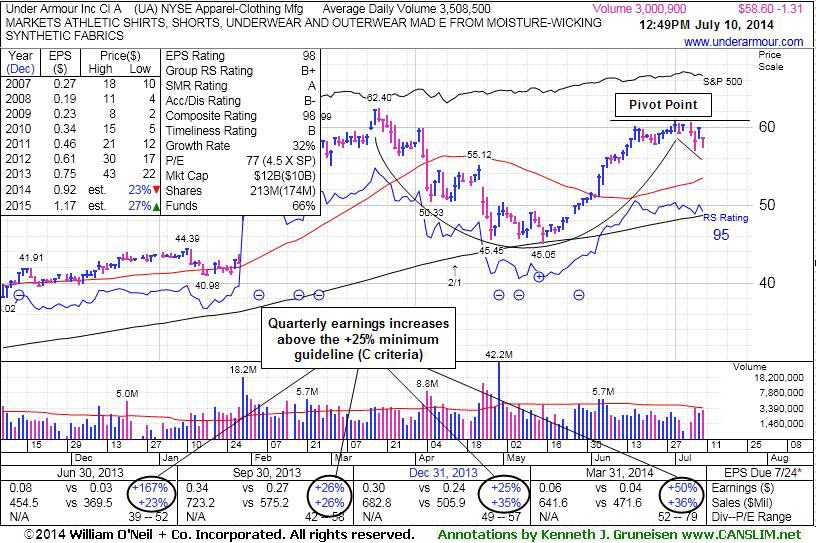
7/10/2014 6:05:46 PM - Y - Quarterly earnings comparisons have been above the +25% guideline (C criteria) through Mar '14 and its annual earnings (A criteria) history has been strong. It was highlighted in yellow with pivot point based on its 7/01/14 high in the earlier mid-day report (read here) trading near its 52-week high, forming a handle on the right side of a 17-week cup-with-handle base. Subsequent volume-driven gains above the pivot point are needed to trigger a proper technical buy signal. See the latest FSU analysis for more details and new annotated graphs.
7/10/2014 1:00:06 PM - Y - Quarterly earnings comparisons have been above the +25% guideline (C criteria) through Mar '14 and its annual earnings (A criteria) history has been strong. Color code is changed to yellow with pivot point based on its 7/01/14 high. Perched near its 52-week high today, forming a handle on the right side of a 17-week cup-with-handle base. Subsequent volume-driven gains above the pivot point are needed to trigger a proper technical buy signal. Found support at its 200 DMA line during its consolidation then rebounded since last noted in the 3/20/14 mid-day report with caution - "Since a downturn in the Mar '13 quarter its recent quarterly comparisons have shown earnings increases above the +25% minimum guideline (C criteria) and it has a strong annual earnings (A criteria) history. Patient investors may watch for a new base or secondary buy point to develop and be noted in the weeks ahead."
3/20/2014 1:04:33 PM - Perched near its 52-week high today, very extended from any sound base. Stubbornly held its ground after considerable volume-driven gains. Prior mid-day reports repeatedly noted - "No resistance remains due to overhead supply as it gapped up today for a considerable volume-driven gain and new all-time highs. Reported strong Dec '13 earnings and encouraging guidance for FY '14. Found support near its 50 DMA line during consolidations in recent months. Since a downturn in the Mar '13 quarter its recent quarterly comparisons have shown earnings increases above the +25% minimum guideline (C criteria) and it has a strong annual earnings (A criteria) history. Patient investors may watch for a new base or secondary buy point to develop and be noted in the weeks ahead."
2/24/2014 12:38:28 PM - Hitting yet another new 52-week high today. Did not form a base of sufficient length while it stubbornly held its ground after considerable volume-driven gains. Prior mid-day reports repeatedly noted - "No resistance remains due to overhead supply as it gapped up today for a considerable volume-driven gain and new all-time highs. Reported strong Dec '13 earnings and encouraging guidance for FY '14. Found support near its 50 DMA line during consolidations in recent months. Since a downturn in the Mar '13 quarter its recent quarterly comparisons have shown earnings increases above the +25% minimum guideline (C criteria) and it has a strong annual earnings (A criteria) history. Patient investors may watch for a new base or secondary buy point to develop and be noted in the weeks ahead."
2/21/2014 12:40:35 PM - Hitting another new 52-week high today. Did not form a base of sufficient length yet stubbornly held its ground after considerable volume-driven gains. Prior mid-day reports repeatedly noted - "No resistance remains due to overhead supply as it gapped up today for a considerable volume-driven gain and new all-time highs. Reported strong Dec '13 earnings and encouraging guidance for FY '14. Found support near its 50 DMA line during consolidations in recent months. Since a downturn in the Mar '13 quarter its recent quarterly comparisons have shown earnings increases above the +25% minimum guideline (C criteria) and it has a strong annual earnings (A criteria) history. Patient investors may watch for a new base or secondary buy point to develop and be noted in the weeks ahead."
2/18/2014 12:44:56 PM - Still perched at its 52-week high, stubbornly holding its ground after considerable volume-driven gains. Prior mid-day reports repeatedly noted - "No resistance remains due to overhead supply as it gapped up today for a considerable volume-driven gain and new all-time highs. Reported strong Dec '13 earnings and encouraging guidance for FY '14. Found support near its 50 DMA line during consolidations in recent months. Since a downturn in the Mar '13 quarter its recent quarterly comparisons have shown earnings increases above the +25% minimum guideline (C criteria) and it has a strong annual earnings (A criteria) history. Patient investors may watch for a new base or secondary buy point to develop and be noted in the weeks ahead."
2/5/2014 12:38:12 PM - Making its 6th consecutive mid-day report appearance and perched at its 52-week high, stubbornly holding its ground after considerable volume-driven gains. Prior mid-day reports noted - "No resistance remains due to overhead supply as it gapped up today for a considerable volume-driven gain and new all-time highs. Reported strong Dec '13 earnings and encouraging guidance for FY '14. Found support near its 50 DMA line during consolidations in recent months. Since a downturn in the Mar '13 quarter its recent quarterly comparisons have shown earnings increases above the +25% minimum guideline (C criteria) and it has a strong annual earnings (A criteria) history. Patient investors may watch for a new base or secondary buy point to develop and be noted in the weeks ahead."
2/4/2014 1:06:22 PM - Making its 5th consecutive mid-day report appearance and perched at its 52-week high after considerable volume-driven gains. Prior mid-day reports noted - "No resistance remains due to overhead supply as it gapped up today for a considerable volume-driven gain and new all-time highs. Reported strong Dec '13 earnings and encouraging guidance for FY '14. Found support near its 50 DMA line during consolidations in recent months. Since a downturn in the Mar '13 quarter its recent quarterly comparisons have shown earnings increases above the +25% minimum guideline (C criteria) and it has a strong annual earnings (A criteria) history. Patient investors may watch for a new base or secondary buy point to develop and be noted in the weeks ahead."
2/3/2014 12:46:40 PM - Making its 4th consecutive mid-day report appearance and perched at its 52-week high after considerable volume-driven gains. Prior mid-day reports noted - "No resistance remains due to overhead supply as it gapped up today for a considerable volume-driven gain and new all-time highs. Reported strong Dec '13 earnings and encouraging guidance for FY '14. Found support near its 50 DMA line during consolidations in recent months. Since a downturn in the Mar '13 quarter its recent quarterly comparisons have shown earnings increases above the +25% minimum guideline (C criteria) and it has a strong annual earnings (A criteria) history. Patient investors may watch for a new base or secondary buy point to develop and be noted in the weeks ahead."
1/31/2014 12:49:40 PM - Making its 3rd consecutive mid-day report appearance, up again today with above average volume. The 1/30/14 mid-day report noted - "No resistance remains due to overhead supply as it gapped up today for a considerable volume-driven gain and new all-time highs. Reported strong Dec '13 earnings and encouraging guidance for FY '14. Found support near its 50 DMA line during consolidations in recent months. Since a downturn in the Mar '13 quarter its recent quarterly comparisons have shown earnings increases above the +25% minimum guideline (C criteria) and it has a strong annual earnings (A criteria) history. Patient investors may watch for a new base or secondary buy point to develop and be noted in the weeks ahead."
1/30/2014 1:23:27 PM - No resistance remains due to overhead supply as it gapped up today for a considerable volume-driven gain and new all-time highs. Reported strong Dec '13 earnings and encouraging guidance for FY '14. Found support near its 50 DMA line during consolidations in recent months. Since a downturn in the Mar '13 quarter its recent quarterly comparisons have shown earnings increases above the +25% minimum guideline (C criteria) and it has a strong annual earnings (A criteria) history. Patient investors may watch for a new base or secondary buy point to develop and be noted in the weeks ahead.
1/29/2014 2:49:11 PM - Found support near its 50 DMA line during consolidations in recent months. Slumped back into the previously noted base after wedging higher with gains lacking great volume conviction. No overhead supply remains to act as resistance while perched within close striking distance of its 52-week high. Due to report Dec '13 quarterly results Thursday, January 30, 2014 before the open. Volume and volatility often increase near earnings news. Reported earnings +26% on +26% sales revenues for the Sep '13 quarter. Three of the past 4 quarterly comparisons have shown earnings increases above the +25% minimum guideline (C criteria). It made an impressive rally since a considerable "breakaway gap" on 7/25/13 with heavy volume. Went through a deep consolidation below its 200 DMA line then rebounded and rallied impressively since dropped from the Featured Stocks list on 6/27/12.
12/11/2013 12:55:41 PM - Found support near its 50 DMA line during its consolidation in recent months, building on a 9-week flat base. No overhead supply remains while today's 5th consecutive gain has it perched within close striking distance of itts 52-week high. Reported earnings +26% on +26% sales revenues for the Sep '13 quarter. Three of the past 4 quarterly comparisons have shown earnings increases above the +25% minimum guideline (C criteria). It made an impressive rally since a considerable "breakaway gap" on 7/25/13 with heavy volume. Went through a deep consolidation below its 200 DMA line then rebounded and rallied impressively since dropped from the Featured Stocks list on 6/27/12.
10/24/2013 1:24:26 PM - Gapped down and tested its 50 DMA line today, abruptly pulling back from its 52-week high. Reported earnings +26% on +26% sales revenues for the Sep '13 quarter. Three of the past 4 quarterly comparisons have shown earnings increases above the +25% minimum guideline (C criteria). It has not formed a sound base pattern, yet made gradual progress since a considerable "breakaway gap" on 7/25/13 with heavy volume. Went through a deep consolidation below its 200 DMA line then rebounded and rallied impressively since dropped from the Featured Stocks list on 6/27/12.
9/16/2013 1:12:20 PM - Pulling back from its 52-week high with today's 3rd consecutive loss following a considerable spurt of volume-driven gains. Made gradual progress since a considerable "breakaway gap" on 7/25/13 with heavy volume. Reported earnings +167% on +23% sales revenues for the quarter ended June 30, 2013. Prior quarterly comparisons have been erratic and not a match with the investment system's +25% minimum guideline (C criteria). Went through a deep consolidation below its 200 DMA line then rebounded impressively since dropped from the Featured Stocks list on 6/27/12.
9/13/2013 1:22:53 PM - Pulling back from its 52-week high following a considerable spurt of volume-driven gains as it held its ground after a considerable "breakaway gap" with heavy volume. Last noted with caution in the 7/26/13 mid-day report. Reported earnings +167% on +23% sales revenues for the quarter ended June 30, 2013. Prior quarterly comparisons have been erratic and not a match with the investment system's +25% minimum guideline (C criteria). Went through a deep consolidation below its 200 DMA line then rebounded impressively since dropped from the Featured Stocks list on 6/27/12.
7/26/2013 1:04:33 PM - Perched at its 52-week high following a considerable "breakaway gap" with heavy volume on the prior session. Reported earnings +167% on +23% sales revenues for the quarter ended June 30, 2013. Prior quarterly comparisons have been erratic and not a match with the investment system's +25% minimum guideline (C criteria). Went through a deep consolidation below its 200 DMA line then rebounded impressively since dropped from the Featured Stocks list on 6/27/12.
7/25/2012 1:07:14 PM - Trading up again today following a considerable gap up gain with heavy volume on 7/24/12, rallying to a new 52-week high after reporting earnings +0% on +27% sales revenues for the quarter ended June 30, 2012. That marked its 2nd consecutive quarterly comparison with earnings growth below the investment system's +25% minimum guideline. Found support well above its 200 DMA line while consolidating near prior lows in the $44 area defining a chart support level. Do not be confused by the 2:1 stock split impacting its share prices as of 7/10/12. It was dropped from the Featured Stocks list on 6/27/12 due to weak action and a disappointing earnings report for March '12.
7/24/2012 12:29:07 PM - Gapped up today and hit a new 52-week high after reporting earnings +0% on +27% sales revenues for the quarter ended June 30, 2012, marking its 2nd consecutive quarterly comparison with earnings growth below the investment system's +25% minimum guideline. Found support well above its 200 DMA line while consolidating near prior lows in the $44 area defining a chart support level. Do not be confused by the 2:1 stock split impacting its share prices as of 7/10/12. It was dropped from the Featured Stocks list on 6/27/12 due to weak action and a disappointing earnings report for March '12.
6/27/2012 4:40:28 PM - Slumped further below its 50 DMA line with higher volume behind its loss today while slumping toward prior lows in the $88 area which define the next chart support level. It will be dropped from the Featured Stocks list today due to weak action and a dissapointing earnings report for March '12.
6/25/2012 1:10:24 PM - G - Sinking below its 50 DMA line today, raising concerns. It recently wedged to new 52-week highs without especially great volume conviction behind its gains.
6/21/2012 6:02:30 PM - G - Fell to its 50 DMA line today with a damaging loss on heavy volume after a gap down following an analyst downgrade. Its recently wedged to new 52-week highs without especially great volume conviction behind its gains. See the latest FSU analysis for additional details and a new annotated graph.
6/21/2012 12:19:17 PM - G - Testing support at its 50 DMA line after a gap down today on above average volume following an analyst downgrade. Recently wedged to new 52-week highs without especially great volume conviction behind its gains. It was previously noted - "No resistance remains due to overhead supply. Fundamental concerns remain after a slightly sub par earnings increase in the Dec '11 quarter."
6/21/2012 10:13:18 AM - G - Gapped down today following an analyst downgrade. Recently wedged to new 52-week highs without especially great volume conviction behind its gains. It was previously noted - "No resistance remains due to overhead supply. Fundamental concerns remain after a slightly sub par earnings increase in the Dec '11 quarter."
6/20/2012 1:09:58 PM - G - Wedged to new 52-week highs without especially great volume conviction behind recent gains. It was previously noted - "No resistance remains due to overhead supply. Fundamental concerns remain after a slightly sub par earnings increase in the Dec '11 quarter."
6/15/2012 8:29:32 PM - G - Rallied with above average volume today for its second best close ever. It was previously noted - "No resistance remains due to overhead supply. Fundamental concerns remain after a slightly sub par earnings increase in the Dec '11 quarter."
6/13/2012 6:22:30 PM - G - Ended near the session low today with a large loss on lighter (but still above average) volume, pulling back from a best-ever close. Perched near its 52-week and all-time highs after a "negative reversal" on 6/11/12 with above average volume. It was previously noted - "No resistance remains due to overhead supply. Fundamental concerns remain after a slightly sub par earnings increase in the Dec '11 quarter."
6/12/2012 12:39:42 PM - G - Hovering near its 52-week and all-time highs today after a negative reversal on the prior session. It was previously noted - "No resistance remains due to overhead supply. Fundamental concerns remain after a slightly sub par earnings increase in the Dec '11 quarter."
6/11/2012 4:57:24 PM - G - Started with gains for new 52-week and all-time highs today then finished with a small loss on above average volume after a negative reversal. Following a strong finish on the prior session it was previously noted - "No resistance remains due to overhead supply. Fundamental concerns remain after a slightly sub par earnings increase in the Dec '11 quarter."
6/11/2012 12:38:56 PM - G - Gapped up today and hit another new 52-week and all-time high following a strong finish on the prior session. Previously noted - "No resistance remains due to overhead supply. Fundamental concerns remain after a slightly sub par earnings increase in the Dec '11 quarter."
6/8/2012 5:58:44 PM - G - Rallied with slightly above average volume for new 52-week and all-time highs. Previously noted - "No resistance remains due to overhead supply. Fundamental concerns remain after a slightly sub par earnings increase in the Dec '11 quarter."
6/6/2012 6:02:59 PM - G - Rose near its 52-week high and best-ever close today with a 3rd consecutive gain on below average volume. No resistance remains due to overhead supply. Fundamental concerns remain after a slightly sub par earnings increase in the Dec '11 quarter.
6/1/2012 1:56:38 PM - G - Slumping under its 50 DMA line today after a gap down amid widespread market weakness. Concerns were recently raised by weaker fundamentals, its first quarterly earnings increase below the +25% minimum guideline in more than 2 years.
5/29/2012 4:56:55 PM - G - Today's 6th consecutive gain was backed by above average volume as it finished near its best-ever close. Concerns were recently raised by weaker fundamentals, its first quarterly earnings increase below the +25% minimum guideline in more than 2 years.
5/21/2012 4:48:25 PM - G - Posted a gain and finished near the session high today but volume was lighter than average. Concerns were recently raised by weaker fundamentals, its first quarterly earnings increase below the +25% minimum guideline in more than 2 years.
5/17/2012 5:33:28 PM - G - Down today on higher volume, a sign of distributional pressure, closing a penny off the session low. Concerns were recently raised by weaker fundamentals, its first quarterly earnings increase below the +25% minimum guideline in more than 2 years.
5/15/2012 8:48:15 PM - G - The longer it lingers below its 50 DMA line the worse its outlook gets. That short-term average has acted as resistance following the violation on 5/08/12 which triggered technical sell signals. Concerns were raised by weaker fundamentals. Reported earnings +22% on +23% sales revenues for the quarter ended March 31, 2012 versus the year ago period, its first quarterly earnings increase below the +25% minimum guideline in more than 2 years.
5/9/2012 1:06:34 PM - G - Rising back toward its 50 DMA line with today's gain. That short-term average may now act as a resistance level following the violation on the prior session which triggered technical sell signals. Concerns were raised by weaker fundamentals. Reported earnings +22% on +23% sales revenues for the quarter ended March 31, 2012 versus the year ago period, its first quarterly earnings increase below the +25% minimum guideline in more than 2 years.
5/8/2012 11:09:56 AM - G - Considerable loss today, violating its 50 DMA line and prior lows triggering technical sell signals. Concerns were raised by weaker fundamentals. Reported earnings +22% on +23% sales revenues for the quarter ended March 31, 2012 versus the year ago period, its first quarterly earnings increase below the +25% minimum guideline in more than 2 years.
5/1/2012 6:23:25 PM - G - Remains perched above its 50 DMA line very near its all-time high. No overhead supply remains to act as resistance, however no new pivot point was cited following its latest base. Concerns were raised by weaker fundamentals. Reported earnings +22% on +23% sales revenues for the quarter ended March 31, 2012 versus the year ago period, its first quarterly earnings increase below the +25% minimum guideline in more than 2 years.
4/24/2012 12:36:11 PM - G - Slumping under prior highs with a loss today. No overhead supply remains to act as resistance, however no new pivot point was cited following its latest base. Concerns were raised by weaker fundamentals. Reported earnings +22% on +23% sales revenues for the quarter ended March 31, 2012 versus the year ago period, its first quarterly earnings increase below the +25% minimum guideline in more than 2 years.
4/23/2012 12:53:35 PM - G - Small gap down today amid widespread market weakness. No new pivot point was cited due to concerns over the weaker fundamentals, however, no overhead supply remains to act as resistance after its volume-driven gain on 4/20/12 for new 52-week and all-time highs, technically rallying from a new orderly base pattern well above its 50 DMA line and prior highs. Reported earnings +22% on +23% sales revenues for the quarter ended March 31, 2012 versus the year ago period, its first quarterly earnings increase below the +25% minimum guideline in more than 2 years.
4/20/2012 12:37:49 PM - G - Reported earnings +22% on +23% sales revenues for the quarter ended March 31, 2012 versus the year ago period, its first quarterly earnings increase below the +25% minimum guideline in more than 2 years. No new pivot point is cited due to concerns over the weaker fundamentals, however, no overhead supply remains to act as resistance while today's volume-driven gain has it hitting new 52-week and all-time highs, technically rallying from a new orderly base pattern well above its 50 DMA line and prior highs.
4/20/2012 11:12:08 AM - G - Reported earnings +22% on +23% sales revenues for the quarter ended March 31, 2012 versus the year ago period, its first quarterly earnings increase below the +25% minimum guideline in more than 2 years. No new pivot point is cited due to concerns over the weaker fundamentals, however, no overhead supply remains to act as resistance while today's volume-driven gain has it hitting new 52-week and all-time highs, technically rallying from a new orderly base pattern well above its 50 DMA line and prior highs.
4/17/2012 5:44:52 PM - G - Volume totals have been cooling while consolidating above its 50 DMA line. Prior gains above its pivot point did not have volume sufficient to trigger a proper technical buy signal, and recent losses on higher volume (near average, but above prior session totals) indicate mild distributional pressure while working on a possible new base-on-base pattern.
4/10/2012 6:28:11 PM - G - Down today on higher (near average) volume, slumping toward its 50 DMA line. Prior gains above its pivot point did not have volume sufficient to trigger a proper technical buy signal, and recent losses on higher volume (near average, but above prior session totals) indicate distributional pressure while working on a possible new base-on-base pattern.
4/4/2012 5:04:40 PM - G - Prior gains above its pivot point did not have volume sufficient to trigger a proper technical buy signal, and recent losses on higher volume (near average, but above prior session totals) indicate distributional pressure while working on a possible new base-on-base pattern. See the latest FSU analysis for more details and a new annotated graph.
4/4/2012 10:55:10 AM - G - Small gap down today, consolidating above its 50 DMA line which defines support to watch above its prior highs. It has been repeatedly noted - "Extended from its last sound base pattern and recent gains above its pivot point did not have volume sufficient to trigger a proper technical buy signal."
4/3/2012 4:19:32 PM - G - Up today with light volume for its second-best close ever. It is extended from its last sound base pattern and recent gains above its pivot point did not have volume sufficient to trigger a proper technical buy signal.
3/29/2012 1:28:33 PM - G - Pulling back from its all-time highs today with a 3rd consecutive loss. It is extended from its last sound base pattern and recent gains above its pivot point did not have volume sufficient to trigger a proper technical buy signal.
3/28/2012 5:21:27 PM - G - Pulling back on light volume this week. It is extended from its last sound base pattern and recent gains above its pivot point did not have volume sufficient to trigger a proper technical buy signal.
3/22/2012 10:35:02 AM - G - It is extended from its last sound base pattern and recent gains above its pivot point did not have volume sufficient to trigger a proper technical buy signal. Pyramiding into a position can help investors avoid chasing stocks too far above their pivot point.
3/16/2012 5:58:08 PM - G - Pulled back today for a 3rd consecutive loss today. Recent gains above its pivot point did not have volume sufficient to trigger a proper technical buy signal. Pyramiding into a position can help investors avoid chasing stocks too far above their pivot point.
3/12/2012 6:22:21 PM - G - Posted a 4th consecutive gain today. Recent gains above its pivot point did not have volume sufficient to trigger a proper technical buy signal. Pyramiding into a position can help investors avoid chasing stocks too far above their pivot point.
3/7/2012 7:01:47 PM - G - Color code is changed to green again after rising back above its "max buy" level with a gain on lighter than average volume today. Recent gains above its pivot point did not have volume sufficient to trigger a proper technical buy signal. Pyramiding into a stock can help investors avoid chasing them too far above their pivot point.
3/6/2012 1:19:45 PM - Y - Color code is changed to yellow after slumping back below its "max buy" level following a small gap down today. Recent gains above its pivot point did not have volume sufficient to trigger a proper technical buy signal. Pyramiding into a stock can help investors avoid chasing them too far above their pivot point.
3/1/2012 5:10:04 PM - G - Color code is changed to green after rallying above its "max buy" level with today's 5th consecutive gain above its pivot point which again did not have volume sufficient to trigger a proper technical buy signal. Pyramiding into a stock can help investors avoid chasing them too far above their pivot point.
2/29/2012 7:58:40 PM - Y - Today's 4th consecutive gain above its pivot point again did not have more than the minimum +40% above average volume sufficient behind a gain to trigger a proper technical buy signal. Pyramiding into a stock can help investors avoid chasing them too far above their pivot point.
2/24/2012 3:46:01 PM - Y - Gapped up today and rallied above its pivot point, however volume is not running at a pace substantially above average. A minimum of +40% above average volume is sufficient volume behind a gain to trigger a proper technical buy signal, and heavier volume is considered a true sign of institutional positioning, otherwise a sustained and meaningful advance in price is less likely.
2/21/2012 1:43:32 PM - Y - Pulling back today on light volume, perched near its pivot point. Disciplined investors may watch for a gain above the pivot point with sufficient volume to trigger a proper technical buy signal. See the latest FSU analysis for more details and a new annotated graph.
2/16/2012 5:44:20 PM - Y - Closed above the new pivot point cited but today's gain did not have sufficient volume to trigger a proper technical buy signal following a "negative reversal" on the prior session. See the latest FSU analysis for more details and a new annotated graph.
2/15/2012 6:47:22 PM - Y - Color code was changed to yellow with new pivot point cited based on its 12/02/11 high while working on a 16-week "double bottom" base pattern, but it finished the session with a loss on higher volume following a "negative reversal". See the latest FSU analysis for more details and a new annotated graph.
2/15/2012 1:24:43 PM - Y - Found support near its 200 DMA line and recently rebounded near its 52-week high. Color code is changed to yellow with new pivot point cited based on its 12/02/11 high while working on a 16-week "double bottom" base pattern. Fundamentals remained strong through the Dec '11 quarterly comparison and it has formed a sound base since it was dropped from the Featured Stocks list on 12/22/11.
12/22/2011 5:39:58 PM - Slumping further below its prior low and just under its 200 DMA line while its Relative Strength rank has fallen below the 80+ guideline to a 76. Based on weak action it will be dropped from the Featured Stocks list tonight. See the latest FSU analysis for more details and a new annotated graph.
12/19/2011 5:39:09 PM - G - Loss today on light volume has it slumping further below the previously noted low ($73.55 on 11/21/11) and testing important chart support at its 200 DMA line. More damaging losses would raise serious concerns.
12/15/2011 5:58:09 PM - G - Gain today halted a streak of 3 consecutive losses, but concerns were raised by recent trading below a prior low ($73.55 on 11/21/11) while testing important chart support at its 200 DMA line.
12/13/2011 1:30:01 PM - G - Down again today, slumping further below its 50 DMA line as a 2nd consecutive loss with above average volume raises more concerns. The recent low ($73.55 on 11/21/11) defines important chart support to watch above its 200 DMA line.
12/12/2011 12:41:51 PM - G - Gapped down today and violated its 50 DMA line raising some concerns amid widespread market weakness. The recent low ($73.55 on 11/21/11) defines important chart support to watch.
12/9/2011 3:45:39 PM - G - Up today with light volume, consolidating just above its 50 DMA line and recent low ($73.55 on 11/21/11) defining important support to watch.
12/8/2011 5:36:54 PM - G - Down today for a 3rd consecutive loss with lighter than average volume. Its 50 DMA line and recent low ($73.55 on 11/21/11) define important support to watch.
12/5/2011 5:05:39 PM - G - Gapped up today and finished near the session high with a gain on lighter than average volume. Its 50 DMA line and recent low ($73.55 on 11/21/11) define important support to watch.
11/30/2011 12:00:32 PM - G - Gapped up today rallying toward prior highs. Subsequent weakness exceeding the recent low ($73.55 on 11/21/11) would raise concerns and trigger a technical sell signal.
11/28/2011 7:49:16 PM - G - Gain today with near average volume helped it rally above its 50 DMA line helping its technical stance improve. Its 200 DMA line defines the next important support level.
11/25/2011 3:30:23 PM - G - Color code is changed to green while remaining below prior highs near $80 and encountering resistance after slumping below its 50 DMA line. Its 200 DMA line defines the next important support level.
11/18/2011 5:50:09 PM - Y - Volume was lighter than average today as it sank further below prior highs near $80 previously noted as initial support, technically negating its recent breakout and raising concerns. It is currently testing important chart support at its 50 DMA line.
11/17/2011 7:06:04 PM - Y - Volume was higher but near average as it sank below prior highs near $80 previously noted as initial support. It closed below prior highs today, technically negating its recent breakout and raising concerns. It remains above its 50 DMA line.
11/16/2011 6:04:54 PM - Y - Quietly consolidating just above its pivot point and below its "max buy" level. No resistance remains due to overhead supply following its recent spurt of volume-driven gains. Prior highs near $80 define initial support above its 50 DMA line.
11/11/2011 2:09:33 PM - Y - Rising with light volume today, still consolidating above its pivot point and below its "max buy" level. No resistance remains due to overhead supply following its recent spurt of volume-driven gains. Prior highs near $80 define initial support above its 50 DMA line.
11/8/2011 1:56:47 PM - Y - Small losses on light volume led to a pullback below its "max buy" level and its color code was changed to yellow again. No resistance remains due to overhead supply following its recent spurt of volume-driven gains. Prior highs near $80 define initial support above its 50 DMA line.
11/4/2011 6:42:54 PM - Y - Small loss on light volume led to a close below its "max buy" level and its color code is changed to yellow again. No resistance remains due to overhead supply following its recent spurt of volume-driven gains. Prior highs near $80 define initial support above its 50 DMA line.
11/3/2011 5:30:53 PM - G - Extended from its prior base, and color code is changed to green. No resistance remains due to overhead supply following its recent spurt of volume-driven gains. Prior highs near $80 define initial support above its 50 DMA line.
11/2/2011 6:13:04 PM - Y - Perched near its all-time high, holding its ground above prior highs near $80 that define initial support above its 50 DMA line. No resistance remains due to overhead supply following its recent spurt of volume-driven gains.
11/1/2011 5:22:42 PM - Y - Pulled back today for its 3rd consecutive small loss on light volume. Color code was changed to yellow after dipping under its "max buy" level. Prior highs near $80 define initial support well above its 50 DMA line.
10/31/2011 6:37:35 PM - Y - Touched another new all-time high today but reversed into the red for a small loss on light volume. Color code is changed to yellow after dipping under its "max buy" level. A streak of consecutive volume-driven gains had it slightly extended from the previous base.
10/28/2011 6:50:40 PM - G - Paused near its all-time high after 6 consecutive gains. It is slightly extended from the reverse-head-and-shoulders base pattern recently highlighted in the 10/25/11 mid-day report.
10/27/2011 2:00:56 PM - G - Hitting new all-time highs with today's 6th consecutive gain, the 4th straight gain with above average volume. Color code is changed to green after getting extended from the reverse-head-and-shoulders base pattern recently highlighted in the 10/25/11 mid-day report.
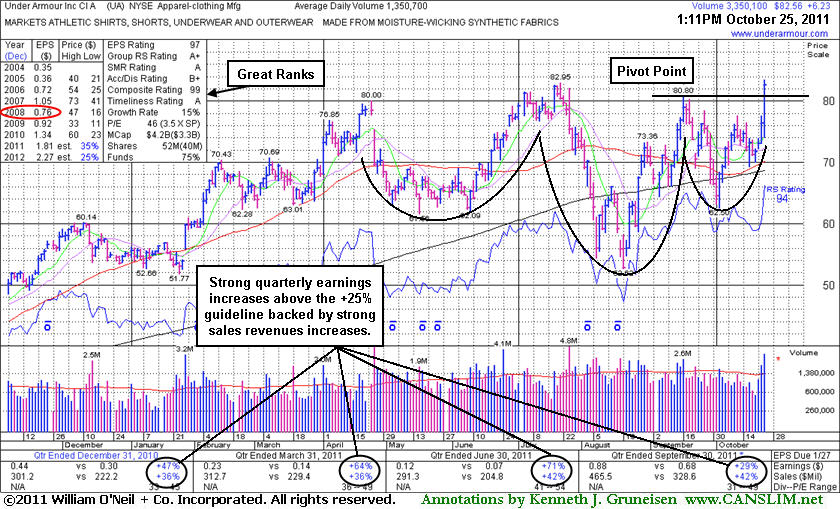
10/26/2011 5:47:54 PM - Y - Today's 5th consecutive gain, the 3rd straight gain with above average volume, helped it hit new 52-week and all-time highs. The rally and strong close above the new pivot point cited triggered a technical buy signal. Reported earnings +29% on +42% sales revenues for the quarter ended September 30, 2011 versus the year ago period. The new pivot point cited was based upon its 9/16/11 high after rallying clear of all overhead supply following a reverse-head-and-shoulders base pattern formed over the past 6 months. It had slumped below its 200 DMA during its deep consolidation after it was dropped from the Featured Stocks list on 8/02/11.
10/26/2011 2:00:40 PM - Y - On track for a 5th consecutive gain today with volume again running at an above average pace while it is poised for a best-ever close. Touched new 52-week and all-time highs with above average volume behind a considerable gain, however it finished the prior session below the new pivot point cited when highlighted in yellow in the 10/25/11 mid-day report. Reported earnings +29% on +42% sales revenues for the quarter ended September 30, 2011 versus the year ago period. The new pivot point cited was based upon its 9/16/11 high after rallying clear of all overhead supply following a reverse-head-and-shoulders base pattern formed over the past 6 months. It had slumped below its 200 DMA during its deep consolidation after it was dropped from the Featured Stocks list on 8/02/11.
10/25/2011 7:07:26 PM - Y - Touched new 52-week and all-time highs with above average volume behind a considerable gain, however it finished the session below the new pivot point cited when highlighted in yellow in the mid-day report earlier today. Reported earnings +29% on +42% sales revenues for the quarter ended September 30, 2011 versus the year ago period. The new pivot point cited was based upon its 9/16/11 high after rallying clear of all overhead supply following a reverse-head-and-shoulders base pattern formed over the past 6 months. It had slumped below its 200 DMA during its deep consolidation after it was dropped from the Featured Stocks list on 8/02/11.
10/25/2011 - Y - Hit a new 52-week and all-time high today with above average volume behind a considerable gain. Reported earnings +29% on +42% sales revenues for the quarter ended September 30, 2011 versus the year ago period. Color code is changed to yellow with new pivot point cited based on its 9/16/11 high while it is rallying clear of all overhead supply from a reverse-head-and-shoulders base pattern. It had slumped below its 200 DMA during its deep consolidation after it was dropped from the Featured Stocks list on 8/02/11.
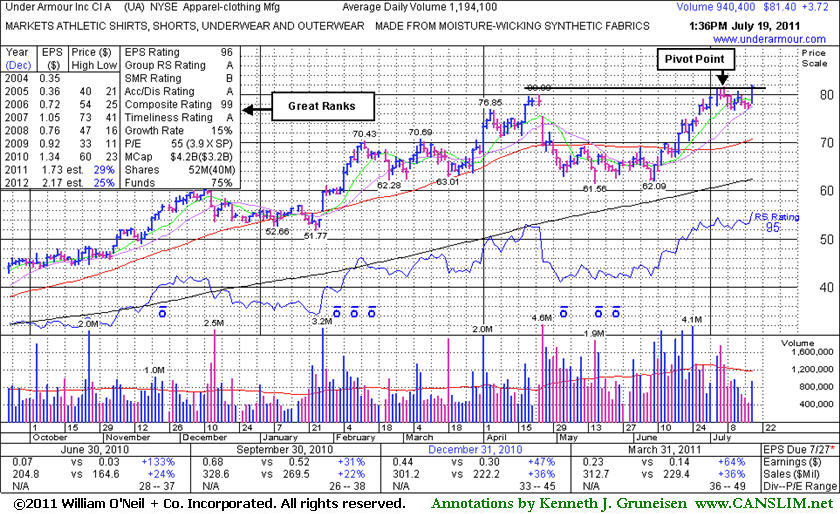
9/16/2011 1:37:54 PM - Approaching its 52-week high with above average volume behind today's 5th consecutive gain. It has not formed a sound base pattern and it had slumped below its 200 DMA during its deep consolidation after it was dropped from the Featured Stocks list on 8/02/11. Reported earnings +71% on +42% sales revenues for the quarter ended June 30, 2011 versus the year ago period, showing impressive acceleration in sales and earnings increases, sequentially.
9/15/2011 1:17:18 PM - Rebounding above its 50 DMA line and approaching its 52-week high. It has not formed a sound base pattern. It had slumped below its 200 DMA was dropped from the Featured Stocks list on 8/02/11. Reported earnings +71% on +42% sales revenues for the quarter ended June 30, 2011 versus the year ago period, showing impressive acceleration in sales and earnings increases, sequentially.
8/2/2011 4:22:23 PM - Down today on average volume, violating its 50 DMA line and raising concerns. UA did not confirm a proper technical buy signal since recently featured in yellow, and based on its damaging slump to a finish -16.6% off its 52-week high it will be dropped from the Featured Stocks list tonight. Reported earnings +71% on +42% sales revenues for the quarter ended June 30, 2011 versus the year ago period, showing impressive acceleration in sales and earnings increases, sequentially.
8/1/2011 6:35:05 PM - G - Recent slide has it trading near support at its 50 DMA line. UA did not confirm a proper technical buy signal since recently featured in yellow. Reported earnings +71% on +42% sales revenues for the quarter ended June 30, 2011 versus the year ago period, showing impressive acceleration in sales and earnings increases, sequentially.
7/28/2011 11:03:22 AM - G - Rebounding from its 50 DMA line today following a damaging streak of 6 consecutive losses. Technically, the pullback has been more than -50% of the depth of its cup and marked by heavy volume, so the latest consolidation cannot be considered a "handle" forming. UA did not confirm a proper technical buy signal since recently featured in yellow. Reported earnings +71% on +42% sales revenues for the quarter ended June 30, 2011 versus the year ago period, showing impressive acceleration in sales and earnings increases, sequentially. See latest FSU analysis for more details and a new annotated graph.
7/27/2011 5:21:32 PM - G - Fell to its 50 DMA line today with a 6th consecutive loss. Did not confirm a proper technical buy signal since recently featured in yellow. Reported earnings +71% on +42% sales revenues for the quarter ended June 30, 2011 versus the year ago period, showing impressive acceleration in sales and earnings increases, sequentially. See latest FSU analysis for more details and a new annotated graph.
7/26/2011 6:34:15 PM - G - Reported earnings +71% on +42% sales revenues for the quarter ended June 30, 2011 versus the year ago period, showing impressive acceleration in sales and earnings increases, sequentially. Color code was changed to green after enduring more distributional pressure and slumping more than -7% below its pivot point with a 5th consecutive loss on ever-increasing volume. Did not confirm a proper technical buy signal since recently featured in yellow. See latest FSU analysis for more details and a new annotated graph.
7/26/2011 4:40:58 PM - G - Reported earnings +71% on +42% sales revenues for the quarter ended June 30, 2011 versus the year ago period, showing impressive acceleration in sales and earnings increases, sequentially. Color code is changed to green after enduring more distributional pressure and slumping more than -7% below its pivot point with a 5th consecutive loss on ever-increasing volume. Did not confirm a proper technical buy signal since recently featured in yellow. UA found support near earlier lows in the $62 area after it was dropped from the Featured Stocks list on 5/03/11.
7/26/2011 2:54:32 PM - Y - Reported earnings +71% on +42% sales revenues for the quarter ended June 30, 2011 versus the year ago period, showing impressive acceleration in sales and earnings increases sequentially. Enduring more distributional pressure today, however, with a 5th consecutive loss on ever-increasing volume. Volume-driven gains did not confirm a proper technical buy signal since recently featured in yellow, and volume and volatility often increase near earnings news. UA found support near earlier lows in the $62 area after it was dropped from the Featured Stocks list on 5/03/11 and it rebounded impressively.
7/25/2011 6:34:53 PM - Y - Endured distributional pressure with a 4th consecutive loss today on ever increasing volume. Due to report earnings in the morning, Tuesday, July 26th. Its color code was changed to yellow in the 7/19/11 mid-day report with a new pivot point cited after forming a cup-with-handle base pattern, and subsequent gains have not yet confirmed a technical buy signal. UA found support near earlier lows in the $62 area after it was dropped from the Featured Stocks list on 5/03/11 and it has rebounded impressively.
7/20/2011 6:26:40 PM - Y - Pulled back today on lighter volume. Its color code was changed to yellow in the 7/19/11 mid-day report with a new pivot point cited after forming a cup-with-handle base pattern. It rallied and closed well above its pivot point, however that session's volume total, at +29% above average, did not reach the minimum threshold to trigger a proper technical buy signal. Subsequent gains could help confirm the breakout. UA found support near earlier lows in the $62 area after it was dropped from the Featured Stocks list on 5/03/11 and it has rebounded impressively. It is due to report earnings on the morning of July 26th.
7/19/2011 6:40:38 PM - Y - Its color code was changed to yellow in today's mid-day report with a new pivot point cited after forming a cup-with-handle base pattern. It rallied and closed well above its pivot point, however the session's volume total, at +29% above average, did not reach the minimum threshold to trigger a proper technical buy signal. Subsequent gains could help confirm the breakout. UA found support near earlier lows in the $62 area after it was dropped from the Featured Stocks list on 5/03/11 and it has rebounded impressively. It is due to report earnings on the morning of July 26th.
7/19/2011 - Y - Color code is changed to yellow with new pivot point cited after forming a cup-with-handle base pattern. A volume-driven gain and strong close above its pivot point may trigger a technical buy signal. It found support near earlier lows in the $62 area after it was dropped from the Featured Stocks list on 5/03/11 and it has rebounded impressively. It is due to report earnings on the morning of July 26th.
5/3/2011 4:21:26 PM - Down again today for a 3rd consecutive loss with above average volume, slumping further below its 50 DMA line and under prior chart highs after triggering technical sell signals noted last week. Based on weakness it will be dropped from the Featured Stocks list tonight. See the latest FSU analysis for details and a new annotated graph.
5/2/2011 2:27:33 PM - G - Down again today, slumping further below its 50 DMA line and under prior chart highs after triggering technical sell signals noted last week. See the latest FSU analysis for details and a new annotated graph.
4/29/2011 6:35:32 PM - G - Loss today with above average volume led to a close below its 50 DMA line and under prior chart highs, raising concerns and triggering a technical sell signal. See the latest FSU analysis for details and a new annotated graph.
4/29/2011 4:37:09 PM - G - Loss today with above average volume led to a close below its 50 DMA line and under prior chart highs, raising concerns and triggering a technical sell signal. A prompt rebound above that short-term average would help its outlook.
4/28/2011 5:17:08 PM - G - Holding its ground above its 50 DMA line and prior chart highs, churning above average volume again. It was down considerably with heavy volume on 4/26/11 after reporting earnings +64% on +36% sales revenues for the quarter ended March 31, 2011 versus the year ago period.
4/27/2011 5:13:21 PM - G - Held its ground at its 50 DMA line and prior chart highs today. It was down considerably with heavy volume on 4/26/11 after reporting earnings +64% on +36% sales revenues for the quarter ended March 31, 2011 versus the year ago period.
4/26/2011 11:57:53 AM - G - Down considerably today with heavy volume after reporting strong sales and earnings for the quarter ended March 31, 2011. Gapped down and it is now testing support near prior highs in the $70 area and its 50 DMA line.
4/20/2011 1:10:25 PM - G - Small gap up today following a strong finish for considerable gain on higher volume, hitting new all-time highs and getting more extended from its latest sound base pattern. Due to report earnings on the morning of Tuesday, April 26th for the latest quarter ended March 31, 2011. Prior highs in the $70 area define support to watch above its 50 DMA line.
4/19/2011 1:30:16 PM - G - Up today on higher volume for a new all-time high, getting extended from its latest sound base pattern. Due to report earnings on the morning of Tuesday, April 26th for the latest quarter ended March 31, 2011. Prior highs in the $70 area define support to watch above its 50 DMA line.
4/19/2011 10:17:59 AM - G - Up today for a new all-time high, getting extended from its latest sound base pattern. Due to report earnings on the morning of Tuesday, April 26th for the latest quarter ended March 31, 2011. Prior highs in the $70 area define support to watch above its 50 DMA line.
4/14/2011 5:12:10 PM - G - Small loss today with lighter than average volume, consolidating below its "max buy" level. The investment system permits investors to accumulate shares on light volume pullbacks, but research has proven that odds are best for a successful trade when buying is done as a stock is moving up in price rather than pulling back No overhead supply remaining to act as resistance. Following its 4/01/11 technical breakout, its prior highs in the $70 area define support to watch.
4/13/2011 5:20:22 PM - G - Gain today with lighter than average volume led to a close back above its "max buy" level and its color code is changed to green again. No overhead supply remaining to act as resistance. Following its 4/01/11 technical breakout, its prior highs in the $70 area define support to watch.
4/12/2011 1:42:38 PM - Y - Still consolidating above its pivot point and below its "max buy" level, with no overhead supply remaining to act as resistance. Following its 4/01/11 technical breakout, its prior highs in the $70 area define support to watch.
4/11/2011 4:10:12 PM - Y - Up today with higher volume, consolidating above its pivot point and below its "max buy" level No overhead supply remains to act as resistance. Following its 4/01/11 technical breakout, its prior highs in the $70 area define support to watch.
4/8/2011 4:30:51 PM - Y - Color code was changed to yellow while consolidating toward its pivot point on lighter volume following 3 consecutive volume-driven gains into new all-time high territory. Prior highs in the $70 area define support to watch.
4/6/2011 1:55:52 PM - Y - Color code is changed to yellow while consolidating back within 5% of its pivot point today following 3 consecutive volume-driven gains into new all-time high territory. Prior highs in the $70 area define support to watch.
4/5/2011 7:03:40 PM - G - Hit another new all-time high today with a 3rd consecutive gain, rising further above its 2007 all-time high ($73.40) and getting extended from its base-on-base pattern. Prior highs in the $70 area define support to watch.
4/4/2011 4:17:34 PM - G - Hit another new all-time high today, rising further above its 2007 all-time high ($73.40), and its color code is changed to green. A volume-driven gain above its pivot point triggered a new (or add-on) technical buy signal on 4/01/11 as it rose from a base-on-base type pattern. See the latest FSU analysis for more details and a new annotated graph.
4/1/2011 8:57:34 PM - Y - Volume-driven gains for a strong close above its pivot point triggered a new (or add-on) technical buy signal today. It rose from a base-on-base type pattern and even traded above its 2007 all-time high ($73.40) intra-day. See the latest FSU analysis for more details and a new annotated graph.
4/1/2011 1:46:46 PM - Y - As previously noted, "Volume-driven gains for a strong close above its pivot point may trigger a new (or add-on) technical buy signal", its considerable gain today with above average volume has it rising from a base-on-base type pattern for a new 52-week high. It is within close striking distance of its 2007 all-time high ($73.40) as well, and a move into new all-time high territory could help it build more upward momentum.
3/31/2011 4:02:30 PM - Y - Consolidating in an orderly fashion above its 50 DMA line forming a base-on-base type pattern. Color code is changed to yellow with a new pivot point based on its 52-week high plus 10 cents. Volume-driven gains for a strong close above its pivot point may trigger a new (or add-on) technical buy signal.
3/29/2011 5:23:20 PM - G - Posted a considerable gain with above average volume, rallying from its 50 DMA line and recent lows defining important chart support. It may be forming a base-on-base pattern, but more damaging losses would hurt its outlook.
3/25/2011 11:20:49 AM - G - Quietly holding its ground this week above its 50 DMA line and recent lows defining important chart support. It may be forming a base-on-base pattern, but more damaging losses would hurt its outlook.
3/22/2011 6:41:58 PM - G - Down today with light volume, slumping toward its 50 DMA line and recent lows defining important chart support. It may be forming a base-on-base pattern, but more damaging losses would hurt its outlook.
3/21/2011 1:41:53 PM - G -Small gap up today after slumping last week near its 50 DMA line and recent lows defining important chart support. It may be forming a base-on-base pattern, but more damaging losses would hurt its outlook.
3/18/2011 12:06:24 PM - G -Gapped down today, slumping near its 50 DMA line and recent lows defining important chart support. It may be forming a base-on-base pattern, but more damaging losses would hurt its outlook.
3/15/2011 10:32:22 AM - G -Gapped down today amid widespread market weakness. Its current consolidation has been healthy while forming a base-on-base type pattern.
3/11/2011 4:20:10 PM - G -Perched at its 52-week high, rising this week amid widespread weakness. Its consolidation has been healthy while forming a base-on-base type pattern. See the latest FSU analysis for more details and a new annotated graph.
3/10/2011 10:21:11 AM - G -Touched a new 52-week high this week then stalled, and there was a small gap down today amid widespread weakness. Prior resistance and its 50 DMA line in the $60 area define chart support to watch. Its brief consolidation has been healthy, but it needs more time to potentially form a sound base-on-base type pattern. See the latest FSU analysis for more details and a new annotated graph.
3/8/2011 12:54:58 PM - G -Touched a new 52-week high today with its 4th consecutive gain. Prior resistance and its 50 DMA line in the $60 area define chart support to watch. Its brief consolidation has been healthy, but it needs more time to potentially form a sound base-on-base type pattern. See the latest FSU analysis for more details and a new annotated graph.
3/7/2011 5:34:46 PM - G - Solid gain with above average volume today. Prior resistance and its 50 DMA line in the $60 area define chart support to watch. Its brief consolidation has been healthy, but it needs more time to potentially form a sound base-on-base type pattern.
3/3/2011 3:48:07 PM - G - Small gap up today, still quietly consolidating well above prior resistance and its 50 DMA line in the $60 area that define chart support to watch. It has not formed any recent sound base pattern.
3/1/2011 4:35:32 PM - G - Down today with below average volume, still quietly consolidating well above prior resistance and its 50 DMA line in the $60 area that define chart support to watch. It has not formed any recent sound base pattern.
2/28/2011 6:47:01 PM - G - Still quietly consolidating well above prior resistance and its 50 DMA line in the $60 area that define chart support to watch. It has not formed any recent sound base pattern.
2/25/2011 5:30:59 PM - G - Consolidating well above prior resistance and its 50 DMA line in the $60 area that define chart support to watch. It is extended from a sound base.
2/23/2011 2:27:17 PM - G - Down today without great volume conviction, slumping -8.1% off its 52-week high now. Following a recent spurt of gains with above average volume, prior resistance in the $60 area defines initial support to watch above its 50 DMA line.
2/18/2011 5:44:06 PM - G - Quietly hovering near its 52-week high, holding its ground following a recent spurt of gains with above average volume. Prior resistance in the $60 area defines initial support to watch above its 50 DMA line.
2/15/2011 3:53:53 PM - G - Quietly pulling back from its 52-week high following a recent spurt of gains with above average volume. Prior resistance in the $60 area defines initial support to watch above its 50 DMA line.
2/10/2011 4:44:22 PM - G - Hit another new 52-week high with a solid gain on above average volume today. Prior resistance in the $60 area defines initial support to watch above its 50 DMA line.
2/8/2011 4:53:01 PM - G - Extended its streak of gains with above average volume and hit another new 52-week high today. Prior resistance in the $60 area defines initial support to watch above its 50 DMA line.
2/7/2011 5:27:56 PM - G - Gain with above average volume, rising further above recent $60 resistance for another new 52-week high today. It is extended from a previously noted "double bottom" base pattern. Recent highs and its 50 DMA line define chart support to watch in the $56 area.
2/4/2011 1:49:55 PM - G - Considerable gain above recent $60 resistance for a new 52-week high today. It is extended from a previously noted "double bottom" base pattern. Recent highs and its 50 DMA line define chart support to watch in the $56 area.
2/4/2011 12:00:22 PM - G - Considerable gain today, rallying through recent resistance near $60 for a new 52-week high, getting extended from a previously noted "double bottom" base pattern. Recent highs and its 50 DMA line define chart support to watch in the $56 area.
2/1/2011 4:32:46 PM - G - Small gain today with above average volume. It closed the session above its "max buy" level, and its color code is changed to green. As previously noted - "It may encounter resistance at its 52-week high, and it remains well off its 2007 all-time high ($73.40)."
1/28/2011 1:52:52 PM - Y - Touched a new 52-week high today then reversed slightly into the red. A strong finish after a considerable gap up gain above its 50 DMA line helped it break out on 1/27/11 from a near-minimum-length 8-week "double bottom" type base, triggering a technical buy signal. The strength was noted as an immediate reaction to strong earnings and sales revenues increases reported for the quarter ended Dec 31, 2011 with positive guidance. Color code was changed to yellow with new pivot point cited based on its 1/19/11 high. Previously noted that it may encounter resistance at its 52-week high, and it remains well off its 2007 all-time high ($73.40).
1/27/2011 7:05:55 PM - Y - Closed near the session high after a considerable gap up gain above its 50 DMA line helped it break out from a near-minimum-length 8-week "double bottom" type base identified earlier today. The technical strength was noted as an immediate reaction to strong earnings and sales revenues increases reported for the quarter ended Dec 31, 2011 with positive guidance. Color code was changed to yellow with new pivot point cited based on its 1/19/11 high, and its close above it triggered a new technical buy signal. Previously noted that it may encounter resistance at its 52-week high, and it remains well off its 2007 all-time high ($73.40).
1/27/2011 1:49:02 PM - Y - Gapped up above its 50 DMA line and rallied above prior highs from a near-minimum-length 8-week "double bottom" type base today. The technical strength is noted as an immediate reaction to strong earnings and sales revenues increases reported for the quarter ended Dec 31, 2011 with positive guidance. Color code was changed to yellow with new pivot point cited based on its 1/19/11 high which has convincingly rallied above today. Previously noted that it may encounter resistance at its 52-week high, and it remains well off its 2007 all-time high ($73.40).
1/27/2011 10:57:05 AM - Y - Gapped up above its 50 DMA line and rallied above prior highs from a near-minimum-length 8-week "double bottom" type base today. The technical strength is noted as an immediate reaction to strong earnings and sales revenues increases reported for the quarter ended Dec 31, 2011 with positive guidance. Color code is changed to yellow with new pivot point cited based on its 1/19/11 high. It may encounter resistance at its 52-week high, and it remains well off its 2007 all-time high ($73.40).
1/25/2011 5:47:03 PM - G - Loss on above average volume led to a slump further below its 50 DMA line today. It closed in the upper half of its range after an intra-day dip below previously noted recent low ($52.66 on 1 10/11) defining an important chart support level to watch.
1/24/2011 5:52:17 PM - G - Traded up near its 50 DMA line today but encountered resistance and closed near the session low. It violated its 50 DMA line last week, raising concerns. The previously noted recent low ($52.66 on 1 10/11) defines an important chart support level to watch.
1/21/2011 5:47:42 PM - G - Today's 3rd consecutive loss came with volume picking up to above average as it slumped to its lowest close since November 18th. It violated its 50 DMA line this week, raising concerns. The previously noted recent low ($52.66 on 1 10/11) defines an important chart support level to watch.
1/20/2011 5:46:28 PM - G - Gapped down today, and losses this week with below average volume led to a violation of support at its 50 DMA line. The recent low ($52.66 on 1 10/11) defines an important chart support level to watch now.
1/18/2011 5:13:25 PM - G - Posted a 4th consecutive gain on light volume today. Working on a possible new base after 6 weeks of consolidation, it rallied with below average volume this week while finding support near its 50 DMA line.
1/14/2011 4:41:02 PM - G - Working on a possible new base after 6 weeks of consolidation, it rallied with below average volume this week while finding support near its 50 DMA line.
1/10/2011 4:08:01 PM - G - Rallied with below average volume for a close back above its 50 DMA line, finding prompt support near that short-term average.
1/5/2011 6:49:35 PM - G - Volume totals have been cooling while consolidating just above its 50 DMA line defining important support.
12/31/2010 3:32:53 PM - G - Volume totals have been cooling while consolidating near its 50 DMA line ($53.42 now) defining important support.
12/28/2010 4:11:43 PM - G - Down today with light volume while slumping under recent lows toward its 50 DMA line ($52.86 now) defining important support.
12/22/2010 1:35:48 PM - G - Down today for a considerable loss with volume increasing while slumping toward last week's low. The recent chart low ($53.60) and its 50 DMA line ($52.37 now) define important support levels to watch.
12/17/2010 6:22:43 PM - G - Gains on near average volume halted its slide after considerable losses with heavier volume this week were noted as distributional pressure. The high-ranked Apparel - Clothing firm was repeatedly noted as extended from any sound base and well above support at its 50 DMA line.
12/16/2010 6:23:42 PM - G - Gain today on average volume halted a slide after considerable losses with heavier volume were noted as distributional pressure. The high-ranked Apparel - Clothing firm was repeatedly noted as extended from any sound base and well above support at its 50 DMA line.
12/15/2010 1:31:22 PM - G - Considerable loss today with even heavier volume marks its 3rd straight day of distributional pressure. The high-ranked Apparel - Clothing firm was repeatedly noted as extended from any sound base and well above support at its 50 DMA line.
12/14/2010 4:23:56 PM - G - Considerable loss today with almost 2 times average volume was a sign of distributional pressure. The high-ranked Apparel - Clothing firm is extended from any sound base and well above support at its 50 DMA line.
12/10/2010 1:57:57 PM - G - Hovering near its 52-week high, stubbornly holding its ground. The high-ranked Apparel - Clothing firm is extended from any sound base and well above support at its 50 DMA line.
12/6/2010 5:17:19 PM - G - Hit yet another new 52-week high today with a small gain on light volume. The high-ranked Apparel - Clothing firm is very extended from any sound base and well above support at its 50 DMA line.
12/1/2010 6:06:04 PM - G - Hit yet another new 52-week high today, but closed near the session low. The high-ranked Apparel - Clothing firm is very extended from any sound base and well above support at its 50 DMA line.
11/30/2010 2:18:34 PM - G - Hit yet another new 52-week high today. The high-ranked Apparel - Clothing firm is very extended from any sound base and well above support at its 50 DMA line.
11/29/2010 12:58:18 PM - G - Paused after 7 consecutive gains for new 52-week highs, the high-ranked Apparel - Clothing firm is very extended from any sound base and well above support at its 50 DMA line.
11/24/2010 4:16:32 PM - G - Volume was above average today as it posted a 7th consecutive gain for a new 52-week high. The high-ranked Apparel - Clothing firm is very extended from any sound base and well above support at its 50 DMA line.
11/23/2010 5:29:59 PM - G - Today's 6th consecutive gain for a new 52-week high has it very extended from any sound base and support at its 50 DMA line.
11/19/2010 2:47:51 PM - G - Considerable gain today for a new 52-week high, getting more extended from any sound base and support at its 50 DMA line. It has not encountered any distributional pressure and could produce more climactic gains, however fundamental flaws with respect to the fact-based investment system have been recently noted as concerns.
11/18/2010 5:14:07 PM - G - Extended from any sound base and support at its 50 DMA line, it closed a penny below its best close of 2010 today. It has not encountered any distributional pressure and could produce more climactic gains, however fundamental flaws with respect to the fact-based investment system have been recently noted as concerns.
11/16/2010 4:34:02 PM - G - Extended from any sound base and support at its 50 DMA line, it posted a gain today and bucked a mostly negative market. It has not encountered any distributional pressure and could produce more climactic gains. Some fundamental flaws with respect to the fact-based investment system have been recently noted as concerns.
11/12/2010 4:09:45 PM - G - Extended from any sound base and support at its 50 DMA line. It has not encountered any distributional pressure and could produce more climactic gains. Some fundamental flaws with respect to the fact-based investment system have been recently noted as concerns.
11/11/2010 4:16:29 PM - G - Inched higher on light volume today for a new high close, getting more extended from any sound base and support at its 50 DMA line. It has not encountered any distributional pressure and could produce more climactic gains. Some fundamental flaws with respect to the fact-based investment system have been recently noted as concerns. See the latest FSU analysis for more important details and an annotated graph.
11/8/2010 4:47:44 PM - G - Considerable gain today for yet another new high, getting more extended from any sound base. Quarterly and annual earnings track record has some fundamental flaws with respect to the fact-based investment system. See the latest FSU analysis for more important details.
11/5/2010 11:02:48 AM - G - Considerable gain today for a new high. Quarterly and annual earnings track record has some fundamental flaws with respect to the fact-based investment system. See the latest FSU analysis for more important details.
11/4/2010 4:32:07 PM - G - Gain on average volume today for a new high close. Quarterly and annual earnings track record has some fundamental flaws with respect to the fact-based investment system. See tonight's FSU analysis for more important details.
11/3/2010 6:07:06 PM - G - Holding its ground with volume totals cooling, perched near its 52-week high and technically strong. It deserves the benefit of the doubt with a favorable backdrop from the M criteria currently favoring 3 out of 4 growth stocks. However, the weaker earnings increase (under the +25% guideline) raises concerns, fundamentally, with respect to the C criteria. Earlier notes acknowledged the downward turn in annual earnings (A criteria) in FY '08, another fundamental concern with respect to the fact-based investment system.
10/27/2010 2:00:50 PM - G - Gapped down today and held its ground on the prior session following a report of earnings +21% on +22% sales revenues for the quarter ended September 30, 2010 versus the year ago period. It remains near its 52-week high, in healthy shape technically, and may deserve the benefit of the doubt with a favorable backdrop from the M criteria currently favoring 3 out of 4 growth stocks. However, the weaker earnings increase (under the +25% guideline) raises concerns, fundamentally, with respect to the C criteria. Earlier notes acknowledged the downward turn in annual earnings (A criteria) in FY '08, another fundamental concern with respect to the fact-based investment system.
.
10/26/2010 1:12:31 PM - G - Gapped down today following a report of earnings +21% on +22% sales revenues for the quarter ended September 30, 2010 versus the year ago period. It remains near its 52-week high, in healthy shape technically, and may deserve the benefit of the doubt with a favorable backdrop from the M criteria currently favoring 3 out of 4 growth stocks. However, the weaker earnings increase (under the +25% guideline) raises concerns, fundamentally, with respect to the C criteria. Earlier notes acknowledged the downward turn in annual earnings (A criteria) in FY '08, another fundamental concern with respect to the fact-based investment system.
.
10/22/2010 2:15:55 PM - G - Gapped up today, rising without great volume conviction to within striking distance of a new high close. It has not formed a sound base after a prior streak of gains, so patient and disciplined investors will watch for secondary buy points to develop. Due to report earnings on Oct 26th.
10/19/2010 3:59:02 PM - G - Down on light volume today, slumping near recent chart lows amid widespread losses, while several high-ranked Apparel -Clothing firms are also enduring big losses. Company is due to report earnings on Oct 26th.
10/15/2010 3:21:51 PM - G - Hovering near its 52-week high with volume totals cooling after volume-driven gains. Company is due to report earnings on Oct 26th.
10/13/2010 11:45:22 AM - G - Gapped up today and hit a 52-week high. Company is due to report earnings on Oct 26th.
10/8/2010 3:38:48 PM - G - Big gain today with volume slightly above average volume has it poised for a new 2010 high close. It is extended from its latest sound base pattern after a considerable streak of gains.
10/5/2010 6:07:22 PM - G - Spiked to a new 2010 high on today's heavy volume session, then reversed most of its gain and ended near the session low. It is extended from its latest sound base pattern after a considerable streak of gains.
9/28/2010 5:00:03 PM - G - Closed at a new 2010 high today with its 18th gain in 20 sessions. It is extended from its latest sound base pattern.
9/22/2010 2:47:52 PM - G - Pulling back on lighter volume, it is extended from its latest sound base pattern following a streak of 14 consecutive gains.
9/20/2010 5:29:20 PM - G - Extended from its latest sound base pattern, it hit another new 52-week high today with its 14th consecutive gain.
9/16/2010 3:33:26 PM - G - At its 52-week high and on track today for its 12th consecutive gain. Its color code was changed to green after getting extended from its prior chart highs. Its 9/14/10 gain with +242% of its average daily volume clinched a technical buy signal.
9/15/2010 1:52:20 PM - G - Considerable gain today for another new 52-week high, on track for its 11th consecutive gain. Its color code was changed to green after getting extended from its prior chart highs. Its 9/14/10 gain with +242% of its average daily volume clinched a technical buy signal.
9/15/2010 11:26:44 AM - G - Considerable gain today for another new 52-week high, on track for its 11th consecutive gain. Trading above its "max buy" level, its color code is changed to green as it gets extended from its prior chart highs. Its 9/14/10 gain with +242% of its average daily volume clinched a technical buy signal.
9/14/2010 11:05:02 AM - Y - Today it hit another new 52-week high with its 10th consecutive gain since finding recent support near its 50 DMA line.
9/13/2010 5:18:37 PM - Y - Today it hit another new 52-week high with its 9th consecutive gain since finding recent support near its 50 DMA line.
9/10/2010 4:04:57 PM - Y - Today was its 8th consecutive gain since finding recent support near its 50 DMA line. A gain with substantial volume could confirm a technical buy signal. Recent quarters show improving sales revenues growth and big earnings increases following weaker comparisons. The downward turn in annual earnings (A criteria) in FY '08 remains a fundamental concern with respect to the fact-based investment system.
9/9/2010 1:36:52 PM - Y - Topped its 7/27/10 high earlier today with its 7th consecutive gain since finding recent support near its 50 DMA line. A gain with substantial volume could confirm a technical buy signal. Recent quarters show improving sales revenues growth and big earnings increases following weaker comparisons. The downward turn in annual earnings (A criteria) in FY '08 remains a fundamental concern with respect to the fact-based investment system. It was noted in the mid-day report on 9/07/10 and on 7/27/10 that UA was long ago dropped from the CANSLIM.net Featured Stocks list on 5/04/07 and it subsequently fell from $44.50 to as low as $11.94 before rebounding impressively.
9/7/2010 12:55:01 PM - Reversed into the red after early gains today helped it challenge its 52-week high. Recent quarters show improving sales and earnings following weaker comparisons and a downward turn in annual earnings (A criteria) in FY '08. Last noted in the 7/27/10 mid-day report as it negatively reversed, its first time noted since 5/04/07 when it had been dropped from the CANSLIM.net Featured Stocks list. It subsequently fell from $44.50 to as low as $11.94 before rebounding impressively.
7/27/2010 1:58:03 PM - Gapped up today for a new 52-week high and then reversed into the red. Recent quarters show improving sales and earnings following weaker comparisons and a downward turn in annual earnings (A criteria) in FY '08. Today marks the first time it has been noted since 5/04/07 when it had been dropped from the CANSLIM.net Featured Stocks list. It subsequently fell from $44.50 to as low as $11.94 before rebounding impressively.
5/4/2007 - Closing yesterday at session lows and BELOW its 200 DMA. This made for 3 days of well above average declines showing sure signs of distribution. Just reported earnings that are below the guidelines. Also, there is a lot of overhead supply at this point for the stock to work through to recover. As previously noted -Further declines below the recent lows ($44.63) and this stock will be removed from the CANSLIM.net Featured Stocks List. As of 5/3/07, it was removed. More details available in the 5/1/07 CANSLIM.net After Market Update with an annotated DailyGraph(R) here. Featured in the CANSLIM.net Bulletin of 12/5/06 available here.
8/9/2007 1:17:46 PM - "C" is below guidelines.
8/8/2007 1:45:53 PM - "C" is below guidelines.
8/3/2007 12:57:39 PM - "C" is below guidelines.
8/2/2007 12:26:27 PM - "C" is below guidelines.
5/3/2007 - G - Closed at session lows and BELOW its 200 DMA. This makes for 3 days of well above average declines showing sure signs of distribution. Just reported earnings that are below the guidelines. Also, there is a lot of overhead supply at this point for the stock to work through to recover. As previously noted -Further declines below the recent lows ($44.63) and this stock will be removed from the CANSLIM.net Featured Stocks List. As of tonight, it will be removed. More details available in the 5/1/07 CANSLIM.net After Market Update with an annotated DailyGraph(R) here. Featured in the CANSLIM.net Bulletin of 12/5/06 available here.
5/3/2007 - G - Looks to be closing at session lows and BELOW its 200 DMA. This would make for 3 days of well above average declines showing sure signs of distribution. Just reported earnings that are below the guidelines. Also, there is a lot of overhead supply at this point for the stock to work through to recover. As previously noted -Further declines below the recent lows ($44.63) and this stock will be removed from the CANSLIM.net Featured Stocks List. As of tonight, it will be removed. More details available in the 5/1/07 CANSLIM.net After Market Update with an annotated DailyGraph(R) here. Featured in the CANSLIM.net Bulletin of 12/5/06 available here.
5/2/2007 - G - Fairly tight trading range today after a plunge yesterday morning after announcing earnings that were below the guidelines. Further declines below the recent lows ($44.63) and this stock will be removed from the CANSLIM.net Featured Stocks List. More details available in the 5/1/07 CANSLIM.net After Market Update with an annotated DailyGraph(R) here. Featured in the CANSLIM.net Bulletin of 12/5/06 available here.
5/1/2007 - G - Plunged this morning after announcing earnings yet closed well off of session lows. Further declines below the recent lows ($44.63) and this stock will be removed from the CANSLIM.net Featured Stocks List. More details available in the 5/1/07 CANSLIM.net After Market Update with an annotated DailyGraph(R) here. Featured in the CANSLIM.net Bulletin of 12/5/06 available here.
5/1/2007 - G - Plunged this morning after announcing earnings yet is now trading well off of session lows. Further declines below the recent lows ($44.63) and this stock will be removed from the CANSLIM.net Featured Stocks List. More details available in the 4/3/07 CANSLIM.net After Market Update with an annotated DailyGraph(R) here. Featured in the CANSLIM.net Bulletin of 12/5/06 available here.
5/1/2007 - G - Plunged after announcing earnings yet is now trading well off of session lows. Further declines below the recent lows ($44.63) and this stock will be removed from the CANSLIM.net Featured Stocks List. More details available in the 4/3/07 CANSLIM.net After Market Update with an annotated DailyGraph(R) here. Featured in the CANSLIM.net Bulletin of 12/5/06 available here.
4/30/2007 - G -A well above average volume advance from support found at the 50 DMA ($49.20). Still,a break below there would be a sell signal. Further declines below the recent lows ($44.63) and this stock will be removed from the CANSLIM.net Featured Stocks List. More details available in the 4/3/07 CANSLIM.net After Market Update with an annotated DailyGraph(R) here. Featured in the CANSLIM.net Bulletin of 12/5/06 available here.
4/27/2007 - G -Declines today to near the 50 DMA ($49.14) as a short, recent downtrend has developed.A break below there would be a sell signal. Further declines below the recent lows ($44.63) and this stock will be removed from the CANSLIM.net Featured Stocks List. More details available in the 4/3/07 CANSLIM.net After Market Update with an annotated DailyGraph(R) here. Featured in the CANSLIM.net Bulletin of 12/5/06 available here.
4/26/2007 - G - Above average volume losses today with a close at session lows as a short, recent downtrend has developed. Price is nearing support of the 50 DMA ($49.10) and a break below there would be a sell signal. Further declines below the recent lows ($44.63) and this stock will be removed from the CANSLIM.net Featured Stocks List. More details available in the 4/3/07 CANSLIM.net After Market Update with an annotated DailyGraph(R) here. Additional details were posted in the CANSLIM.net Bulletin of 12/5/06 available here.
4/25/2007 - G - All gains today yet on about average volume. Further declines below the recent lows ($44.63) and this stock will be removed from the CANSLIM.net Featured Stocks List. More details available in the 4/3/07 CANSLIM.net After Market Update with an annotated DailyGraph(R) here. Additional details were posted in the CANSLIM.net Bulletin of 12/5/06 available here.
4/24/2007 - G - Just about all declines today on above average volume. Further declines below the recent lows ($44.63) and this stock will be removed from the CANSLIM.net Featured Stocks List. More details available in the 4/3/07 CANSLIM.net After Market Update with an annotated DailyGraph(R) here. Additional details were posted in the CANSLIM.net Bulletin of 12/5/06 available here.
4/23/2007 - G - Just about all declines today yet on below average volume. Further declines below the recent lows ($44.63) and this stock will be removed from the CANSLIM.net Featured Stocks List. More details available in the 4/3/07 CANSLIM.net After Market Update with an annotated DailyGraph(R) here. Additional details were posted in the CANSLIM.net Bulletin of 12/5/06 available here.
4/20/2007 - G - Below average volume gains again today after a 2.39% decline on 4/18 on above average volume. Now is above the max buy price so CANSLIM.net Status was changed to green. Still, further declines below the recent lows ($44.63) and this stock will be removed from the CANSLIM.net Featured Stocks List. More details available in the 4/3/07 CANSLIM.net After Market Update with an annotated DailyGraph(R) here. Additional details were posted in the CANSLIM.net Bulletin of 12/5/06 available here.
4/19/2007 - G - Below average volume gains today after a 2.39% decline yesterday on above average volume. Now is above the max buy price so CANSLIM.net Status was changed to green. Still, further declines below the recent lows ($44.63) and this stock will be removed from the CANSLIM.net Featured Stocks List. More details available in the 4/3/07 CANSLIM.net After Market Update with an annotated DailyGraph(R) here. Additional details were posted in the CANSLIM.net Bulletin of 12/5/06 available here.
4/18/2007 - G - 2.39% decline today on above average volume. Now is above the max buy price so CANSLIM.net Status was changed to green. Still, further declines below the recent lows ($44.63) and this stock will be removed from the CANSLIM.net Featured Stocks List. More details available in the 4/3/07 CANSLIM.net After Market Update with an annotated DailyGraph(R) here. Additional details were posted in the CANSLIM.net Bulletin of 12/5/06 available here.
4/17/2007 - G - Light volume declines today. Now is above the max buy price so CANSLIM.net Status is changed to green. Still, further declines below the recent lows ($44.63) and this stock will be removed from the CANSLIM.net Featured Stocks List. More details available in the 4/3/07 CANSLIM.net After Market Update with an annotated DailyGraph(R) here. Additional details were posted in the CANSLIM.net Bulletin of 12/5/06 available here.
4/16/2007 - G - Light volume, uneventful trading today. Now is above the max buy price so CANSLIM.net Status is changed to green. Still, further declines below the recent lows ($44.63) and this stock will be removed from the CANSLIM.net Featured Stocks List. More details available in the 4/3/07 CANSLIM.net After Market Update with an annotated DailyGraph(R) here. Additional details were posted in the CANSLIM.net Bulletin of 12/5/06 available here.
4/13/2007 - Y - A light volume decline today as it continues trading near the new pivot point. Stock is again approaching new highs and is in a base so a break above the new pivot point with the required volume would have it triggering another technical buy signal up to the max buy price. Still, further declines below the recent lows ($44.63) and this stock will be removed from the CANSLIM.net Featured Stocks List. More details available in the 4/3/07 CANSLIM.net After Market Update with an annotated DailyGraph(R) here. Additional details were posted in the CANSLIM.net Bulletin of 12/5/06 available here.
4/12/2007 - Y- A light volume slight loss again today as it continues trading near the new pivot point. Stock is again approaching new highs and is in a base so a break above the new pivot point with the required volume would have it triggering another technical buy signal up to the max buy price. Still, further declines below the recent lows ($44.63) and this stock will be removed from the CANSLIM.net Featured Stocks List. More details available in the 4/3/07 CANSLIM.net After Market Update with an annotated DailyGraph(R) here. Additional details were posted in the CANSLIM.net Bulletin of 12/5/06 available here.
4/11/2007 - Y- A light volume slight loss todayas it continues trading near the new pivot point. Stock is again approaching new highs and is in a base so a break above the new pivot point with the required volume would have it triggering another technical buy signal up to the max buy price. Still, further declines below the recent lows ($44.63) and this stock will be removed from the CANSLIM.net Featured Stocks List. More details available in the 4/3/07 CANSLIM.net After Market Update with an annotated DailyGraph(R) here. Additional details were posted in the CANSLIM.net Bulletin of 12/5/06 available here.
4/10/2007 - Y- Below average volume gains continue near the new pivot point. Stock is again approaching new highs and is in a base so a break above the new pivot point with the required volume would have it triggering another technical buy signal up to the max buy price. Still, further declines below the recent lows ($44.63) and this stock will be removed from the CANSLIM.net Featured Stocks List. More details available in the 4/3/07 CANSLIM.net After Market Update with an annotated DailyGraph(R) here. Additional details were posted in the CANSLIM.net Bulletin of 12/5/06 available here.
4/9/2007 - Y- Below average volume gains again today near the new pivot point. Stock is again approaching new highs and is in a base so a break above the new pivot point with the required volume would have it triggering another technical buy signal up to the max buy price. Still, further declines below the recent lows ($44.63) and this stock will be removed from the CANSLIM.net Featured Stocks List. More details available in the 4/3/07 CANSLIM.net After Market Update with an annotated DailyGraph(R) here. Additional details were posted in the CANSLIM.net Bulletin of 12/5/06 available here.
4/5/2007 - Y- Below average volume gains today near the new pivot point. Stock is again approaching new highs and is in a base so a break above the new pivot point with the required volume would have it triggering another technical buy signal up to the max buiy price. Still, further declines below the recent lows ($44.63) and this stock will be removed from the CANSLIM.net Featured Stocks List. More details available in the 4/3/07 CANSLIM.net After Market Update with an annotated DailyGraph(R) here. Additional details were posted in the CANSLIM.net Bulletin of 12/5/06 available here.
4/4/2007 - Y- Below average volume declines today near the new pivot point. Stock is again approaching new highs and is in a base so a break above the new pivot point with the required volume would have it triggering another technical buy signal up to the max buiy price. Still, further declines below the recent lows ($44.63) and this stock will be removed from the CANSLIM.net Featured Stocks List. More details available in the 4/3/07 CANSLIM.net After Market Update with an annotated DailyGraph(R) here. Additional details were posted in the CANSLIM.net Bulletin of 12/5/06 available here.
4/3/2007 - Y- Gains today just above the new pivot point yet volume fell just shy of the +50% guideline to trigger a technical buy signal. One to watch tomorrow AM. Stock is again approaching new highs and is in a base so CANSLIM.net Status is changed back to yellow. Still, further declines below the recent lows ($44.63) and this stock will be removed from the CANSLIM.net Featured Stocks List. More details available in the 4/3/07 CANSLIM.net After Market Update with an annotated DailyGraph(R) here. Additional details were posted in the CANSLIM.net Bulletin of 12/5/06 available here.
4/2/2007 - G - Light volume declines today. Still, further declines below the recent lows ($44.63) and this stock will be removed from the CANSLIM.net Featured Stocks List. More details available in the 3/19/07 CANSLIM.net After Market Update with an annotated DailyGraph(R) here. Additional details were posted in the CANSLIM.net Bulletin of 12/5/06 available here.
3/29/2007 - G - All gains today yet on below average volume. Still, further declines below the recent lows ($44.63) and this stock will be removed from the CANSLIM.net Featured Stocks List. More details available in the 3/19/07 CANSLIM.net After Market Update with an annotated DailyGraph(R) here. Additional details were posted in the CANSLIM.net Bulletin of 12/5/06 available here.
3/28/2007 - G - Closes with a decline today on just below average volume closing near session lows. Further declines below the recent lows ($44.63) and this stock will be removed from the CANSLIM.net Featured Stocks List. More details available in the 3/19/07 CANSLIM.net After Market Update with an annotated DailyGraph(R) here. Additional details were posted in the CANSLIM.net Bulletin of 12/5/06 available here.
3/27/2007 - G - All declines today on about average volume closing near session lows. Further declines below the recent lows ($44.63) and this stock will be removed from the CANSLIM.net Featured Stocks List. More details available in the 3/19/07 CANSLIM.net After Market Update with an annotated DailyGraph(R) here. Additional details were posted in the CANSLIM.net Bulletin of 12/5/06 available here.
3/26/2007 - G - Slight, light volume declines today. Further declines below the recent lows ($44.63) and this stock will be removed from the CANSLIM.net Featured Stocks List. More details available in the 3/19/07 CANSLIM.net After Market Update with an annotated DailyGraph(R) here. Additional details were posted in the CANSLIM.net Bulletin of 12/5/06 available here.
3/23/2007 - G - Nice price progress today, closing at session highs yet volume was only about average. Still, further declines below the recent lows ($44.63) and this stock will be removed from the CANSLIM.net Featured Stocks List. More details available in the 3/19/07 CANSLIM.net After Market Update with an annotated DailyGraph(R) here. Additional details were posted in the CANSLIM.net Bulletin of 12/5/06 available here.
3/22/2007 - G - Indecisive trading today on light volume, closing near unchanged. Still, further declines below the recent lows ($44.63) and this stock will be removed from the CANSLIM.net Featured Stocks List. More details available in the 3/19/07 CANSLIM.net After Market Update with an annotated DailyGraph(R) here. Additional details were posted in the CANSLIM.net Bulletin of 12/5/06 available here.
3/21/2007 - G - Solid price progrees today yet volume was below average. Still, further declines below the recent lows ($44.63) and this stock will be removed from the CANSLIM.net Featured Stocks List. More details available in the 3/19/07 CANSLIM.net After Market Update with an annotated DailyGraph(R) here. Further details were posted in the CANSLIM.net Bulletin of 12/5/06 available here.
3/20/2007 - G -Continued trading today above what was resistance and now may become support of the 50 DMA ($47.97).This action could prove significant. Still, further declines below the recent lows ($44.63) and this stock will be removed from the CANSLIM.net Featured Stocks List. More details available in the 3/19/07 CANSLIM.net After Market Update with an annotated DailyGraph(R) here. Further details were posted in the CANSLIM.net Bulletin of 12/5/06 available here.
3/19/2007 - G -Closes above what was short-term resistance of its 50 DMA ($47.96) with above average volume. This action could prove significant. Still, further declines below the recent lows ($44.63) and this stock will be removed from the CANSLIM.net Featured Stocks List. More details available in the 3/19/07 CANSLIM.net After Market Update with an annotated DailyGraph(R) here. Further details were posted in the CANSLIM.net Bulletin of 12/5/06 available here.
3/16/2007 - G -Was advancing right out of the gate this morning yet sold off quickly before noon and closed off of session lows as volume was about avergae. Trading continues under resistance of the 50 DMA ($47.97) and some overhead supply. Further declines below the recent lows ($44.63) and this stock will be removed from the CANSLIM.net Featured Stocks List. More details available in the 2/05/07 CANSLIM.net After Market Update with an annotated DailyGraph(R) here. Further details were posted in the CANSLIM.net Bulletin of 12/5/06 available here.
3/15/2007 - G -Slight gains today on light volume as trading continues under resistance of the 50 DMA ($48.02) and some overhead supply. Further declines below the recent lows ($44.63) and this stock will be removed from the CANSLIM.net Featured Stocks List. More details available in the 2/05/07 CANSLIM.net After Market Update with an annotated DailyGraph(R) here. Further details were posted in the CANSLIM.net Bulletin of 12/5/06 available here.
3/14/2007 - G - Just about all gains today and a close near session highs yet volume was only about average as trading continues under resistance of the 50 DMA ($48.09) and some overhead supply. Further declines below the recent lows ($44.63) and this stock will be removed from the CANSLIM.net Featured Stocks List. More details available in the 2/05/07 CANSLIM.net After Market Update with an annotated DailyGraph(R) here. Further details were posted in the CANSLIM.net Bulletin of 12/5/06 available here.
3/13/2007 - G - All declines today yet on about average volume as trading continues under resistance of the 50 DMA ($48.18) and some overhead supply. Further declines below the recent lows ($44.63) and this stock will be removed from the CANSLIM.net Featured Stocks List. More details available in the 2/05/07 CANSLIM.net After Market Update with an annotated DailyGraph(R) here. Further details were posted in the CANSLIM.net Bulletin of 12/5/06 available here.
3/12/2007 - G - Light volume tight trading range today as trading continues under resistance of the 50 DMA ($48.29) and some overhead supply. Further declines below the recent lows ($44.63) and this stock will be removed from the CANSLIM.net Featured Stocks List. More details available in the 2/05/07 CANSLIM.net After Market Update with an annotated DailyGraph(R) here. Further details were posted in the CANSLIM.net Bulletin of 12/5/06 available here.
3/9/2007 - G - Slight gap open yet drifted lower through-out the session to close off of session highs as volume was below average. Continues trading under resistance of the 50 DMA ($48.36) and some overhead supply. Further declines below the recent lows ($44.63) and this stock will be removed from the CANSLIM.net Featured Stocks List. More details available in the 2/05/07 CANSLIM.net After Market Update with an annotated DailyGraph(R) here. Further details were posted in the CANSLIM.net Bulletin of 12/5/06 available here.
3/8/2007 - G - Slight gap open and gains today closing at sesion highs yet volume was below average. Continues trading under resistance of the 50 DMA ($48.43) and some overhead supply. Further declines below the recent lows ($44.63) and this stock will be removed from the CANSLIM.net Featured Stocks List. More details available in the 2/05/07 CANSLIM.net After Market Update with an annotated DailyGraph(R) here. Further details were posted in the CANSLIM.net Bulletin of 12/5/06 available here.
3/7/2007 - G - All declines today yet on below average volume. Continues trading under resistance of the 50 DMA ($48.53) and some overhead supply. Further declines below the recent lows ($44.63) and this stock will be removed from the CANSLIM.net Featured Stocks List. More details available in the 2/05/07 CANSLIM.net After Market Update with an annotated DailyGraph(R) here. Further details were posted in the CANSLIM.net Bulletin of 12/5/06 available here.
3/6/2007 - G - Gap open gains today yet volume was only about average. Continues trading under resistance of the 50 DMA ($48.99) and some overhead supply. Further declines below the recent lows ($44.63) and this stock will be removed from the CANSLIM.net Featured Stocks List. More details available in the 2/05/07 CANSLIM.net After Market Update with an annotated DailyGraph(R) here. Further details were posted in the CANSLIM.net Bulletin of 12/5/06 available here.
3/2/2007 - G - New recent lows today closing just below support at $45 on about average volume as it continues trading under resistance of the 50 DMA ($48.99) and some overhead supply. Further declines below the recent lows ($44.63) and this stock will be removed from the CANSLIM.net Featured Stocks List. More details available in the 2/05/07 CANSLIM.net After Market Update with an annotated DailyGraph(R) here. Further details were posted in the CANSLIM.net Bulletin of 12/5/06 available here.
3/1/2007 - G - Traded up today from support near $45 on about average volume as it continues trading under resistance of the 50 DMA ($49.49) and some overhead supply. Further declines below the recent lows ($44.63) and this stock will be removed from the CANSLIM.net Featured Stocks List. More details available in the 2/05/07 CANSLIM.net After Market Update with an annotated DailyGraph(R) here. Further details were posted in the CANSLIM.net Bulletin of 12/5/06 available here.
2/28/2007 - G - Traded up today from support near $45 yet on below average volume. Continues trading under resistance of the 50 DMA ($49.13) and some overhead supply. Further declines below the recent lows ($44.63) and this stock will be removed from the CANSLIM.net Featured Stocks List. More details available in the 2/05/07 CANSLIM.net After Market Update with an annotated DailyGraph(R) here. Further details were posted in the CANSLIM.net Bulletin of 12/5/06 available here.
2/27/2007 - G - Considerable declines today on above average volume closing near session lows and further under what is now resistance of the 50 DMA ($49.21) and some overhead supply. Further declines below the recent lows ($44.63) and this stock will be removed from the CANSLIM.net Featured Stocks List. More details available in the 2/05/07 CANSLIM.net After Market Update with an annotated DailyGraph(R) here. Further details were posted in the CANSLIM.net Bulletin of 12/5/06 available here.
2/26/2007 - G - Light volume with slight declines continue further under what is now resistance of the 50 DMA ($49.28) and some overhead supply. Further declines below the recent lows ($44.63) and this stock will be removed from the CANSLIM.net Featured Stocks List. More details available in the 2/05/07 CANSLIM.net After Market Update with an annotated DailyGraph(R) here. Further details were posted in the CANSLIM.net Bulletin of 12/5/06 available here.
2/23/2007 - G - Light volume, slight decline again today just under what is now resistance of the 50 DMA ($49.34) and some overhead supply. Further declines below the recent lows ($44.63) and this stock will be removed from the CANSLIM.net Featured Stocks List. More details available in the 2/05/07 CANSLIM.net After Market Update with an annotated DailyGraph(R) here. Further details were posted in the CANSLIM.net Bulletin of 12/5/06 available here.
2/22/2007 - G - Light volume decline today after trading higher intra-day. Under what is now resistance of the 50 DMA ($49.39) and some overhead supply. Further declines below the recent lows ($44.63) and this stock will be removed from the CANSLIM.net Featured Stocks List. More details available in the 2/05/07 CANSLIM.net After Market Update with an annotated DailyGraph(R) here. Further details were posted in the CANSLIM.net Bulletin of 12/5/06 available here.
2/21/2007 - G - Below average volume declines today as it continues trading under what is now resistance of the 50 DMA ($49.45) and some overhead supply. Further declines below the recent lows ($44.63) and this stock will be removed from the CANSLIM.net Featured Stocks List. More details available in the 2/05/07 CANSLIM.net After Market Update with an annotated DailyGraph(R) here. Further details were posted in the CANSLIM.net Bulletin of 12/5/06 available here.
2/20/2007 - G - Below average volume gains today as it continues trading under what is now resistance of the 50 DMA ($49.45) and some overhead supply. Further declines below the recent lows ($44.63) and this stock will be removed from the CANSLIM.net Featured Stocks List. More details available in the 2/05/07 CANSLIM.net After Market Update with an annotated DailyGraph(R) here. Further details were posted in the CANSLIM.net Bulletin of 12/5/06 available here.
2/16/2007 - G - Closes with a gain after being lower intra-day and volume remains quiet. Still trading under what is now resistance of the 50 DMA ($49.45) and some overhead supply. Further declines below the recent lows ($44.63) and this stock will be removed from the CANSLIM.net Featured Stocks List. More details available in the 2/05/07 CANSLIM.net After Market Update with an annotated DailyGraph(R) here. Further details were posted in the CANSLIM.net Bulletin of 12/5/06 available here.
2/15/2007 - G - Quite a tight range trading day today. Still trading under what is now resistance of the 50 DMA and some overhead supply. Further declines below the recent lows ($44.63) and this stock will be removed from the CANSLIM.net Featured Stocks List. More details available in the 2/05/07 CANSLIM.net After Market Update with an annotated DailyGraph(R) here. Further details were posted in the CANSLIM.net Bulletin of 12/5/06 available here.
2/14/2007 - G - Light volume advance today closing up 1.34%. Still trading under what is now resistance of the 50 DMA and some overhead supply. Further declines below the recent lows ($44.63) and this stock will be removed from the CANSLIM.net Featured Stocks List. More details available in the 2/05/07 CANSLIM.net After Market Update with an annotated DailyGraph(R) here. Further details were posted in the CANSLIM.net Bulletin of 12/5/06 available here.
2/13/2007 - G - Closes with a declines after being higher intra-day as volume was below average. Further declines below the recent lows ($44.63) and this stock will be removed from the CANSLIM.net Featured Stocks List. More details available in the 2/05/07 CANSLIM.net After Market Update with an annotated DailyGraph(R) here. Further details were posted in the CANSLIM.net Bulletin of 12/5/06 available here.
2/9/2007 - G - Declines today on below average volume. Further declines below the recent lows $44.63 and this stock will be removed from the CANSLIM.net Featured Stocks List. More details available in the 2/05/07 CANSLIM.net After Market Update with an annotated DailyGraph(R) here. Further details were posted in the CANSLIM.net Bulletin of 12/5/06 available here.
2/8/2007 - G - Continued above average volume gains today and a close near session highs. Moving up from noted support near $45. Still, further declines below the recent lows $44.63 and this stock will be removed from the CANSLIM.net Featured Stocks List. More details available in the 2/05/07 CANSLIM.net After Market Update with an annotated DailyGraph(R) here. Further details were posted in the CANSLIM.net Bulletin of 12/5/06 available here.
2/7/2007 - G - Solid gains today with volume conviction and a close just off of session highs. Moving up from noted support near $45. Still, further declines below the recent lows $44.63 and this stock will be removed from the CANSLIM.net Featured Stocks List. More details available in the 2/05/07 CANSLIM.net After Market Update with an annotated DailyGraph(R) here. Further details were posted in the CANSLIM.net Bulletin of 12/5/06 available here.
2/6/2007 - G - All gains today yet on below average volume after yesterday's new recent lows. Near noted support near $45 yet also near the 8% sell rule area. RS has declined below the desired 80+. Further declines and this stock will be removed from the CANSLIM.net Featured Stocks List. More details available in the 2/05/07 CANSLIM.net After Market Update with an annotated DailyGraph(R) here. Further details were posted in the CANSLIM.net Bulletin of 12/5/06 available here.
2/5/2007 - G - Further declines today to new recent lows. Now just below noted support near $45 yet also near the 8% sell rule area. RS has declined below the desired 80+. Further declines and this stock will be removed from the CANSLIM.net Featured Stocks List. More details available in the 2/05/07 CANSLIM.net After Market Update with an annotated DailyGraph(R) here. Further details were posted in the CANSLIM.net Bulletin of 12/5/06 available here.
2/5/2007 - G - Further declines this morning to new recent lows. Now just below noted support near $45 yet also near the 8% sell rule area. RS has declined below the desired 80+. Further declines and this stock will be removed from the CANSLIM.net Featured Stocks List. More details available in the 1/22/07 CANSLIM.net After Market Update with an annotated DailyGraph(R) here. Further details were posted in the CANSLIM.net Bulletin of 12/5/06 available here.
2/2/2007 - G - Further above average volume declines today closing near session lows after yesterday's gap down below the 50 DMA after missing estimates and triggering another noted sell signal. A/D rank has fallen. Some support near $45 yet that is also in the 8% sell rule area. Further declines and this stock will be removed from the CANSLIM.net Featured Stocks List. More details available in the 1/22/07 CANSLIM.net After Market Update with an annotated DailyGraph(R) here. Further details were posted in the CANSLIM.net Bulletin of 12/5/06 available here.
2/1/2007 - G - Gap down below the 50 DMA this morning, down 6.25% after missing estimates. Closed in the lower half of its trading range triggering another sell signal. Some support near $45 yet that is also in the 8% sell rule area.. More details available in the 1/22/07 CANSLIM.net After Market Update with an annotated DailyGraph(R) here. Further details were posted in the CANSLIM.net Bulletin of 12/5/06 available here.
2/1/2007 - G - Above average volume declines this moring down 6.25% as misses estimates. Trading below the 50 DMA ($49.36). More details available in the 1/22/07 CANSLIM.net After Market Update with an annotated DailyGraph(R) here. Further details were posted in the CANSLIM.net Bulletin of 12/5/06 available here.
1/31/2007 - G - All declines today and a close near session lows yet on below average volume as trading continues just off of all-time highs and above the 50 DMA ($49.36). More details available in the 1/22/07 CANSLIM.net After Market Update with an annotated DailyGraph(R) here. Further details were posted in the CANSLIM.net Bulletin of 12/5/06 available here.
1/30/2007 - G - Closes with a gain after being a bit lower intra-day as volume was below average. Trading above the 50 DMA ($49.22). More details available in the 1/22/07 CANSLIM.net After Market Update with an annotated DailyGraph(R) here. Further details were posted in the CANSLIM.net Bulletin of 12/5/06 available here.
1/29/2007 - G - All gains today and a close at session highs yet on below average volume. Trading above the 50 DMA ($48.99). More details available in the 1/22/07 CANSLIM.net After Market Update with an annotated DailyGraph(R) here. Further details were posted in the CANSLIM.net Bulletin of 12/5/06 available here.
1/26/2007 - G - Light volume gains today trading up just less than 1/2 a precent. Held above the 50 DMA ($48.99). More details available in the 1/22/07 CANSLIM.net After Market Update with an annotated DailyGraph(R) here. Further details were posted in the CANSLIM.net Bulletin of 12/5/06 available here.
1/25/2007 - G - Just about all declines today yet held above the 50 DMA ($48.89) as volume was below average. More details available in the 1/22/07 CANSLIM.net After Market Update with an annotated DailyGraph(R) here. Further details were posted in the CANSLIM.net Bulletin of 12/5/06 available here.
1/24/2007 - G - Gains continue today all above the 50 DMA ($48.79) and closing near session highs yet volume was below average. More details available in the 1/22/07 CANSLIM.net After Market Update with an annotated DailyGraph(R) here. As previously noted - ''This stock has encountered resistance several times in the past 8 weeks near $49, and the prior resistance has not been cleared until the stock closes above its old high close with gains backed by heavy volume. If UA fails to follow through, the odds of a sustained rise and meaningful gains would be greatly reduced. Further details were posted in the CANSLIM.net Bulletin of 12/5/06 available here.
1/24/2007 - G - Gains continue this morning. More details available in the 1/22/07 CANSLIM.net After Market Update with an annotated DailyGraph(R) here. As previously noted - ''This stock has encountered resistance several times in the past 8 weeks near $49, and the prior resistance has not been cleared until the stock closes above its old high close with gains backed by heavy volume. If UA fails to follow through, the odds of a sustained rise and meaningful gains would be greatly reduced. Further details were posted in the CANSLIM.net Bulletin of 12/5/06 available here.
1/23/2007 - G - Gap open this morning with volume conviction closing up over 3% with volume conviction and above the 50 DMA ($48.72) after sharp declines yesterday down almost 8% on almost 3 times average volume. Triggered a second recent sell signal. More details available in the 1/22/07 CANSLIM.net After Market Update with an annotated DailyGraph(R) here. For investor's who decide to stick with this issue, some support now remains near $45 yet that is also near the 8% final stop loss area. As previously noted - ''This stock has encountered resistance several times in the past 8 weeks near $49, and the prior resistance has not been cleared until the stock closes above its old high close with gains backed by heavy volume. If UA fails to follow through, the odds of a sustained rise and meaningful gains would be greatly reduced. Further details were posted in the CANSLIM.net Bulletin of 12/5/06 available here.
1/23/2007 - G - Gap open this morning with volume conviction and looks to be closing up over 5% with volume conviction and above the 50 DMA ($48.72) after sharp declines yesterday down almost 8% on almost 3 times average volume. Triggered a second recent sell signal. More details available in the 1/22/07 CANSLIM.net After Market Update with an annotated DailyGraph(R) here. For investor's who decide to stick with this issue, some support now remains near $45 yet that is also near the 8% final stop loss area. As previously noted - ''This stock has encountered resistance several times in the past 8 weeks near $49, and the prior resistance has not been cleared until the stock closes above its old high close with gains backed by heavy volume. If UA fails to follow through, the odds of a sustained rise and meaningful gains would be greatly reduced. Further details were posted in the CANSLIM.net Bulletin of 12/5/06 available here.
1/23/2007 - G - Gap open this morning with volume conviction now up over 4% and trading above the 50 DMA ($48.72) after sharp declines yesterday down almost 8% on almost 3 times average volume. Triggered a second recent sell signal. The first came on 01/03 as the stocks price broke its upward trendline (seen on a daily chart ) and was noted here. For investor's who decide to stick with this issue, some support now remains near $45 yet that is also near the 8% final stop loss area. As previously noted - ''This stock has encountered resistance several times in the past 8 weeks near $49, and the prior resistance has not been cleared until the stock closes above its old high close with gains backed by heavy volume. If UA fails to follow through, the odds of a sustained rise and meaningful gains would be greatly reduced. Further details were posted in the CANSLIM.net Bulletin of 12/5/06 available here. Recently covered in more detail in the 1/22/07 CANSLIM.net After Market Update with an annotated DailyGraph(R) here.
1/22/2007 - G - Down almost 8% on almost 3 times average volume. Looks to be closing below where support was recently found at the 50 DMA triggering what is now a second recent sell signal. The first came on 01/03 as the stocks price broke its upward trendline (seen on a daily chart ) and was noted here. For investor's who decide to stick with this issue, some support now remains near $45 yet that is also near the 8% final stop loss area. As previously noted - ''This stock has encountered resistance several times in the past 8 weeks near $49, and the prior resistance has not been cleared until the stock closes above its old high close with gains backed by heavy volume. If UA fails to follow through, the odds of a sustained rise and meaningful gains would be greatly reduced. Further details were posted in the CANSLIM.net Bulletin of 12/5/06 available here. Recently covered in more detail in the 1/22/07 CANSLIM.net After Market Update with an annotated DailyGraph(R) here.
1/22/2007 - G - Down over 5% this morning after closing with a slight gain after being lower intra-day as volume was light on Friday. It is important to note that this stock has encountered resistance several times in the past 8 weeks near $49, and this prior resistance has not been cleared until the stock closes above its old high close with gains backed by heavy volume. If UA fails to follow through, the odds of a sustained rise and meaningful gains would be greatly reduced. Further details in the CANSLIM.net Bulletin of 12/5/06 available here.
1/19/2007 - G - Closes with a slight gain after being lower intra-day as volume was light. It is important to note that this stock has encountered resistance several times in the past 8 weeks near $49, and this prior resistance has not been cleared until the stock closes above its old high close with gains backed by heavy volume. If UA fails to follow through, the odds of a sustained rise and meaningful gains would be greatly reduced. Further details in the CANSLIM.net Bulletin of 12/5/06 available here.
1/18/2007 - G - Rather uneventful trading today. It is important to note that this stock has encountered resistance several times in the past 8 weeks near $49, and this prior resistance has not been cleared until the stock closes above its old high close with gains backed by heavy volume. If UA fails to follow through, the odds of a sustained rise and meaningful gains would be greatly reduced. Further details in the CANSLIM.net Bulletin of 12/5/06 available here.
12/5/2006 - Y - Traded under UARM before 12/18/06. Gap open gains today triggering a technical buy signal. It is important to note that this stock has encountered resistance several times in the past 8 weeks near $49, and this prior resistance has not been cleared until the stock closes above its old high close with gains backed by heavy volume. If UARM fails to follow through, the odds of a sustained rise and meaningful gains would be greatly reduced. Further details in the CANSLIM.net Bulletin of 12/5/06 available here.
12/5/2006 - Y - Traded under UARM before 12/18/06. Gap open gains today triggering a technical buy signal. It is important to note that this stock has encountered resistance several times in the past 8 weeks near $49, and this prior resistance has not been cleared until the stock closes above its old high close with gains backed by heavy volume. If UARM fails to follow through, the odds of a sustained rise and meaningful gains would be greatly reduced.
12/6/2006 - Y - Traded under UARM before 12/18/06. Solid gains today triggering a technical buy signal. As previously noted - this stock has encountered resistance several times in the past 8 weeks near $49, and this prior resistance has not been cleared until the stock closes above its old high close with gains backed by heavy volume. If UARM fails to follow through, the odds of a sustained rise and meaningful gains would be greatly reduced. Further details in the CANSLIM.net Bulletin of 12/5/06 available here.
12/7/2006 - Y - Traded under UARM before 12/18/06. Had some gains intra-day yet closed with a loss on about average volume. Solid gains on 12/06 triggered a technical buy signal. First featured in the CANSLIM.net Mid-Day report of 12/5 here. Further details in the CANSLIM.net Bulletin of 12/5/06 available here.
12/7/2006 - Y - Traded under UARM before 12/18/06. Was higher in the morning session yet now is trading with a modest loss. Solid gains yesterday triggering a technical buy signal. As previously noted - this stock has encountered resistance several times in the past 8 weeks near $49, and this prior resistance has not been cleared until the stock closes above its old high close with gains backed by heavy volume. If UARM fails to follow through, the odds of a sustained rise and meaningful gains would be greatly reduced. Further details in the CANSLIM.net Bulletin of 12/5/06 available here.
12/8/2006 - Y - Traded under UARM before 12/18/06. Gains today on about average volume as price is at all-time highs. Solid gains on 12/06 triggered a technical buy signal. First featured in the CANSLIM.net Mid-Day report of 12/5 here. Further details in the CANSLIM.net Bulletin of 12/5/06 available here.
12/11/2006 - G- Traded under UARM before 12/18/06. Had better gains intra-day yet on about average volume and closed well off of session highs. Price is at all-time highs. Now trading above the max buy price so CANSLIM.net Status is changed to green. Solid gains on 12/06 triggered a technical buy signal. First featured in the CANSLIM.net Mid-Day report of 12/5 here. Further details in the CANSLIM.net Bulletin of 12/5/06 available here.
12/12/2006 - G- Traded under UARM before 12/18/06. Considerable declines today closing near session lows yet on below average volume. Solid gains on 12/06 triggered a technical buy signal. First featured in the CANSLIM.net Mid-Day report of 12/5 here. Further details in the CANSLIM.net Bulletin of 12/5/06 available here.
12/13/2006 - G- Traded under UARM before 12/18/06. Closes with a decline today after having gains intra-day as volume is once again below average. Solid gains on 12/06 triggered a technical buy signal. First featured in the CANSLIM.net Mid-Day report of 12/5 here. Further details in the CANSLIM.net Bulletin of 12/5/06 available here.
12/14/2006 - G- Traded under UARM before 12/18/06. Slight gap open and gains today closing at session highs yet volume was light. Solid gains on 12/06 triggered a technical buy signal. First featured in the CANSLIM.net Mid-Day report of 12/5 here. Further details in the CANSLIM.net Bulletin of 12/5/06 available here.
12/15/2006 - G - Traded under UARM before 12/18/06. All gains today and closes with a 1.7% gain yet on below average volume. Just off of all-time highs with not much resistance in the way of new highs. Solid gains on 12/06 triggered a technical buy signal. First featured in the CANSLIM.net Mid-Day report of 12/5 here. Further details in the CANSLIM.net Bulletin of 12/5/06 available here
1/18/2007 10:56:07 AM - G - Indecisive trading yesterday closing with a slight gain as volume remained below average. Continues holding above the 50 DMA ($46.97). Still trading below what was initial support of an upward trendline. Support near the 50 DMA ($46.97) and a break of that level would be a solid sell siginal. Solid gains on 12/06 triggered a technical buy signal. First featured in the CANSLIM.net Mid-Day report of 12/5 here. Further details in the CANSLIM.net Bulletin of 12/5/06 available here. NOTE: Recent Symbol change from UARM to UA as it now trades on the NYSE.
1/17/2007 - G - Indecisive trading today closing with a slight gain as volume remains below average. Continues holding above the 50 DMA ($46.97). Still trading below what was initial support of an upward trendline. Support near the 50 DMA ($46.97) and a break of that level would be a solid sell siginal. Solid gains on 12/06 triggered a technical buy signal. First featured in the CANSLIM.net Mid-Day report of 12/5 here. Further details in the CANSLIM.net Bulletin of 12/5/06 available here. NOTE: Recent Symbol change from UARM to UA as it now trades on the NYSE.
1/16/2007 - G - All gains today yet on light volume. Trading continues above the 50 DMA ($46.97). Still trading below what was initial support of an upward trendline. Support near the 50 DMA ($46.97) and a break of that level would be a solid sell siginal. Solid gains on 12/06 triggered a technical buy signal. First featured in the CANSLIM.net Mid-Day report of 12/5 here. Further details in the CANSLIM.net Bulletin of 12/5/06 available here. NOTE: Recent Symbol change from UARM to UA as it now trades on the NYSE.
1/12/2007 - G - Closes with a slight decline yet on light volume. Trading continues above the 50 DMA ($46.97). Still trading below what was initial support of an upward trendline. Support near the 50 DMA ($46.97) and a break of that level would be a solid sell siginal. Solid gains on 12/06 triggered a technical buy signal. First featured in the CANSLIM.net Mid-Day report of 12/5 here. Further details in the CANSLIM.net Bulletin of 12/5/06 available here. NOTE: Recent Symbol change from UARM to UA as it now trades on the NYSE.
1/11/2007 - G - Somewhat indecisive trading today closing with a slight gain yet on below average volume. Trading continues above the 50 DMA ($46.97). Still trading below what was initial support of an upward trendline. Support near the 50 DMA ($46.97) and a break of that level would be a solid sell siginal. Solid gains on 12/06 triggered a technical buy signal. First featured in the CANSLIM.net Mid-Day report of 12/5 here. Further details in the CANSLIM.net Bulletin of 12/5/06 available here. NOTE: Recent Symbol change from UARM to UA as it now trades on the NYSE.
1/10/2007 - G - Closes with a gain today and at session highs yet volume was light. Trading continues above the 50 DMA ($46.97). Still trading below what was initial support of an upward trendline. Support near the 50 DMA ($46.97) and a break of that level would be a solid sell siginal. Solid gains on 12/06 triggered a technical buy signal. First featured in the CANSLIM.net Mid-Day report of 12/5 here. Further details in the CANSLIM.net Bulletin of 12/5/06 available here. NOTE: Recent Symbol change from UARM to UA as it now trades on the NYSE.
1/9/2007 - G - Ends the day with a slight loss yet on light volume as trading continues above the 50 DMA ($46.97). Still trading below what was initial support of an upward trendline. Support near the 50 DMA ($46.97) and a break of that level would be a solid sell siganal. Solid gains on 12/06 triggered a technical buy signal. First featured in the CANSLIM.net Mid-Day report of 12/5 here. Further details in the CANSLIM.net Bulletin of 12/5/06 available here. NOTE: Recent Symbol change from UARM to UA as it now trades on the NYSE.
1/8/2007 - G - Ends the day with a gain yet on light volume as trading continues above the 50 DMA ($46.97).Still trading below what was initial support of an upward trendline. Support near the 50 DMA ($46.97) and a break of that level would be a solid sell siganal. Solid gains on 12/06 triggered a technical buy signal. First featured in the CANSLIM.net Mid-Day report of 12/5 here. Further details in the CANSLIM.net Bulletin of 12/5/06 available here. NOTE: Recent Symbol change from UARM to UA as it now trades on the NYSE.
1/5/2007 - G - Slight gap down and declines today yet on below average volume. Has been trading below initial support near an upward trendline. Support near the 50 DMA ($46.97) and a break of that level would be a solid sell siganal. Solid gains on 12/06 triggered a technical buy signal. First featured in the CANSLIM.net Mid-Day report of 12/5 here. Further details in the CANSLIM.net Bulletin of 12/5/06 available here. NOTE: Recent Symbol changefrom UARM to UA as it now trades on the NYSE.
1/5/2007 - G - Declines today yet on light volume. Now trading below initial support near an upward trendline. Further support near the 50 DMA ($46.97) and a break of that level would be a solid sell siganal. Solid gains on 12/06 triggered a technical buy signal. First featured in the CANSLIM.net Mid-Day report of 12/5 here. Further details in the CANSLIM.net Bulletin of 12/5/06 available here. NOTE: Recent Symbol change from UARM to UA as it now trades on the NYSE.
1/4/2007 - G - Declines today yet on light volume. Now trading below initial support near an upward trendline. Further support near the 50 DMA ($46.97) and a break of that level would be a solid sell siganal. Solid gains on 12/06 triggered a technical buy signal. First featured in the CANSLIM.net Mid-Day report of 12/5 here. Further details in the CANSLIM.net Bulletin of 12/5/06 available here. NOTE: Recent Symbol change from UARM to UA as it now trades on the NYSE.
1/3/2007 - G - Some gains intra-day yet closed with a loss although on below average volume. Now trading below initial support near an upward trendline. Further support near the 50 DMA ($46.97) and a break of that level would be a solid sell siganal. Solid gains on 12/06 triggered a technical buy signal. First featured in the CANSLIM.net Mid-Day report of 12/5 here. Further details in the CANSLIM.net Bulletin of 12/5/06 available here. NOTE: Symbol change last week from UARM to UA as it now trades on the NYSE.
12/29/2006 - G - Slight gains intra-day yet closed with a loss on very light volume as price is near all-time highs. Initial support near an upward trendline and further support near the 50 DMA ($46.97). Solid gains on 12/06 triggered a technical buy signal. First featured in the CANSLIM.net Mid-Day report of 12/5 here. Further details in the CANSLIM.net Bulletin of 12/5/06 available here. NOTE: Symbol change last week from UARM to UA as it now trades on the NYSE.
12/27/2006 - G - Gains today after being lower intra-day yet on very light volume as price is near all-time highs. Initial support near an upward trendline and further support near the 50 DMA ($46.97). Solid gains on 12/06 triggered a technical buy signal. First featured in the CANSLIM.net Mid-Day report of 12/5 here. Further details in the CANSLIM.net Bulletin of 12/5/06 available here. NOTE: Symbol change last week from UARM to UA as it now trades on the NYSE.
12/26/2006 - G - Gains today on very light volume as price is near all-time highs. Initial support near an upward trendline and further support near the 50 DMA ($46.97). Solid gains on 12/06 triggered a technical buy signal. First featured in the CANSLIM.net Mid-Day report of 12/5 here. Further details in the CANSLIM.net Bulletin of 12/5/06 available here. NOTE: Symbol change last week from UARM to UA as it now trades on the NYSE.
12/22/2006 - G - All declines today yet on light volume as price is near all-time highs. Initial support near an upward trendline and further support near the 50 DMA ($46.97). Solid gains on 12/06 triggered a technical buy signal. First featured in the CANSLIM.net Mid-Day report of 12/5 here. Further details in the CANSLIM.net Bulletin of 12/5/06 available here. NOTE: Symbol change this week from UARM to UA as it now trades on the NYSE.
12/21/2006 - G - Light volume gains today as price is at all-time high close. Support near the 50 DMA ($46.97). Solid gains on 12/06 triggered a technical buy signal. First featured in the CANSLIM.net Mid-Day report of 12/5 here. Further details in the CANSLIM.net Bulletin of 12/5/06 available here. NOTE: Symbol change this week from UARM to UA as it now trades on the NYSE.
12/20/2006 - G - All gains today yet on light volume. Support near the 50 DMA ($46.97). Solid gains on 12/06 triggered a technical buy signal. First featured in the CANSLIM.net Mid-Day report of 12/5 here. Further details in the CANSLIM.net Bulletin of 12/5/06 available here. NOTE: Symbol change this week from UARM to UA as it now trades on the NYSE.
12/19/2006 - G - Traded considerably lower today after yesterday's negative reversal on above average volume yet closed near unchanged as volume was light. Support near the 50 DMA ($46.97). Solid gains on 12/06 triggered a technical buy signal. First featured in the CANSLIM.net Mid-Day report of 12/5 here. Further details in the CANSLIM.net Bulletin of 12/5/06 available here. NOTE: Symbol change yesterday from UARM to UA as it now trades on the NYSE.
12/18/2006 - G - Symbol Change to UA effective 12/18/2006, was UARM. All gains today and closes with a 1.7% gain yet on below average volume. Just off of all-time highs with not much resistance in the way of new highs. Solid gains on 12/06 triggered a technical buy signal. First featured in the CANSLIM.net Mid-Day report of 12/5 here. Further details in the CANSLIM.net Bulletin of 12/5/06 available here