11/11/2024 1:16:19 PM - Hovering near its 52-week high with recent gains backed by above average volume. Fundamental concerns remain. Reported Sep '24 quarterly earnings +39% on +26% sales revenues versus the year-ago period. Two of the 4 latest quarterly comparisons showed earnings increases above the +25% minimum earnings guideline (C criteria) versus the year ago period. Went through a deep consolidation since dropped from the Featured Stocks list on 1/04/22.
11/8/2024 12:37:16 PM - Gapped down today but recovered from the early low. Hit a new 52-week high on the prior session with a 3rd consecutive gain backed by above average volume. Fundamental concerns remain. Reported Sep '24 quarterly earnings +39% on +26% sales revenues versus the year-ago period. Two of the 4 latest quarterly comparisons showed earnings increases above the +25% minimum earnings guideline (C criteria) versus the year ago period. Went through a deep consolidation since dropped from the Featured Stocks list on 1/04/22.
11/7/2024 12:56:18 PM - Gapped up today hitting a new 52-week high with a 3rd consecutive gain backed by above average volume. Fundamental concerns remain. Reported Sep '24 quarterly earnings +39% on +26% sales revenues versus the year-ago period. Two of the 4 latest quarterly comparisons showed earnings increases above the +25% minimum earnings guideline (C criteria) versus the year ago period. Went through a deep consolidation since dropped from the Featured Stocks list on 1/04/22.
7/24/2024 12:53:58 PM - Gapped down today violating its 50 DMA line ($96) with a volume-driven loss, abruptly retreating after wedging to a new 52-week high with gains lacking great volume conviction. Prior mid-day reports cautioned members - "Fundamental concerns remain. Reported Mar '24 quarterly earnings +13% on +28% sales revenues versus the year-ago period. Two of the 4 latest quarterly comparisons showed earnings increases above the +25% minimum earnings guideline (C criteria) versus the year ago period. Went through a deep consolidation since dropped from the Featured Stocks list on 1/04/22."
7/10/2024 12:57:22 PM - Reversed into the red today after hitting a new 52-week high. Prior mid-day reports cautioned members - "Fundamental concerns remain. Reported Mar '24 quarterly earnings +13% on +28% sales revenues versus the year-ago period. Two of the 4 latest quarterly comparisons showed earnings increases above the +25% minimum earnings guideline (C criteria) versus the year ago period. Went through a deep consolidation since dropped from the Featured Stocks list on 1/04/22."
6/10/2024 1:06:05 PM - Pulling back from its 52-week high with today's 3rd consecutive loss following gains lacking great volume conviction. Prior mid-day reports cautioned members - "Fundamental concerns remain. Reported Mar '24 quarterly earnings +13% on +28% sales revenues versus the year-ago period. Two of the 4 latest quarterly comparisons showed earnings increases above the +25% minimum earnings guideline (C criteria) versus the year ago period. Went through a deep consolidation since dropped from the Featured Stocks list on 1/04/22."
6/5/2024 12:45:11 PM - Perched near its 52-week high with today's 3rd consecutive gain lacking great volume conviction. Prior mid-day reports cautioned members - "Fundamental concerns remain. Reported Mar '24 quarterly earnings +13% on +28% sales revenues versus the year-ago period. Two of the 4 latest quarterly comparisons showed earnings increases above the +25% minimum earnings guideline (C criteria) versus the year ago period. Went through a deep consolidation since dropped from the Featured Stocks list on 1/04/22."
5/16/2024 12:29:32 PM - Hitting a new 52-week high with today's 2nd consecutive volume-driven gain. The 5/09/24 mid-day report cautioned members - "Fundamental concerns remain. Reported Mar '24 quarterly earnings +13% on +28% sales revenues versus the year-ago period. Two of the 4 latest quarterly comparisons showed earnings increases above the +25% minimum earnings guideline (C criteria) versus the year ago period. Went through a deep consolidation since dropped from the Featured Stocks list on 1/04/22."
5/9/2024 12:37:58 PM - Perched within close striking distance of its 52-week high. Fundamental concerns remain. Reported Mar '24 quarterly earnings +13% on +28% sales revenues versus the year-ago period. Two of the 4 latest quarterly comparisons showed earnings increases above the +25% minimum earnings guideline (C criteria) versus the year ago period. Went through a deep consolidation since dropped from the Featured Stocks list on 1/04/22.
2/20/2024 12:27:04 PM - Gapped down today abruptly retreating after hitting a new 52-week high on the prior session. Fundamental concerns remain. Reported Dec '23 quarterly earnings +8% on +23% sales revenues versus the year-ago period. Two of the 4 latest quarterly comparisons showed earnings increases above the +25% minimum earnings guideline (C criteria) versus the year ago period. Went through a deep consolidation since dropped from the Featured Stocks list on 1/04/22.
10/16/2023 12:50:58 PM - Testing support near its 50 DMA line ($79.28) and it faces resistance due to overhead supply up to the $114 level. Fundamental concerns remain. Reported Jun '23 quarterly earnings +40% on +23% sales revenues versus the year-ago period. Two of the 4 latest quarterly comparisons showed earnings increases below the +25% minimum earnings guideline (C criteria) versus the year ago period. Went through a deep consolidation since dropped from the Featured Stocks list on 1/04/22.
7/19/2023 12:39:56 PM - Perched near its 52-week high following a noted a spurt of 7 consecutive gains marked by volume. It faces resistance due to overhead supply up to the $114 level and prior mid-day reports noted - "Fundamental concerns remain after it reported Mar '23 quarterly earnings +10% on +21% sales revenues versus the year-ago period. Three of the 4 latest quarterly comparisons showed earnings increases below the +25% minimum earnings guideline (C criteria) versus the year ago period. Went through a deep consolidation since dropped from the Featured Stocks list on 1/04/22."
7/18/2023 1:21:32 PM - Pulling back from its 52-week high with today's loss after 7 consecutive gains marked by volume. It faces resistance due to overhead supply up to the $114 level and prior mid-day reports noted - "Fundamental concerns remain after it reported Mar '23 quarterly earnings +10% on +21% sales revenues versus the year-ago period. Three of the 4 latest quarterly comparisons showed earnings increases below the +25% minimum earnings guideline (C criteria) versus the year ago period. Went through a deep consolidation since dropped from the Featured Stocks list on 1/04/22."
7/17/2023 12:38:06 PM - Perched at its 52-week high with today's 7th consecutive gain, but it faces resistance due to overhead supply up to the $114 level. Prior mid-day reports noted - "Fundamental concerns remain after it reported Mar '23 quarterly earnings +10% on +21% sales revenues versus the year-ago period. Three of the 4 latest quarterly comparisons showed earnings increases below the +25% minimum earnings guideline (C criteria) versus the year ago period. Went through a deep consolidation since dropped from the Featured Stocks list on 1/04/22."
7/14/2023 12:37:37 PM - Hit yet another new 52-week high with today's 6th consecutive gain, but it faces resistance due to overhead supply up to the $114 level. Prior mid-day reports noted - "Fundamental concerns remain after it reported Mar '23 quarterly earnings +10% on +21% sales revenues versus the year-ago period. Three of the 4 latest quarterly comparisons showed earnings increases below the +25% minimum earnings guideline (C criteria) versus the year ago period. Went through a deep consolidation since dropped from the Featured Stocks list on 1/04/22."
7/13/2023 1:06:10 PM - Hitting a new 52-week high with today's 5th consecutive gain but faces resistance due to overhead supply up to the $114 level. The 6/02/23 mid-day report last noted - "Fundamental concerns remain after it reported Mar '23 quarterly earnings +10% on +21% sales revenues versus the year-ago period. Three of the 4 latest quarterly comparisons showed earnings increases below the +25% minimum earnings guideline (C criteria) versus the year ago period. Went through a deep consolidation since dropped from the Featured Stocks list on 1/04/22."
6/2/2023 1:08:10 PM - Fundamental concerns remain after it reported Mar '23 quarterly earnings +10% on +21% sales revenues versus the year-ago period. Three of the 4 latest quarterly comparisons showed earnings increases below the +25% minimum earnings guideline (C criteria) versus the year ago period. Went through a deep consolidation since dropped from the Featured Stocks list on 1/04/22. Faces resistance due to overhead supply up to the $114 level.
5/10/2023 12:55:03 PM - Due to report Mar '23 quarterly results. Fundamental concerns remain after it reported Dec '22 quarterly earnings -10% on +24% sales revenues versus the year-ago period. Went through a deep consolidation since dropped from the Featured Stocks list on 1/04/22. Faces resistance due to overhead supply up to the $114 level.
1/4/2022 5:53:10 PM - Volume was higher behind today's damaging loss violating its 50 DMA line ($91.92) and undercutting the prior low. It will be dropped from the Featured Stocks list tonight. Only a prompt rebound above the 50 DMA line would help its outlook improve. Faces resistance due to overhead supply up to the $114 level.
12/31/2021 5:01:58 PM - G - Volume totals have been cooling while consolidating above the prior high ($90) and finding prompt support near its 50 DMA line ($91.51). Recent resilience has helped its outlook improve, but it faces resistance due to overhead supply up to the $114 level.
12/29/2021 3:54:48 PM - G - Consolidating above the prior high ($90) and finding prompt support near its 50 DMA line ($91). Recent resilience has helped its outlook improve, but it faces resistance due to overhead supply up to the $114 level.
12/23/2021 5:33:24 PM - G - Today's gain with below average volume helped it rebound further above the prior high ($90) after finding prompt support near its 50 DMA line ($90). Recent resilience has helped its outlook improve, but it faces overhead supply up to the $114 level.
12/21/2021 6:01:11 PM - G - Today's gain with below average volume helped it rebound above the prior high ($90) after finding prompt support near its 50 DMA line ($89.21). Recent resilience has helped its outlook improve, but it faces overhead supply up to the $114 level.
12/20/2021 5:51:22 PM - G - It has quietly slumped below the prior high ($90) and below its 50 DMA line ($88.76) both which were noted as important support to watch. Only a prompt rebound above the 50 DMA line would help its outlook improve. See the latest FSU analysis for more details and a new annotated graph.
12/16/2021 5:50:06 PM - G - Slumped today with below average volume, raising concerns as it undercut the prior high ($90) and closed below its 50 DMA line ($88.02) both which were noted as important support to watch. Only a prompt rebound above the 50 DMA line would help its outlook improve.
12/15/2021 5:48:07 PM - G - Posted a gain today with below average volume. Found prompt support after briefly undercutting the prior high ($90) and testing its 50 DMA line ($87.65) which defines important support to watch.
12/14/2021 1:37:24 PM - G - Undercut the prior high ($90) and today's 4th consecutive loss with light volume is testing its 50 DMA line ($87.14) which defines important support to watch.
12/9/2021 6:13:42 PM - G - Consolidating near its "max buy" level. It has not formed a sound base of sufficient length but found support near the prior high ($90). More damaging losses would raise serious concerns and its 50 DMA line ($85.81) defines additional support to watch.
12/7/2021 5:46:04 PM - G - Color code is changed to green after rising above its "max buy" level again with today's gain on light volume. Found support after falling near the prior high ($90). More damaging losses would raise serious concerns and its 50 DMA line ($84.70) defines additional support to watch.
12/3/2021 5:28:58 PM - Y - Color code is changed to yellow after falling near the prior high ($90) with today's big loss on near average volume. More damaging losses would raise serious concerns and its 50 DMA line ($84.04) defines additional support to watch.
12/1/2021 4:47:00 PM - G - There was another big loss today after a "negative reversal" on the prior session. It is still extended from the prior high ($90). Its 50 DMA line ($83.37) defines additional support to watch.
11/30/2021 5:49:54 PM - G - There was another "negative reversal" today after early gains. Extended from the previously noted 9-month cup-with-handle shaped base. Prior high ($90) and its 50 DMA line ($83) define initial support to watch.
11/29/2021 5:09:18 PM - G - Volume totals have been cooling while consolidating after getting extended from the previously noted 9-month cup-with-handle shaped base. Prior highs define initial support to watch.
11/22/2021 1:31:34 PM - G - Abruptly pulling back with today's 3rd loss in 4 sessions after a spurt of volume-driven gains left it very extended from the previously noted 9-month cup-with-handle shaped base. Prior highs define initial support to watch.
11/18/2021 2:46:13 PM - G - Pulling back with lighter volume after a spurt of volume-driven gains left it very extended from the previously noted 9-month cup-with-handle shaped base. Prior highs define initial support to watch.
11/16/2021 1:19:58 PM - G - Posting yet another big gain today with higher volume, getting very extended from prior highs. Disciplined investors avoid chasing extended stocks. Found support near the August high on the pullback after its noted breakout from a 9-month cup-with-handle shaped base.
11/15/2021 12:37:51 PM - G - Posting another big gain today with higher volume, getting very extended from prior highs. Found support near the August high on the pullback after its noted breakout from a 9-month cup-with-handle shaped base.
11/12/2021 1:23:21 PM - G - Posting a big gain today with higher volume while rising above its "max buy" level and its color code is changed to green. Found support near the August high on the pullback after its noted breakout from a 9-month cup-with-handle shaped base.
11/11/2021 3:49:44 PM - Y - Posting a gain today with lighter volume, finding support near the August high. Highlighted in yellow in the 11/09/21 mid-day report with new pivot point cited based on its 8/10/21 high as it broke out from a 9-month cup-with-handle shaped base.
11/10/2021 1:27:00 PM - Y - Pulling back today and undercutting the pivot point raising some concerns. Finished strong after highlighted in yellow in the prior mid-day report with new pivot point cited based on its 8/10/21 high after a 9-month cup-with-handle shaped base. Hit a new all-time high with its 2nd consecutive big volume-driven gain triggering a technical buy signal. Do not be confused as a 10:1 split impacted the share price as of 6/17/21. Reported Sep '21 quarterly earnings +38% on +39% sales revenues versus the year ago period, and prior quarterly comparisons showed very strong sales revenues and earnings increases well above the +25% minimum earnings guideline (C criteria). Annual earnings history has been strong. See the latest FSU analysis for more details and an annotated graph.
11/9/2021 5:50:15 PM - Y - Finished strong after highlighted in yellow in the earlier mid-day report with new pivot point cited based on its 8/10/21 high after a 9-month cup-with-handle shaped base. Hit a new all-time high with today's 2nd consecutive big volume-driven gain triggering a technical buy signal. Do not be confused as a 10:1 split impacted the share price as of 6/17/21. Reported Sep '21 quarterly earnings +38% on +39% sales revenues versus the year ago period, and prior quarterly comparisons showed very strong sales revenues and earnings increases well above the +25% minimum earnings guideline (C criteria). Annual earnings history has been strong. See the latest FSU analysis for more details and a new annotated graph.
11/9/2021 1:19:02 PM - Y - Color code is changed to yellow with new pivot point cited based on its 8/10/21 high after a 9-month cup-with-handle shaped base. Touched a new all-time high with today's 2nd consecutive big volume-driven gain. Do not be confused as a 10:1 split impacted the share price as of 6/17/21. Reported Sep '21 quarterly earnings +38% on +39% sales revenues versus the year ago period, and prior quarterly comparisons showed very strong sales revenues and earnings increases well above the +25% minimum earnings guideline (C criteria). Annual earnings history has been strong.
8/10/2021 12:52:00 PM - Rebounding toward its all-time high with today's big volume-driven gain. Still faces some resistance due to overhead supply up to the $97 level. Do not be confused as a 10:1 split impacted the share price as of 6/17/21. Reported Jun '21 quarterly earnings +100% on +101% sales revenues versus the year ago period. The 4 latest quarterly comparisons showed very strong sales revenues and earnings increases well above the +25% minimum earnings guideline (C criteria). Annual earnings history has been strong.
2/19/2021 1:30:39 PM - Rebounding toward its all-time high with today's big volume-driven gain. Faces resistance due to overhead supply up to the $972 level. Found support after slumping below its 50 DMA line ($844) since last noted in the 12/28/20 mid-day report. Reported Dec '20 quarterly earnings +149% on +48% sales revenues versus the year ago period. Three of the past 4 quarterly comparisons showed very strong sales revenues and earnings increases. Annual earnings history has been strong. It has shown impressive resilience and strength since dropped from the Featured Stocks list on 8/27/20.
12/28/2020 12:52:51 PM - Abruptly retreating from its all-time high with today's big volume-driven loss. Wedged higher with gains lacking volume conviction since last noted with caution in the 11/11/20 mid-day report - "Very extended from any sound base. Reported Sep '20 quarterly earnings +69% on +32% sales revenues versus the year ago period, a solid improvement after a negative comparison in the Jun quarter raised fundamental concerns. It has shown impressive resilience and strength since dropped from the Featured Stocks list on 8/27/20."
11/11/2020 12:45:20 PM - Consolidating since a big gap up gain on 11/06/20 when hitting a new all-time high and last noted in the mid-day report - "Very extended from any sound base. Reported Sep '20 quarterly earnings +69% on +32% sales revenues versus the year ago period, a solid improvement after a negative comparison in the Jun quarter raised fundamental concerns. It has shown impressive resilience and strength since dropped from the Featured Stocks list on 8/27/20."
11/6/2020 1:00:30 PM - Gapped up today hitting another new all-time high, very extended from any sound base. Reported Sep '20 quarterly earnings +69% on +32% sales revenues versus the year ago period, a solid improvement after a negative comparison in the Jun quarter raised fundamental concerns. It has shown impressive resilience and strength since dropped from the Featured Stocks list on 8/27/20.
10/21/2020 12:31:01 PM - Perched near its all-time high, very extended from any sound base. Prior mid-day reports cautioned members - "It did not form a sound base pattern. Recently reported Jun '20 quarterly earnings -3% on -13% sales revenues versus the year ago period, raising fundamental concerns. It has shown resilience since dropped from the Featured Stocks list on 8/27/20."
10/16/2020 12:33:42 PM - Gapped down on the prior session, abruptly retreating from its all-time high. Posted 14 consecutive gains. Prior mid-day reports cautioned members - "It did not form a sound base pattern. Recently reported Jun '20 quarterly earnings -3% on -13% sales revenues versus the year ago period, raising fundamental concerns. It has shown resilience since dropped from the Featured Stocks list on 8/27/20."
10/15/2020 12:59:52 PM - Gapped down today, abruptly retreating from its all-time high. Posted a 14th consecutive gain when the 10/14/20 mid-day report cautioned members - "It did not form a sound base pattern. Recently reported Jun '20 quarterly earnings -3% on -13% sales revenues versus the year ago period, raising fundamental concerns. It has shown resilience since dropped from the Featured Stocks list on 8/27/20."
10/14/2020 1:13:21 PM - Hitting yet another new all-time high with today's 14th consecutive gain. It did not form a sound base pattern. Recently reported Jun '20 quarterly earnings -3% on -13% sales revenues versus the year ago period, raising fundamental concerns. It has shown resilience since dropped from the Featured Stocks list on 8/27/20.
10/7/2020 12:59:52 PM - Hitting yet another new all-time high with today's 9th consecutive gain. It did not form a sound base pattern. Recently reported Jun '20 quarterly earnings -3% on -13% sales revenues versus the year ago period, raising fundamental concerns. It has shown resilience since dropped from the Featured Stocks list on 8/27/20.
10/2/2020 12:27:55 PM - Hitting another new all-time high with today's 6th consecutive gain. It did not form a sound base pattern. Recently reported Jun '20 quarterly earnings -3% on -13% sales revenues versus the year ago period, raising fundamental concerns. It has shown resilience since dropped from the Featured Stocks list on 8/27/20.
10/1/2020 1:03:39 PM - Hitting a new all-time high with today's 5th consecutive gain. It did not form a sound base pattern. Recently reported Jun '20 quarterly earnings -3% on -13% sales revenues versus the year ago period, raising fundamental concerns. It has shown resilience since dropped from the Featured Stocks list on 8/27/20.
9/4/2020 6:10:28 PM - Violated its 50 DMA line ($455) with today's big loss on higher volume triggering a technical sell signal, abruptly retreating after wedging to a new all-time high this week. Recently reported Jun '20 quarterly earnings -3% on -13% sales revenues versus the year ago period, raising fundamental concerns. It will be dropped from the Featured Stocks list tonight.
9/3/2020 6:37:39 PM - G - Suffered a big loss with +17% above average volume today, abruptly retreating from its all-time high. Recently reported Jun '20 quarterly earnings -3% on -13% sales revenues versus the year ago period, raising fundamental concerns. Its 50 DMA line ($454) defines near-term support above the prior low ($404 on 7/24/20) where violations may trigger technical sell signals.
9/1/2020 5:40:02 PM - G - Posted a gain with light volume today for its best ever close. Volume totals have been cooling in recent weeks while holding its ground perched near its all-time high. Recently reported Jun '20 quarterly earnings -3% on -13% sales revenues versus the year ago period, raising fundamental concerns. It is extended from any sound base of sufficient length. Its 50 DMA line ($451) defines near-term support above the prior low ($404 on 7/24/20) where violations may trigger technical sell signals.
8/27/2020 5:38:20 PM - G - Volume totals have been cooling in recent weeks while holding its ground perched near its all-time high. Recently reported Jun '20 quarterly earnings -3% on -13% sales revenues versus the year ago period, raising fundamental concerns. It is extended from any sound base of sufficient length. Its 50 DMA line ($445.39) defines near-term support above the prior low ($404 on 7/24/20) where violations may trigger technical sell signals. See the latest FSU analysis for more details and a new annotated graph.
8/26/2020 7:08:41 PM - G - Volume totals have been cooling in recent weeks while holding its ground perched near its all-time high. Recently reported Jun '20 quarterly earnings -3% on -13% sales revenues versus the year ago period, raising fundamental concerns. It is extended from any sound base of sufficient length. Its 50 DMA line ($443) defines near-term support above the prior low ($404 on 7/24/20) where violations may trigger technical sell signals.
8/21/2020 5:38:43 PM - G - Volume totals have been very quiet while still holding its ground perched near its all-time high. Recently reported Jun '20 quarterly earnings -3% on -13% sales revenues versus the year ago period, raising fundamental concerns. It is extended from any sound base of sufficient length. Its 50 DMA line ($437) defines near-term support above the prior low ($404 on 7/24/20) where violations may trigger technical sell signals.
8/17/2020 6:14:53 PM - G - Quietly holding its ground still perched near its all-time high. Recently reported Jun '20 quarterly earnings -3% on -13% sales revenues versus the year ago period, raising fundamental concerns. It is extended from any sound base of sufficient length. Its 50 DMA line ($428.60) defines near-term support above the prior low ($404 on 7/24/20) where violations may trigger technical sell signals.
8/12/2020 6:16:30 PM - G - Hovering near its all-time high. Recently reported Jun '20 quarterly earnings -3% on -13% sales revenues versus the year ago period, raising fundamental concerns. It is extended from any sound base of sufficient length. Its 50 DMA line ($421.28) and prior low ($404 on 7/24/20) define near-term support to watch where violations may trigger technical sell signals. See the latest FSU analysis for more details and a new annotated graph.
8/11/2020 6:06:11 PM - G - Retreating from its all-time high, it suffered a 3rd loss in the span of 4 sessions. Weak action came after it reported Jun '20 quarterly earnings -3% on -13% sales revenues versus the year ago period. It is extended from any sound base of sufficient length. Its 50 DMA line ($418.45) and prior low ($404 on 7/24/20) define near-term support to watch where violations may trigger technical sell signals.
8/10/2020 6:04:25 PM - G - Suffered a 2nd big volume-driven loss in the span of 3 sessions. Weak action came after it reported Jun '20 quarterly earnings -3% on -13% sales revenues versus the year ago period. It is extended from any sound base of sufficient length. Its 50 DMA line ($415.74) and prior low ($404 on 7/24/20) define near-term support to watch where violations may trigger technical sell signals.
8/7/2020 1:18:20 PM - G - Reported Jun '20 quarterly earnings -3% on -13% sales revenues versus the year ago period. Perched at its all-time high, very extended from any sound base of sufficient length. Its 50 DMA line ($412.80) and prior low ($404 on 7/24/20) define near-term support to watch on pullbacks.
8/3/2020 5:35:05 PM - G - Due to report earnings news after the close on Thursday, 8/06/20. Posted a big gain today backed by below average volume and hit a new all-time high, getting very extended from any sound base. Its 50 DMA line ($397.62) defines near-term support to watch.
7/31/2020 6:01:06 PM - G - Due to report earnings news on 8/06/20. Posted a big gain today backed by average volume. Volume totals had been cooling while consolidating near its all-time high, very extended from any sound base. Its 50 DMA line ($394) defines near-term support to watch.
7/28/2020 6:39:16 PM - G - Volume totals have been cooling while consolidating near its all-time high. Very extended from any sound base, and its 50 DMA line ($385) defines near-term support to watch.
7/23/2020 5:39:38 PM - G - Retreated from near its all-time high with today's loss on higher (but below average) volume. Very extended from any sound base, and its 50 DMA line ($378) defines near-term support to watch.
7/21/2020 5:44:06 PM - G - Hovering near its all-time high with volume totals cooling. Very extended from any sound base, and its 50 DMA line ($373) defines near-term support to watch. See the latest FSU analysis for more details and an annotated graph.
7/20/2020 5:26:33 PM - G - Rebounded toward its all-time high with today's big gain on light volume. It is very extended from any sound base. Its 50 DMA line ($370.41) defines near-term support to watch. See the latest FSU analysis for more details and a new annotated graph.
7/20/2020 2:06:23 PM - G - Rebounding toward its all-time high, very extended from any sound base. Its 50 DMA line ($370) defines near-term support to watch.
7/13/2020 6:49:47 PM - G - Suffered a "negative reversal today after hitting a new all-time high. Very extended from any sound base. Its 50 DMA line ($356.80) defines near-term support to watch.
7/8/2020 6:08:29 PM - G - Hit yet another new 52-week high with today's 6th consecutive gain, getting very extended from any sound base. Its 50 DMA line ($346.58) defines near-term support above prior highs in the $327 area.
7/2/2020 1:05:24 PM - G - Hitting yet another new 52-week high today, getting very extended from any sound base. Its 50 DMA line ($335) defines near-term support above prior highs in the $327 area.
7/1/2020 1:39:49 PM - G - Hitting another new 52-week high today, getting very extended from any sound base. Its 50 DMA line ($330) and prior highs in the $327 area define important near-term support to watch on pullbacks.
6/30/2020 5:56:18 PM - G - Stubbornly holding its ground perched near its 52-week high, very extended from any sound base. Prior highs in the $327 area define important near-term support coinciding with its 50 DMA line ($326.62).
6/25/2020 6:31:35 PM - G - Perched near its 52-week high, very extended from any sound base. Prior highs in the $327 area define important near-term support above its 50 DMA line ($316). See the latest FSU analysis for more details and an annotated graph.
6/24/2020 6:25:26 PM - G - Pulled back from its 52-week high with below average volume behind a loss today, breaking a streak of 8 consecutive gains. Very extended from any sound base. Prior highs in the $327 area define important near-term support. See the latest FSU analysis for more details and a new annotated graph.
6/22/2020 5:17:37 PM - G - Hit another new high today with below average volume behind its 7th consecutive gain, getting very extended from any sound base. Prior highs in the $327 area define important near-term support.
6/18/2020 5:13:00 PM - G - Hit another new high today with below average volume behind its 5th consecutive gain. Prior highs in the $327 area define important near-term support.
6/15/2020 5:50:14 PM - G - Hit a new high and managed its best-ever close today with average volume behind its big gain. Prior highs in the $327 area define important near-term support.
6/11/2020 5:13:33 PM - G - Pulled back today with below average volume as it slumped toward its "max buy" level. Prior highs in the $327 area define important near-term support.
6/5/2020 2:41:24 PM - G - Color code is changed to green after powering above its "max buy" level and hitting a new all-time high with today's big gain. Highlighted in yellow with new pivot point cited based on its 5/07/20 high in the 6/03/20 mid-day report. See the latest FSU analysis for more details and an annotated graph.
6/4/2020 5:57:50 PM - Y - Pulled back from its all-time high hit on the prior session with a big volume driven gain. Finished strong after highlighted in yellow with new pivot point cited based on its 5/07/20 high in the prior mid-day report. Hit a new all-time high with a big gain backed by +73% above average volume, clearing the pivot point and triggering a convincing technical buy signal. Fundamentals remain strong after it reported Mar '20 quarterly earnings +84% on +33% sales revenues, and 6 of the past 7 quarterly comparisons were above the +25% minimum earnings guideline (C criteria). See the latest FSU analysis for more details and a new annotated graph.
6/3/2020 6:16:45 PM - Y - Finished strong after highlighted in yellow with new pivot point cited based on its 5/07/20 high in the earlier mid-day report. Hit a new all-time high with today's big gain backed by +73% above average volume, clearing the pivot point and triggering a convincing technical buy signal. Fundamentals remain strong after it reported Mar '20 quarterly earnings +84% on +33% sales revenues, and 6 of the past 7 quarterly comparisons were above the +25% minimum earnings guideline (C criteria). See the latest FSU analysis for more details and a new annotated graph.
6/3/2020 - Y - Color code is changed to yellow with new pivot point cited based on its 5/07/20 high. Hitting a new all-time high with today's big gain following a deep pullback and a 3-week handle-like consolidation. A gain and strong close above the pivot point backed by at least +40% above average volume may trigger a convincing technical buy signal. Fundamentals remain strong after it reported Mar '20 quarterly earnings +84% on +33% sales revenues, and 3 of the past 4 quarterly comparisons were above the +25% minimum earnings guideline (C criteria). It was dropped from the Featured Stocks list on 9/09/19.
5/27/2020 2:45:44 PM - Consolidating near its all-time high following a deep "V" shaped pullback. It has not formed a sound base of sufficient length. Fundamentals remain strong after it reported Mar '20 quarterly earnings +84% on +33% sales revenues, and 3 of the past 4 quarterly comparisons were above the +25% minimum earnings guideline (C criteria). It was dropped from the Featured Stocks list on 9/09/19.
5/11/2020 1:02:18 PM - Consolidating after it impressively rebounded to hit a new all-time high last week following a deep "V" shaped pullback, not a sound base pattern. Fundamentals remain strong after it reported Mar '20 quarterly earnings +84% on +33% sales revenues, and 3 of the past 4 quarterly comparisons were above the +25% minimum earnings guideline (C criteria). It was dropped from the Featured Stocks list on 9/09/19.
5/8/2020 1:18:42 PM - Impressively rebounded to hit a new all-time high following a deep "V" shaped pullback, not a sound base pattern. Fundamentals remain strong after it reported Mar '20 quarterly earnings +84% on +33% sales revenues, and 3 of the past 4 quarterly comparisons were above the +25% minimum earnings guideline (C criteria). It was dropped from the Featured Stocks list on 9/09/19.
5/5/2020 12:47:30 PM - Impressively rebounding near its all-time high following a deep pullback. Due to report earnings news on 5/09/20. Reported Dec '19 quarterly earnings +37% on +35% sales revenues, and 3 of the past 4 quarterly comparisons were below the +25% minimum earnings guideline (C criteria). It was dropped from the Featured Stocks list on 9/09/19.
5/1/2020 12:49:16 PM - Pulling back today after impressively rebounding near its all-time high following a deep pullback. Due to report earnings news on 5/09/20. Reported Dec '19 quarterly earnings +37% on +35% sales revenues, and 3 of the past 4 quarterly comparisons were below the +25% minimum earnings guideline (C criteria). It was dropped from the Featured Stocks list on 9/09/19.
4/30/2020 1:19:12 PM - Impressively rebounding toward its all-time high following a deep pullback since noted with caution in the 2/19/20 mid-day report. Due to report earnings news on 5/09/20. Reported Dec '19 quarterly earnings +37% on +35% sales revenues, and 3 of the past 4 quarterly comparisons were below the +25% minimum earnings guideline (C criteria). It was dropped from the Featured Stocks list on 9/09/19.
4/29/2020 1:00:40 PM - Impressively rebounding toward its all-time high following a deep pullback since last noted with caution in the 2/19/20 mid-day report. Due to report earnings news on 5/09/20. Reported Dec '19 quarterly earnings +37% on +35% sales revenues, and 3 of the past 4 quarterly comparisons were below the +25% minimum earnings guideline (C criteria). It was dropped from the Featured Stocks list on 9/09/19.
2/19/2020 12:27:59 PM - Wedging into new all-time high territory with recent gains lacking great volume following its 2/04/20 technical breakout. Due to report earnings news on 2/27/20. Prior mid-day reports noted - "Reported Sep '19 quarterly earnings +15% on +38% sales revenues, below the +25% minimum earnings guideline (C criteria), raising fundamental concerns. Slumped below the 200 DMA line and then rebounded impressively since dropped from the Featured Stocks list on 9/09/19."
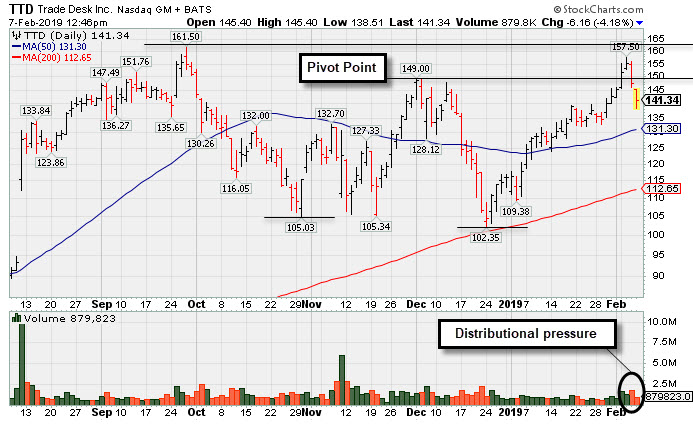
2/11/2020 1:21:46 PM - Endured distributional pressure as there was a "negative reversal" after hitting a new all-time high last week. Prior mid-day reports noted - "Reported Sep '19 quarterly earnings +15% on +38% sales revenues, below the +25% minimum earnings guideline (C criteria), raising fundamental concerns. Slumped below the 200 DMA line and then rebounded impressively since dropped from the Featured Stocks list on 9/09/19."
2/5/2020 12:42:54 PM - Enduring distributional pressure with a "negative reversal" today after hitting a new all-time high with a volume-driven gain on the prior session. Prior mid-day reports noted - "Reported Sep '19 quarterly earnings +15% on +38% sales revenues, below the +25% minimum earnings guideline (C criteria), raising fundamental concerns. Slumped below the 200 DMA line and then rebounded impressively since dropped from the Featured Stocks list on 9/09/19."
1/27/2020 12:40:57 PM - Enduring distributional pressure while perched near its all-time high. Prior mid-day reports noted - "Reported Sep '19 quarterly earnings +15% on +38% sales revenues, below the +25% minimum earnings guideline (C criteria), raising fundamental concerns. Slumped below the 200 DMA line and then rebounded impressively since dropped from the Featured Stocks list on 9/09/19."
1/14/2020 12:35:10 PM - Powered to a new all-time high on the prior session while adding to an impressive spurt of volume-driven gains. Prior mid-day reports noted - "Reported Sep '19 quarterly earnings +15% on +38% sales revenues, below the +25% minimum earnings guideline (C criteria), raising fundamental concerns. Slumped below the 200 DMA line and then rebounded impressively since dropped from the Featured Stocks list on 9/09/19."
1/13/2020 1:13:29 PM - Powering to a new all-time high today while adding to an impressive spurt of volume-driven gains. Prior mid-day reports noted - "Reported Sep '19 quarterly earnings +15% on +38% sales revenues, below the +25% minimum earnings guideline (C criteria), raising fundamental concerns. Slumped below the 200 DMA line and then rebounded impressively since dropped from the Featured Stocks list on 9/09/19."
1/10/2020 1:20:30 PM - Pulling back today after 7 consecutive gains just reaching new all-time high territory. Prior mid-day reports noted - "Reported Sep '19 quarterly earnings +15% on +38% sales revenues, below the +25% minimum earnings guideline (C criteria), raising fundamental concerns. Slumped below the 200 DMA line and then rebounded impressively since dropped from the Featured Stocks list on 9/09/19."
1/9/2020 12:28:04 PM - Pulling back today after 6 consecutive gains reaching new all-time high territory. Prior mid-day reports noted - "Reported Sep '19 quarterly earnings +15% on +38% sales revenues, below the +25% minimum earnings guideline (C criteria), raising fundamental concerns. Slumped below the 200 DMA line and then rebounded impressively since dropped from the Featured Stocks list on 9/09/19."
1/8/2020 12:29:15 PM - On track today for a 6th consecutive gain, approaching its all-time high. Prior mid-day reports noted - "Reported Sep '19 quarterly earnings +15% on +38% sales revenues, below the +25% minimum earnings guideline (C criteria), raising fundamental concerns. Slumped below the 200 DMA line and then rebounded impressively since dropped from the Featured Stocks list on 9/09/19."
1/7/2020 12:36:47 PM - On track today for a 5th consecutive gain, perched within close striking distance of its all-time high. Prior mid-day reports noted - "Reported Sep '19 quarterly earnings +15% on +38% sales revenues, below the +25% minimum earnings guideline (C criteria), raising fundamental concerns. Slumped below the 200 DMA line and then rebounded impressively since dropped from the Featured Stocks list on 9/09/19."
1/2/2020 12:38:57 PM - It remains perched within close striking distance of its all-time high. Prior mid-day reports noted - "Reported Sep '19 quarterly earnings +15% on +38% sales revenues, below the +25% minimum earnings guideline (C criteria), raising fundamental concerns. Slumped below the 200 DMA line and then rebounded impressively since dropped from the Featured Stocks list on 9/09/19."
12/31/2019 12:45:15 PM - Pulled back with heavier volume on the prior session when it was perched within close striking distance of its all-time high. Prior mid-day reports noted - "Reported Sep '19 quarterly earnings +15% on +38% sales revenues, below the +25% minimum earnings guideline (C criteria), raising fundamental concerns. Slumped below the 200 DMA line and then rebounded impressively since dropped from the Featured Stocks list on 9/09/19."
12/30/2019 12:24:50 PM - Pulling back today after it was perched within close striking distance of its all-time high. The 12/26/19 mid-day report noted - "Reported Sep '19 quarterly earnings +15% on +38% sales revenues, below the +25% minimum earnings guideline (C criteria), raising fundamental concerns. Slumped below the 200 DMA line and then rebounded impressively since dropped from the Featured Stocks list on 9/09/19."
12/26/2019 12:08:10 PM - Perched within close striking distance of its all-time high. Reported Sep '19 quarterly earnings +15% on +38% sales revenues, below the +25% minimum earnings guideline (C criteria), raising fundamental concerns. Slumped below the 200 DMA line and then rebounded impressively since dropped from the Featured Stocks list on 9/09/19.
12/23/2019 12:35:43 PM - Perched within close striking distance of its all-time high. Reported Sep '19 quarterly earnings +15% on +38% sales revenues, below the +25% minimum earnings guideline (C criteria), raising fundamental concerns. Slumped below the 200 DMA line and then rebounded impressively since dropped from the Featured Stocks list on 9/09/19.
12/6/2019 12:28:08 PM - Reported Sep '19 quarterly earnings +15% on +38% sales revenues, below the +25% minimum earnings guideline (C criteria), raising fundamental concerns. Slumped below the 200 DMA line and then rebounded impressively since dropped from the Featured Stocks list on 9/09/19.
9/9/2019 3:34:12 PM - Slumping further below its 50 DMA line ($248) and below the recent low ($239.01 on 8/21/19) with today's volume-driven loss after damaging losses last week triggered technical sell signals. A rebound above the 50 DMA line is needed to help its outlook improve. Reported Jun '19 quarterly earnings +58% on +42% sales revenues. It will be dropped from the Featured Stocks list tonight.
9/6/2019 5:12:18 PM - G - Slumped further below its 50 DMA line ($248) and below the recent low ($239.01 on 8/21/19) with losses this week raising concerns and triggering technical sell signals. Only a prompt rebound above the 50 DMA line would help its outlook improve. Reported Jun '19 quarterly earnings +58% on +42% sales revenues. See the latest FSU analysis for more details and a new annotated graph.
9/3/2019 5:46:35 PM - G - Slumped below its 50 DMA line ($248) and below the recent low ($239.01 on 8/21/19) raising concerns and triggering technical sell signals. Only a prompt rebound above the 50 DMA line would help its outlook improve. Reported Jun '19 quarterly earnings +58% on +42% sales revenues.
8/29/2019 6:00:03 PM - G - Quietly consolidating near its 50 DMA line ($248). The recent low ($239.01 on 8/21/19) defines important near-term support to watch. Violations would raise concerns and trigger technical sell signals. Reported Jun '19 quarterly earnings +58% on +42% sales revenues.
8/23/2019 6:34:19 PM - G - Undercut its 50 DMA line ($248) with a loss raising concerns and its color code is changed to green. The recent low ($239.01 on 8/21/19) defines important near-term support to watch. Violations would raise concerns and trigger technical sell signals. Reported Jun '19 quarterly earnings +58% on +42% sales revenues.
8/22/2019 1:36:24 PM - Y - Consolidating above its 50 DMA line ($248) and recent low ($239.01 on 8/21/19) which define important near-term support to watch. Violations would raise concerns and trigger technical sell signals. Reported Jun '19 quarterly earnings +58% on +42% sales revenues.
8/21/2019 6:23:16 PM - Y - Posted a gain today with higher volume. Its 50 DMA line ($247) and recent low ($239.01 on 8/21/19) define important near-term support to watch. Reported Jun '19 quarterly earnings +58% on +42% sales revenues.
8/20/2019 5:37:43 PM - Y - Color code is changed to yellow after rebounding above its 50 DMA line ($247.50) helping its technical stance improve. Reported Jun '19 quarterly earnings +58% on +42% sales revenues.
8/19/2019 12:38:08 PM - G - Color code is changed to green while sputtering below its 50 DMA line ($247.56) which defines important support. On Friday it was noted - "More damaging losses would raise concerns and trigger a technical sell signal. Reported Jun '19 quarterly earnings +58% on +42% sales revenues. See the latest FSU analysis for more details and a new annotated graph."
8/16/2019 4:48:11 PM - Y - Consolidating near its 50 DMA line ($247.54) which defines important support. More damaging losses would raise concerns and trigger a technical sell signal. Reported Jun '19 quarterly earnings +58% on +42% sales revenues. See the latest FSU analysis for more details and a new annotated graph.
8/14/2019 6:01:03 PM - Y - Testing its 50 DMA line ($247) which defines important support. Reported Jun '19 quarterly earnings +58% on +42% sales revenues.
8/12/2019 1:18:08 PM - Y - Color code is changed to yellow while consolidating below its "max buy" level. Its 50 DMA line ($245) defines support. Reported Jun '19 quarterly earnings +58% on +42% sales revenues.
8/9/2019 1:46:43 PM - G - Reported Jun '19 quarterly earnings +58% on +42% sales revenues. Color code is changed to green while hitting a new all-time high, rising above its "max buy" level with today's 4th consecutive volume-driven gain. Its 50 DMA line ($244) defines support.
8/8/2019 12:49:23 PM - Y - Showing resilience and rising back above its pivot point after undercutting the prior high ($258). The next important support to watch is its 50 DMA line ($242.60). Due to report Jun '19 quarterly results. Volume and volatility often increase near earnings news.
8/5/2019 1:02:06 PM - Y - Amid widespread weakness today it is undercutting the prior high ($258) and negating the recent breakout. The next important support to watch is its 50 DMA line ($238.94). Due to report earnings news on 8/08/19.
8/2/2019 1:30:33 PM - Y - Consolidating above the prior high ($258) which defines initial support to watch above its 50 DMA line ($232.85). Due to report earnings news on 8/08/19.
7/29/2019 12:57:34 PM - Y - Encountering distributional pressure and abruptly retreating from its all-time high with today's volume-driven loss after 3 consecutive gains. The prior gain above the pivot point was backed by +80% above average volume and triggered a technical buy signal. Prior high ($258) defines initial support to watch above its 50 DMA line ($232.77). Reported earnings +44% on +41% sales revenues for the Mar '19 quarter, continuing its strong earnings track record.
7/26/2019 11:51:54 AM - Y - Hitting a new all-time high with today's 3rd consecutive gain. Gains above the pivot point need at least +40% above average volume to trigger a proper technical buy signal. Its 50 DMA line ($231) and prior low ($223.77 on 6/26/19) define near-term support to watch. Reported earnings +44% on +41% sales revenues for the Mar '19 quarter, continuing its strong earnings track record.
7/25/2019 6:29:12 PM - Y - Posted a gain with lighter than average volume for a best ever close. Subsequent gains above the pivot point with at least +40% above average volume may trigger a technical buy signal. Its 50 DMA line ($230) and prior low ($223.77 on 6/26/19) define near-term support to watch. Reported earnings +44% on +41% sales revenues for the Mar '19 quarter, continuing its strong earnings track record.
7/22/2019 2:04:04 PM - Y - Challenging prior high closes with today's big gain lacking great volume conviction. Subsequent gains above the pivot point with at least +40% above average volume may trigger a technical buy signal. Its 50 DMA line ($225.88) and prior low ($223.77 on 6/26/19) define near-term support to watch. Reported earnings +44% on +41% sales revenues for the Mar '19 quarter, continuing its strong earnings track record.
7/18/2019 -
Y - Color code is changed to yellow with new pivot point cited based on its 6/20/19 high plus 10 cents. Subsequent volume-driven gains for new highs may trigger a technical buy signal. Encountering distributional pressure today with a loss on higher volume after wedging higher with gains lacking great volume conviction. Its prior low ($223.77 on 6/26/19) and 50 DMA line ($224) define near-term support to watch. Showed resilience since dropped from the Featured Stocks list on 5/13/19. Reported earnings +44% on +41% sales revenues for the Mar '19 quarter, continuing its strong earnings track record.
6/12/2019 12:26:13 PM - Encountering distributional pressure today after wedging into new high territory with a streak of 5 consecutive gains. It did not form a sound base. Its prior high ($232 on 5/03/19) defines initial support to watch above the 50 DMA line ($209). Showed resilience since dropped from the Featured Stocks list on 5/13/19 amid widespread market weakness. Reported earnings +44% on +41% sales revenues for the Mar '19 quarter, continuing its strong earnings track record. Patient investors may watch for a new base to be noted.
6/10/2019 12:28:27 PM - Hitting another new high with today's 5th consecutive volume-driven gain. It did not form a sound base yet rebounded above the 50 DMA line ($207.44) with big volume-driven gains last week helping its outlook improve. Showed resilience since dropped from the Featured Stocks list on 5/13/19 amid widespread market weakness. Reported earnings +44% on +41% sales revenues for the Mar '19 quarter, continuing its strong earnings track record. Patient investors may watch for a new base to be noted.
6/7/2019 12:43:16 PM - Hitting a new high with today's 4th consecutive volume-driven gain. It did not form a sound base yet rebounded above the 50 DMA line ($206) with big volume-driven gains this week helping its outlook improve. Showed resilience since dropped from the Featured Stocks list on 5/13/19 amid widespread market weakness. Reported earnings +44% on +41% sales revenues for the Mar '19 quarter, continuing its strong earnings track record. Patient investors may watch for a new base to be noted. Early action today has the look of a follow-through day from the broader market (M criteria) confirming a new uptrend.
6/6/2019 12:50:49 PM - Hitting a new high with today's 3rd consecutive volume-driven gain. It did not form a sound base yet rebounded above the 50 DMA line ($204) with big volume-driven gains this week helping its outlook improve. Showed resilience since dropped from the Featured Stocks list on 5/13/19 amid widespread market weakness. Reported earnings +44% on +41% sales revenues for the Mar '19 quarter, continuing its strong earnings track record. Patient investors may watch for a new base to be noted and for a follow-through day from the broader market (M criteria).
6/5/2019 12:34:50 PM - Hitting a new high with today's 2nd consecutive volume-driven gain. It did not form a sound base yet rebounded above the 50 DMA line ($203) with a big volume-driven gain on the prior session helping its outlook improve. Showed resilience since dropped from the Featured Stocks list on 5/13/19 amid widespread market weakness. Reported earnings +44% on +41% sales revenues for the Mar '19 quarter, continuing its strong earnings track record. Patient investors may watch for a new base to be noted and for a follow-through day from the broader market (M criteria).
6/4/2019 12:37:19 PM - Rebounding above the 50 DMA line ($203) with today's big volume-driven gain helping its outlook improve. Patient investors may watch for a new base to be noted and for a follow-through day from the broader market (M criteria). Showed resilience since dropped from the Featured Stocks list on 5/13/19 amid widespread market weakness. Reported earnings +44% on +41% sales revenues for the Mar '19 quarter, continuing its strong earnings track record.
5/21/2019 12:44:23 PM - Patient investors may watch for a new base to be noted and for a follow-through day from the broader market (M criteria). Meeting resistance at its 50 DMA line ($204) after damaging losses. A rebound above the 50 DMA line is needed to help its outlook improve. Showed resilience since dropped from the Featured Stocks list on 5/13/19 amid widespread market weakness (M criteria). Reported earnings +44% on +41% sales revenues for the Mar '19 quarter, continuing its strong earnings track record.
5/16/2019 12:20:54 PM - Patient investors may watch for a new base to be noted and for a follow-through day from the broader market (M criteria). Rebound above the 50 DMA line ($204) is helping its outlook improve with today's 3rd consecutive gain. Showing resilience aince dropped from the Featured Stocks list on 5/13/19 amid widespread market weakness (M criteria). Reported earnings +44% on +41% sales revenues for the Mar '19 quarter, continuing its strong earnings track record.
5/13/2019 5:19:19 PM - Suffered another loss today, failing to rebound after triggering a technical sell signal with damaging volume-driven losses last week. It will be dropped from the Featured Stocks list tonight. A rebound above the 50 DMA line ($203.50) is needed for its outlook to improve. Reported earnings +44% on +41% sales revenues for the Mar '19 quarter, continuing its strong earnings track record.
5/9/2019 3:35:13 PM - G - Color code is changed to green after violating its 50 DMA line with a big volume-driven loss today triggering a technical sell signal. Reported earnings +44% on +41% sales revenues for the Mar '19 quarter, continuing its strong earnings track record. Disciplined investors will note that gains above the pivot point did not have the volume necessary to trigger a proper new (or add-on) technical buy signal. The next important support to watch is the prior low ($178.30 on 3/27/19).
5/7/2019 6:19:45 PM - Y - Color code is changed to yellow after pulling back below its "max buy" level with losses on higher volume. Disciplined investors will note that gains above the pivot point did not have the volume necessary to trigger a proper new (or add-on) technical buy signal. Its 50 DMA line ($203.72) defines initial support to watch above the prior low ($178.30 on 3/27/19). Due to report earnings news before the open on 5/09/19.
5/3/2019 8:08:34 PM - G - Color code is changed to green after rallying above its "max buy" level. Disciplined investors will note that gains above the pivot point did not have the volume necessary to trigger a proper new (or add-on) technical buy signal. Its 50 DMA line ($202.76) defines initial support to watch above the prior low ($178.30 on 3/27/19). Due to report earnings news before the open on 5/09/19.
4/30/2019 6:00:02 PM - Y - Color code is changed to yellow after pulling back below its "max buy" level. Disciplined investors will note that gains above the pivot point did not have the volume necessary to trigger a proper new (or add-on) technical buy signal. Its 50 DMA line ($198.44) defines initial support to watch above the prior low ($178.30 on 3/27/19). Due to report earnings news before the open on 5/09/19. See the latest FSU analysis for more details and a new annotated graph.
4/29/2019 5:50:15 PM - G - Color code is changed to green after it hit a new high and rose above its "max buy" level with a big gain today on average volume. Disciplined investors will note that gains above the pivot point did not have the volume necessary to trigger a proper new (or add-on) technical buy signal. Its 50 DMA line ($197) defines initial support to watch above the prior low ($178.30 on 3/27/19). Due to report earnings news before the open on 5/09/19.
4/25/2019 1:37:01 PM - Y - Quietly touched a new all-time high today. A gain and close above the pivot point backed by at least +40% above average volume may trigger a new (or add-on) technical buy signal. Consolidated in an orderly fashion above its 50 DMA line ($194) which defines initial support to watch above the prior low ($178.30 on 3/27/19). Due to report earnings news before the open on 5/09/19.
4/22/2019 5:48:08 PM - Y - Posted a big gain today with near average volume for its second-best close ever. Color code is changed to yellow with new pivot point cited based on its 3/22/19 high plus 10 cents. Subsequent gains above the pivot point backed by at least +40% above average volume may trigger a new (or add-on) technical buy signal. Consolidated in an orderly fashion above its 50 DMA line ($190) which defines initial support to watch above the prior low ($178.30 on 3/27/19).
4/16/2019 1:43:26 PM - G - Volume totals have been cooling while consolidating in an orderly fashion above its 50 DMA line ($187.53) which defines initial support to watch above the prior low ($178.30 on 3/27/19).
4/11/2019 1:42:11 PM - G - Consolidating above its 50 DMA line ($184) which defines initial support to watch above the prior low ($178.30 on 3/27/19).
4/4/2019 3:56:03 PM - G - Enduring more distributional pressure today. Its 50 DMA line ($178) defines initial support to watch above the prior high ($161).
4/1/2019 1:36:45 PM - G - Very extended from the prior base, recently enduring distributional pressure. Its 50 DMA line ($173.88) defines initial support to watch above the prior high ($161).
3/29/2019 1:16:16 PM - G - Very extended from the prior base, recently enduring distributional pressure. Its 50 DMA line ($172) defines initial support to watch above the prior high ($161).
3/28/2019 1:15:17 PM - G - Endured distributional pressure with a streak of volume-driven losses after getting very extended from the prior base. Its 50 DMA line ($171) and prior high ($161) define near-term support to watch.
3/26/2019 12:54:12 PM - G - Pulling back today for a 3rd consecutive loss with ever-increasing volume after getting very extended from the prior base with recent gains lacking great volume conviction. Its 50 DMA line ($169) and prior high ($161) define near-term support to watch.
3/25/2019 12:50:08 PM - G - Pulling back for a 2nd consecutive loss with higher volume after getting very extended from the prior base with recent gains lacking great volume conviction. Its 50 DMA line ($167.79) and prior high ($161) define near-term support to watch.
3/22/2019 1:08:46 PM - G - Perched at its all-time high, very extended from the prior base. Its 50 DMA line ($166) and prior high ($161) define near-term support to watch. Fundamentals are strong. See the latest FSU analysis for more details and an annotated graph.
3/21/2019 6:09:22 PM - G - Posted a 3rd consecutive gain with below average volume for another new all-time high, getting very extended from the prior base. Prior high ($161) defines initial support to watch. Fundamentals are strong. See the latest FSU analysis for more details and a new annotated graph.
3/21/2019 5:29:12 PM - G - Posted a 3rd consecutive gain with below average volume for another new all-time high, getting very extended from the prior base. Prior high ($161) defines initial support to watch. Bullish action came after it recently reported earnings +102% on +56% sales revenues for the Dec '18 quarter.
3/18/2019 11:45:33 AM - G - Perched at its all-time high, very extended from the prior base. Prior high ($161) defines initial support to watch. Bullish action came after it recently reported earnings +102% on +56% sales revenues for the Dec '18 quarter.
3/11/2019 12:29:02 PM - G - Hitting a new all-time high today after a brief consolidation. Prior high ($161) defines initial support to watch. Bullish action came after it recently reported earnings +102% on +56% sales revenues for the Dec '18 quarter.
3/6/2019 3:54:49 PM - G - Consolidating near its all-time high, well above its "max buy" level. Prior high ($161) defines initial support to watch. Bullish action came after it recently reported earnings +102% on +56% sales revenues for the Dec '18 quarter.
3/1/2019 6:07:23 PM - G - Still stubbornly holding its ground near its all-time high, above its "max buy" level. Bullish action on the prior session came after it reported earnings +102% on +56% sales revenues for the Dec '18 quarter. Prior high ($161) defines initial support to watch on pullbacks.
2/26/2019 12:58:20 PM - G - Holding its ground near its all-time high. Color code was changed to green after a gap up and considerable gain above its "max buy" level backed by heavy volume. Bullish action on the prior session came after it reported earnings +102% on +56% sales revenues for the Dec '18 quarter.
2/25/2019 1:28:30 PM - G - Holding its ground today. Color code was changed to green after a gap up and considerable gain above its "max buy" level backed by heavy volume. Bullish action on the prior session came after it reported earnings +102% on +56% sales revenues for the Dec '18 quarter.
2/22/2019 12:55:15 PM - G - Color code is changed to green after a gap up and considerable gain above its "max buy" level backed by heavy volume. Bullish action today came after it reported earnings +102% on +56% sales revenues for the Dec '18 quarter. Volume and volatility often increase near earnings news.
2/20/2019 12:51:07 PM - Y - Color code is changed to yellow while pulling back today with heavier volume, undercutting the previously cited pivot point after rallying from a "double bottom" base. Due to release financial results for the fourth quarter and fiscal year 2018 ended December 31, 2018 after market close on Thursday, February 21, 2019. Volume and volatility often increase near earnings news.
2/19/2019 12:39:41 PM - G - Posting a 3rd consecutive gain today with ever-increasing and above average volume, hitting a new all-time high. Color code is changed to green after rallying above its "max buy" level. Gain on 2/04/19 was backed by +48% above average volume while clearing a "double bottom" base. Reported earnings +86% on +50% sales revenues for the Sep '18 quarter. Three of the past 4 quarterly comparisons were well above the +25% minimum guideline (C criteria). See the latest FSU analysis for more details and an annotated graph.
2/12/2019 6:30:15 PM - Y - Posted a 3rd consecutive gain today with lighter than average volume. Faces little resistance due to overhead supply up to the $161 level. Gain on 2/04/19 was backed by +48% above average volume while clearing a "double bottom" base. Reported earnings +86% on +50% sales revenues for the Sep '18 quarter. Three of the past 4 quarterly comparisons were well above the +25% minimum guideline (C criteria). See the latest FSU analysis for more details and a new annotated graph.
2/8/2019 4:37:54 PM - Y - Posted a small gain today with lighter volume after 2 losses with higher volume, action indicative of distributional pressure. Color code was changed to yellow with pivot point cited based on its 12/03/18 high. Faces resistance due to overhead supply up to the $161 level. Gain on 2/04/19 was backed by +48% above average volume while clearing a "double bottom" base. Reported earnings +86% on +50% sales revenues for the Sep '18 quarter. Three of the past 4 quarterly comparisons were well above the +25% minimum guideline (C criteria).
2/7/2019 12:50:58 PM - Y - Pulling back for a 2nd consecutive session with higher volume, action indicative of distributional pressure. Color code was changed to yellow with pivot point cited based on its 12/03/18 high. Faces resistance due to overhead supply up to the $161 level. Gain on 2/04/19 was backed by +48% above average volume while clearing a "double bottom" base. Reported earnings +86% on +50% sales revenues for the Sep '18 quarter. Three of the past 4 quarterly comparisons were well above the +25% minimum guideline (C criteria).
2/6/2019 1:12:12 PM - Y - Pulling back today with higher volume indicative of distributional pressure. Color code is changed to yellow with pivot point cited based on its 12/03/18 high. Gain on 2/04/19 was backed by +48% above average volume while clearing a "double bottom" base and approaching its 52-week high. Faces very little resistance due to overhead supply up to the $161 level. Reported earnings +86% on +50% sales revenues for the Sep '18 quarter. Three of the past 4 quarterly comparisons were well above the +25% minimum guideline (C criteria). Found support at its 200 DMA line during its choppy consolidation since noted with caution in the 10/03/18 mid-day report - " Limited history is a concern. Rallied considerably and completed Secondary Offerings on 2/28/17 and 5/24/17 since its Sep '16 IPO at $18."
2/4/2019 1:42:54 PM - Rebounding above a prior high with today's 4th consecutive gain clearing a "double bottom" base and approaching its 52-week high. Reported earnings +86% on +50% sales revenues for the Sep '18 quarter. The Jun '18 quarter was below the +25% minimum guideline (C criteria). Found support at its 200 DMA line during its choppy consolidation since last noted with caution in the 10/03/18 mid-day report - " Limited history is a concern. Rallied considerably and completed Secondary Offerings on 2/28/17 and 5/24/17 since its Sep '16 IPO at $18."
10/3/2018 12:57:18 PM - Endured distributional pressure while retreating from its 52-week high. Prior mid-day reports cautioned members - "Reported earnings +15% on +54% sales revenues for the Jun '18 quarter, below the +25% minimum guideline (C criteria). Prior quarterly earnings comparisons were much stronger. Limited history is a concern. Rallied considerably and completed Secondary Offerings on 2/28/17 and 5/24/17 since its Sep '16 IPO at $18."
10/1/2018 12:56:12 PM - Retreating from its 52-week high hit last week. Prior mid-day reports cautioned members - "Reported earnings +15% on +54% sales revenues for the Jun '18 quarter, below the +25% minimum guideline (C criteria). Prior quarterly earnings comparisons were much stronger. Limited history is a concern. Rallied considerably and completed Secondary Offerings on 2/28/17 and 5/24/17 since its Sep '16 IPO at $18."
9/27/2018 11:41:54 AM - Did not form a sound base, yet held its ground stubbornly and hit new 52-week highs with additional volume-driven gains. Prior mid-day reports cautioned members - "Reported earnings +15% on +54% sales revenues for the Jun '18 quarter, below the +25% minimum guideline (C criteria). Prior quarterly earnings comparisons were much stronger. Limited history is a concern. Rallied considerably and completed Secondary Offerings on 2/28/17 and 5/24/17 since its Sep '16 IPO at $18."
9/25/2018 1:18:23 PM - Did not form a sound base, yet held its ground stubbornly and hit a new 52-week high with today's big gain. Prior mid-day reports cautioned members - "Reported earnings +15% on +54% sales revenues for the Jun '18 quarter, below the +25% minimum guideline (C criteria). Prior quarterly earnings comparisons were much stronger. Limited history is a concern. Rallied considerably and completed Secondary Offerings on 2/28/17 and 5/24/17 since its Sep '16 IPO at $18."
9/5/2018 12:39:26 PM - It has been holding its ground stubbornly and hitting new 52-week highs with additional gains following a big "breakaway gap" on 8/10/18. Prior mid-day reports cautioned members - "Reported earnings +15% on +54% sales revenues for the Jun '18 quarter, below the +25% minimum guideline (C criteria). Prior quarterly earnings comparisons were much stronger. Limited history is a concern. Rallied considerably and completed Secondary Offerings on 2/28/17 and 5/24/17 since its Sep '16 IPO at $18."
8/15/2018 12:11:41 PM - Holding its ground stubbornly after hitting a new 52-week high with a big "breakaway gap" and impressive volume-driven gain. Prior mid-day reports cautioned members - "Reported earnings +15% on +54% sales revenues for the Jun '18 quarter, below the +25% minimum guideline (C criteria). Prior quarterly earnings comparisons were much stronger. Limited history is a concern. Rallied considerably and completed Secondary Offerings on 2/28/17 and 5/24/17 since its Sep '16 IPO at $18."
8/14/2018 2:20:30 PM - Holding its ground after hitting a new 52-week high with a big "breakaway gap" and impressive volume-driven gain as the 8/10/18 mid-day report noted - "Reported earnings +15% on +54% sales revenues for the Jun '18 quarter, below the +25% minimum guideline (C criteria). Prior quarterly earnings comparisons were much stronger. Limited history is a concern. Rallied considerably and completed Secondary Offerings on 2/28/17 and 5/24/17 since its Sep '16 IPO at $18."
8/13/2018 3:29:28 PM - Gapped up on the prior session hitting a new 52-week high with a big "breakaway gap" and impressive volume-driven gain as the mid-day report noted - "Reported earnings +15% on +54% sales revenues for the Jun '18 quarter, below the +25% minimum guideline (C criteria). Prior quarterly earnings comparisons were much stronger. Limited history is a concern. Rallied considerably and completed Secondary Offerings on 2/28/17 and 5/24/17 since its Sep '16 IPO at $18."
8/10/2018 1:26:41 PM - Gapped up today hitting a new 52-week high with a big "breakaway gap" and impressive volume-driven gain. Reported earnings +15% on +54% sales revenues for the Jun '18 quarter, below the +25% minimum guideline (C criteria). Prior quarterly earnings comparisons were much stronger. Limited history is a concern. Rallied considerably and completed Secondary Offerings on 2/28/17 and 5/24/17 since its Sep '16 IPO at $18.
6/4/2018 12:42:23 PM - Pulling back today, retreating from its 52-week high. There was a big "breakaway gap" on 5/11/18 followed by more impressive volume-driven gains. Quarterly earnings increases and sales revenues growth through the Mar '18 quarter has been strong versus year-ago periods. Went through a choppy consolidation above and below its 200 DMA line since noted in the 2/26/18 mid-day report - "Limited history is a concern. Rallied considerably and completed Secondary Offerings on 2/28/17 and 5/24/17 since its Sep '16 IPO at $18."
5/22/2018 1:08:05 PM - There was a big "breakaway gap" on 5/11/18 followed by more impressive volume-driven gains for new 52-week highs. Quarterly earnings increases and sales revenues growth through the Mar '18 quarter has been strong versus year-ago periods. Went through a choppy consolidation above and below its 200 DMA line since noted in the 2/26/18 mid-day report - "Limited history is a concern. Rallied considerably and completed Secondary Offerings on 2/28/17 and 5/24/17 since its Sep '16 IPO at $18."
5/21/2018 12:55:36 PM - There was a big "breakaway gap" on 5/11/18 followed by more volume-driven gains for new 52-week highs. Quarterly earnings increases and sales revenues growth through the Mar '18 quarter has been strong versus year-ago periods. Went through a choppy consolidation above and below its 200 DMA line since noted in the 2/26/18 mid-day report - "Limited history is a concern. Rallied considerably and completed Secondary Offerings on 2/28/17 and 5/24/17 since its Sep '16 IPO at $18."
5/18/2018 1:00:49 PM - There was a big "breakaway gap" on 5/11/18 followed by more volume-driven gains for new 52-week highs. Quarterly earnings increases and sales revenues growth through the Mar '18 quarter has been strong versus year-ago periods. Went through a choppy consolidation above and below its 200 DMA line since noted in the 2/26/18 mid-day report - "Limited history is a concern. Rallied considerably and completed Secondary Offerings on 2/28/17 and 5/24/17 since its Sep '16 IPO at $18."
5/17/2018 12:55:47 PM - There was a big "breakaway gap" on 5/11/18 followed by more volume-driven gains for new 52-week highs. Quarterly earnings increases and sales revenues growth through the Mar '18 quarter has been strong versus year-ago periods. Went through a choppy consolidation above and below its 200 DMA line since noted in the 2/26/18 mid-day report - "Limited history is a concern. Rallied considerably and completed Secondary Offerings on 2/28/17 and 5/24/17 since its Sep '16 IPO at $18."
5/16/2018 1:00:33 PM - There was a big "breakaway gap" on 5/11/18 followed by more volume-driven gains for new 52-week highs. Quarterly earnings increases and sales revenues growth through the Mar '18 quarter has been strong versus year-ago periods. Went through a choppy consolidation above and below its 200 DMA line since noted in the 2/26/18 mid-day report - "Limited history is a concern. Rallied considerably and completed Secondary Offerings on 2/28/17 and 5/24/17 since its Sep '16 IPO at $18."
5/15/2018 1:12:47 PM - There was a big "breakaway gap" on 5/11/18 and it is rallying today for another considerable volume-driven gain and new 52-week high. Quarterly earnings increases and sales revenues growth through the Mar '18 quarter has been strong versus year-ago periods. Went through a choppy consolidation above and below its 200 DMA line since noted in the 2/26/18 mid-day report - "Limited history is a concern. Rallied considerably and completed Secondary Offerings on 2/28/17 and 5/24/17 since its Sep '16 IPO at $18."
5/14/2018 2:09:02 PM - Gapped up on the prior session for a considerable volume-driven gain and new 52-week high. Quarterly earnings increases and sales revenues growth through the Mar '18 quarter has been strong versus year-ago periods. Went through a choppy consolidation above and below its 200 DMA line since last noted in the 2/26/18 mid-day report - "Limited history is a concern. Rallied considerably and completed Secondary Offerings on 2/28/17 and 5/24/17 since its Sep '16 IPO at $18."
2/26/2018 12:55:55 PM - Rebounded near its 52-week high with a big gap up and volume-driven gain on the prior session. Quarterly earnings increases and sales revenues growth through the Dec '17 quarter has been strong versus year-ago periods. Went through a choppy consolidation below its 200 DMA line since last noted in the 10/06/17 mid-day report - "Limited history is a concern. Rallied considerably and completed Secondary Offerings on 2/28/17 and 5/24/17 since its Sep '16 IPO at $18."
10/6/2017 12:02:26 PM - Hitting a new 52-week high today, getting extended from prior highs in the $57 area. Quarterly earnings and sales revenues growth through the Jun '17 quarter has been strong. Limited history is a concern. Rallied considerably and completed Secondary Offerings on 2/28/17 and 5/24/17 since its Sep '16 IPO at $18.