11/12/2024 2:01:39 PM - Hitting new 52-week and all-time highs with today's 4th volume-driven gain in the span of 5 sessions. Reported Sep '24 quarterly earnings +65% on -3% sales revenues. Quarterly earnings results have been well above the +25% minimum guideline (C criteria) versus the year-ago period but sales revenues growth showed worrisome deceleration in sequential quarters. Annual earnings growth has been strong since a downturn in FY '20.
8/1/2024 1:50:29 PM - Gapped up today hitting new 52-week and all-time highs with a considerable volume-driven gain, getting extended from any sound base. Patient investors may watch for a new base or secondary buy point to possibly develop and be noted in the weeks ahead. Reported string Dec '23, Mar and Jun '24 quarterly results well above the +25% minimum guideline (C criteria) versus the year-ago period. Annual earnings growth has been strong since a downturn in FY '20.
10/2/2014 1:10:16 PM - Traded below its prior low ($41.05 on 8/08/14) today while on track for a 6th consecutive loss. Damaging volume-driven losses triggered a technical sell signal. Due to technical deterioration it will be dropped from the Featured Stocks list tonight.
10/1/2014 11:59:29 AM - G - Violated prior highs in the $46-47 area and sank below its 50 DMA line with a damaging volume-driven loss today raising concerns and triggering a technical sell signal.
9/29/2014 6:13:39 PM - G - It has not formed a sound base. Endured distributional pressure while recently consolidating near prior highs in the $46-47 area and above its 50 DMA line. More damaging losses would raise greater concerns.
9/22/2014 5:44:01 PM - G - Pulled back today with above average volume following 4 consecutive volume-driven gains. It has not formed a sound base. Prior highs near $46-47 define near-term support above its 50 DMA line.
9/18/2014 1:04:38 PM - G - Poised for a best-ever close with today's 3rd consecutive gain. It has not formed a sound base. Prior highs near $46-47 define near-term support above its 50 DMA line.
9/12/2014 6:07:07 PM - G - Pulling back since a "negative reversal" at its 52-week high on 9/03/14. It has not formed a sound base. Prior highs near $46-47 define near-term support above its 50 DMA line. See the latest FSU analysis for more details and new annotated graphs.
9/9/2014 7:04:41 PM - G - Pulled back today with higher volume. There was a "negative reversal" at its 52-week high on 9/03/14. It has not formed a sound base. Prior highs near $46-47 define near-term support above its 50 DMA line.
9/2/2014 6:26:36 PM - G - Hit another new 52-week high with today's volume-driven gain. It has not formed a sound base. Prior highs near $46-47 define near-term support above its 50 DMA line.
8/25/2014 3:32:30 PM - G - Hitting another new 52-week high with today's 6th consecutive gain. It has not formed a sound base.
8/19/2014 12:48:08 PM - G - Poised for a best-ever close with today's small gap up gain but it has not formed a sound base and its color code is changed to green. Promptly rebounded above its 50 DMA line following a brief violation, a sign of encouraging support. Reported earnings +91% on +39% sales for the Jun '14 quarter.
8/18/2014 7:09:52 PM - Y - Rallied near its best-ever close with a gain today on higher (near average) volume. Promptly rebounded above its 50 DMA line following a brief violation, a sign of encouraging support. Reported earnings +91% on +39% sales for the Jun '14 quarter.
8/13/2014 6:15:36 PM - Y - Rebounded above its 50 DMA line helping its technical outlook improve and its color code is changed to yellow. Reported earnings +91% on +39% sales for the Jun '14 quarter.
8/6/2014 6:42:45 PM - G - Gapped down and violated its 50 DMA line ($43.26) raising concerns and triggering a technical sell signal. Only a prompt rebound above the 50 DMA line would help its outlook improve. Reported earnings +91% on +39% sales for the Jun '14 quarter.
7/31/2014 3:54:48 PM - G - Gapped down today for a volume-driven loss, retreating from its 52-week high and testing its 50 DMA line ($43.19) which defines important near-term support. A damaging violation would raise concerns and trigger a technical sell signal. Reported earnings +91% on +39% sales for the Jun '14 quarter.
7/30/2014 1:14:19 PM - G - Hit a new 52-week high today yet erased much of its early gain. Its 50 DMA line defines important near-term support to watch. Reported earnings +91% on +39% sales for the Jun '14 quarter. See the latest FSU analysis for more details and new annotated graphs.
7/28/2014 5:45:14 PM - G - Perched near its 52-week high and consolidating above its 50 DMA line defining important near-term support to watch. Due to report Jun '14 quarterly earnings after the close on Tuesday. See the latest FSU analysis for more details and new annotated graphs.
7/23/2014 4:31:08 PM - G - Touched a new 52-week high today then erased most of its gain to close near the session low. It is extended from its prior base. Its 50 DMA line defines important near-term support to watch.
7/22/2014 12:57:04 PM - G - Quietly perched within close striking distance of its 52-week high, extended from its prior base. Its 50 DMA line defines important near-term support to watch.
7/15/2014 4:21:17 PM - G - Volume totals have been cooling while holding its ground stubbornly and consolidating near its 52-week high, extended from its prior base. Its 50 DMA line defines important near-term support to watch.
7/8/2014 6:18:09 PM - G - Consolidating near its 52-week high, extended from its prior base. Its 50 DMA line defines important near-term support to watch. See the latest FSU analysis for more details and new annotated graphs.
7/2/2014 4:03:17 PM - G - Gapped up today and hit a new 52-week high with a gain on light volume, getting more extended from its prior base. Its 50 DMA line defines important near-term support to watch.
6/27/2014 5:14:24 PM - G - Hit a new 52-week high today but it erased most of its gain and ended near the session low while trading above average volume, a sign of distributional pressure termed "churning". Previously noted - "It is extended from its prior base. Recent lows in the $39-40 area and its 50 DMA line coincide defining important near-term support to watch. Do not be confused by the 2:1 share split effective 6/20/14 (Featured Price, Pivot Point, and Max Buy level have been adjusted accordingly)."
6/25/2014 3:59:12 PM - G - Gapped up today approaching its 52-week high. It is extended from its prior base. Recent lows in the $39-40 area and its 50 DMA line coincide defining important near-term support to watch. Do not be confused by the 2:1 share split effective 6/20/14 (Featured Price, Pivot Point, and Max Buy level have been adjusted accordingly).
6/25/2014 10:55:39 AM - G - Consolidating within close striking distance of its 52-week high, extended from its prior base. Recent lows in the $39-40 area and its 50 DMA line coincide defining important near-term support to watch. Do not be confused by the 2:1 share split effective 6/20/14 (Featured Price, Pivot Point, and Max Buy level have been adjusted accordingly).
6/19/2014 1:18:10 PM - G - Perched within close striking distance of its 52-week high, extended from its prior base. Recent lows in the $79 area and its 50 DMA line coincide defining important near-term support to watch.
6/16/2014 5:58:03 PM - G - Gapped up today for a solid gain and finished near the session high following 4 consecutive losses. Prior highs in the $76 area and its 50 DMA line ($77.79) define important support to watch.
6/13/2014 5:16:26 PM - G - Stubbornly holding its ground well above prior highs in the $76 area and above its 50 DMA line ($77.54) defining important support to watch.
6/6/2014 1:05:42 PM - G - Halted its slide after 5 consecutive losses and gapped up today. Prior highs in the $75-76 area coincide with its 50 DMA line ($76.48) defining important support to watch.
6/5/2014 12:58:47 PM - G - Trading near its "max buy" level with above average volume behind today's 5th consecutive loss. Traded up as much as +15.57% since first highlighted in yellow in the 4/30/14 mid-day report. Prior highs in the $75-76 area coincide with its 50 DMA line ($76.25) defining important support to watch.
6/4/2014 2:33:11 PM - G - Pulling back near its "max buy" level with above average volume behind today's 4th consecutive loss. Traded up as much as +15.57% since first highlighted in yellow in the 4/30/14 mid-day report. Prior highs in the $75-76 area coincide with its 50 DMA line ($76.12) defining important support to watch.
6/4/2014 12:42:38 PM - G - Pulling back for a 4th consecutive session after getting extended from its prior base. Traded up as much as +15.57% since first highlighted in yellow in the 4/30/14 mid-day report. Prior highs in the $75-76 area coincide with its 50 DMA line ($76.12) defining important support to watch.
6/3/2014 1:08:50 PM - G - Pulling back for a 3rd consecutive session after getting extended from its prior base. Traded up as much as +15.57% since first highlighted in yellow in the 4/30/14 mid-day report. Prior highs in the $75-76 area define near-term support to watch on pullbacks. See the latest FSU analysis for more details and annotated graphs.
6/2/2014 6:35:41 PM - G - Extended from its prior base, it traded up as much as +15.57% since first highlighted in yellow in the 4/30/14 mid-day report. Prior highs in the $75-76 area define near-term support to watch on pullbacks. See the latest FSU analysis for more details and new annotated graphs.
5/30/2014 6:05:55 PM - G - Pulled back today following a streak of 6 consecutive gains. Extended from its prior base, it traded up as much as +15.57% since first highlighted in yellow in the 4/30/14 mid-day report. Prior highs in the $75-76 area define near-term support to watch on pullbacks.
5/27/2014 5:59:00 PM - G - Posted a 4th consecutive gain today, getting more extended from its prior base. Traded up as much as +15.26% since first highlighted in yellow in the 4/30/14 mid-day report. Prior highs in the $75-76 area define near-term support to watch on pullbacks.
5/21/2014 12:27:50 PM - G - Holding its ground stubbornly, extended from any sound base. Prior highs in the $75-76 area define near-term support to watch on pullbacks.
5/20/2014 6:38:11 PM - G - Extended from any sound base. Prior highs in the $75-76 area define near-term support to watch on pullbacks.
5/13/2014 5:46:36 PM - G - Rallied further above its "max buy" level with today's 8th consecutive volume-driven gain. Prior highs in the $75-76 area define near-term support to watch on pullbacks.
5/12/2014 7:41:26 PM - G - Color code is changed to green after rallying above its "max buy" level with today's 7th consecutive volume-driven gain. Prior highs in the $75-76 area define near-term support to watch on pullbacks. See the latest FSU analysis for more details and new annotated graphs.
5/6/2014 6:25:19 PM - Y - Hit another new 52-week high with today's gain above its pivot point backed by +86% above average volume while approaching its "max buy" level. Prior highs in the $75-76 area define near-term support to watch on pullbacks.
5/2/2014 5:17:18 PM - Y - Hit a new 52-week high today and closed above its pivot point with a gain backed by +82% above average volume clinching a technical buy signal. Highlighted in yellow with pivot point cited based on its 3/21/14 high plus 10 cents in the 4/30/14 mid-day report (read here). See the latest FSU analysis for more details and annotated graphs.
5/2/2014 12:38:46 PM - Y - Hitting a new 52-week high and trading above its pivot point with today's volume-driven gain. A strong finish may help clinch a convincing technical buy signal. Highlighted in yellow with pivot point cited based on its 3/21/14 high plus 10 cents in the 4/30/14 mid-day report (read here). See the latest FSU analysis for more details and annotated graphs.
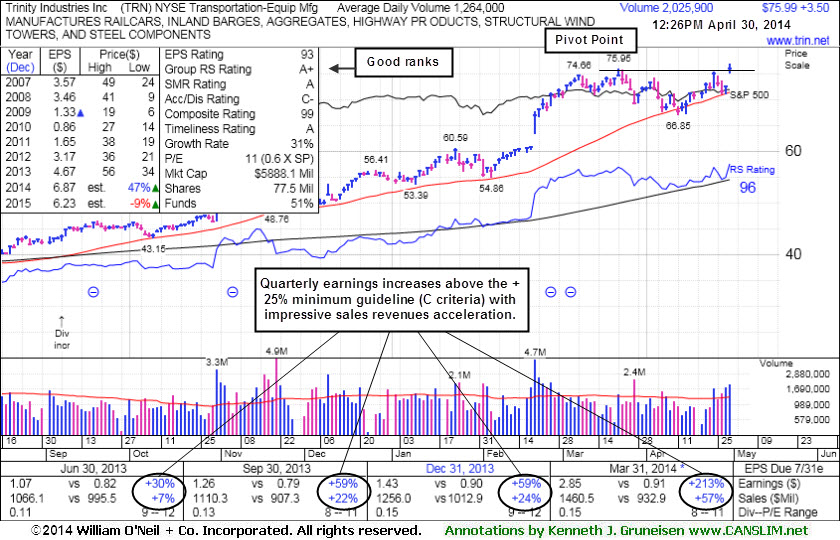
5/1/2014 12:25:44 PM - Y - Pulling back today following a weak finish on the prior session after highlighted in yellow with pivot point cited based on its 3/21/14 high plus 10 cents in the 4/30/14 mid-day report (read here). Gapped up hitting a new 52-week high but failed to close above the pivot point and clinch a technical buy signal. Reported earnings +213% on +57% sales revenues for the Mar '14 quarter, and prior quarterly comparisons were above the +25% minimum earnings guideline (C criteria). Annual earnings (A criteria) have improved following a downturn in FY '08-10. Found support at its 50 DMA line while making gradual progress. See the latest FSU analysis for more details and new annotated graphs.
4/30/2014 6:00:04 PM - Y - It was highlighted in yellow with pivot point cited based on its 3/21/14 high plus 10 cents in the earlier mid-day report (read here). Gapped up today hitting a new 52-week high but failed to close above the pivot point and clinch a technical buy signal. Reported earnings +213% on +57% sales revenues for the Mar '14 quarter, and prior quarterly comparisons were above the +25% minimum earnings guideline (C criteria). Annual earnings (A criteria) have improved following a downturn in FY '08-10. Found support at its 50 DMA line while making gradual progress. See the latest FSU analysis for more details and new annotated graphs.
4/30/2014 12:36:27 PM - Y - Color code is changed to yellow with pivot point cited based on its 3/21/14 high plus 10 cents. Gapped up today hitting a new 52-week high. A strong close above the pivot point may clinch a technical buy signal. Reported earnings +213% on +57% sales revenues for the Mar '14 quarter, and prior quarterly comparisons were above the +25% minimum earnings guideline (C criteria). Annual earnings (A criteria) have improved following a downturn in FY '08-10. Found support at its 50 DMA line while making gradual progress.
3/27/2014 12:57:58 PM - Pulling back from its 52-week high with today's 4th consecutive loss. Reported earnings +59% on +24% sales revenues for the Dec '13 quarter, but fundamental concerns remain. Found support at its 50 DMA line while making gradual progress since noted in the 11/21/13 mid-day report with caution - "Quarterly earnings increases through Sep '13 have been above the +25% minimum guideline (C criteria). Annual earnings (A criteria) history has not been a match with the fact-based system's winning models."
2/20/2014 12:54:33 PM - Gapped up today, hitting a new 52-week high with a considerable volume-driven gain while on track for its 10th consecutive gain. Reported earnings +59% on +24% sales revenues for the Dec '13 quarter, but fundamental concerns remain. Found support at its 50 DMA line while making gradual progress since last noted in the 11/21/13 mid-day report with caution - "Quarterly earnings increases through Sep '13 have been above the +25% minimum guideline (C criteria). Annual earnings (A criteria) history has not been a match with the fact-based system's winning models."
11/21/2013 1:05:58 PM - Gapped down today, abruptly retreating from its 52-week high with volume-driven losses this week. Prior highs and its 50 DMA line define near-term support to watch. Prior mid-day reports repeatedly cautioned members- "Quarterly earnings increases through Sep '13 have been above the +25% minimum guideline (C criteria). Annual earnings (A criteria) history has not been a match with the fact-based system's winning models."
11/18/2013 12:57:55 PM - Perched near its 52-week high today after volume-driven gains last week, extended from any sound base. Prior mid-day reports cautioned members- "Quarterly earnings increases through Sep '13 have been above the +25% minimum guideline (C criteria). Annual earnings (A criteria) history has not been a match with the fact-based system's winning models."
11/14/2013 12:57:46 PM - Hitting another new 52-week high today. Held its ground after volume-driven gains when last noted in the 11/01/13 mid-day report with caution - "Quarterly earnings increases through Sep '13 have been above the +25% minimum guideline (C criteria). Annual earnings (A criteria) history has not been a match with the fact-based system's winning models."
11/1/2013 1:11:20 PM - Hitting a new 52-week high today with a 2nd consecutive volume-driven gain. Quarterly earnings increases through Sep '13 have been above the +25% minimum guideline (C criteria). Annual earnings (A criteria) history has not been a match with the fact-based system's winning models.