10/30/2013 2:09:56 PM - Down again today for a 4th consecutive volume-driven loss while slumping further below its 50 DMA line. It will be dropped from the Featured Stocks list tonight due to technical deterioration. A subsequent rebound above its 50 DMA line is needed to help its outlook improve.
10/29/2013 3:24:40 PM - G - Color code is changed to green while today's volume-driven loss violated its prior lows and its 50 DMA line raising serious concerns and triggering technical sell signals. Only a prompt rebound above the 50 DMA line would help its outlook improve.
10/25/2013 3:03:36 PM - Y - Color code is changed to yellow while pulling back below its "max buy" level on lighter volume following recent gains with above average volume. Prior lows and its 50 DMA line define important near-term support in the $22.50 area where violations would raise serious concerns.
10/24/2013 1:13:26 PM - G - Color code is changed to green after rallying beyond its "max buy" level, trading up today with above average volume following a "positive reversal" on the prior session. Prior lows and its 50 DMA line define important near-term support in the $22.50 area where violations would raise serious concerns.
10/23/2013 1:05:29 PM - Y - Gapped down today yet managed a positive reversal and it is trading near its "max buy" level. Prior lows and its 50 DMA line define important near-term support in the $22.50 area where violations would raise serious concerns.
10/22/2013 4:00:15 PM - Y - Color code is changed to yellow while pulling back below its "max buy" level with a loss on near average volume. Prior lows and its 50 DMA line define important near-term support in the $22.50 area where violations would raise serious concerns.
10/18/2013 5:11:03 PM - G - Hit another new 52-week high with another volume-driven gain lifting it further beyond its "max buy" level. Disciplined investors avoid chasing extended stocks.
10/16/2013 6:54:13 PM - G - Rallied with +89% above average volume today and clinched a technical buy signal while also ending above its "max buy" level. Color code is changed to green while getting extended more than +5% above the pivot point previously cited based on its May 2012 high.
10/15/2013 6:44:38 PM - Y - Color code is changed to yellow after pulling back below its "max buy" level. Recently it wedging higher without great volume conviction behind its gains.
10/11/2013 6:20:14 PM - G - Color code is changed to green after rising beyond its "max buy"level and hitting a new 52-week high with today's 3rd consecutive gain, wedging higher without great volume conviction behind its gains.
10/8/2013 5:19:55 PM - Y - Down again today with above average volume, encountering distributional pressure. Convincing volume-driven gains above its pivot point cited based on its May 2012 high plus 10 cents may signal the beginning of a substantial leg higher.
10/3/2013 5:56:06 PM - Y - Pulled back today with above average volume, encountering distributional pressure. Convincing volume-driven gains above its pivot point cited based on its May 2012 high plus 10 cents may signal the beginning of a substantial leg higher.
9/25/2013 5:55:12 PM - Y - Finished near the session high today with a solid gain backed by only +19% above average volume. Convincing volume-driven gains above its pivot point cited based on its May 2012 high plus 10 cents may signal the beginning of a substantial leg higher.
9/24/2013 6:11:35 PM - Y - Trading in a tight range without producing a convincing volume-driven gain since returning to the Featured Stocks list on 9/12/13. Holding its ground stubbornly while remaining perched near its pivot point cited based on its May 2012 high plus 10 cents.
9/17/2013 6:43:01 PM - Y - Today's gain lacked sufficient volume conviction while wedging above its pivot point cited based on its May 2012 high plus 10 cents. See the latest FSU analysis for more details and a new annotated daily graph.
9/17/2013 3:27:29 PM - Y - Today's gain is lacking volume conviction while wedging above its pivot point cited based on its May 2012 high plus 10 cents. Recently topped its 2012 high with a recent spurt of gains backed by above average volume, and it tallied 16 weekly gains in the span of 18 weeks. Prior mid-day report repeatedly noted - "Fundamentals remain strong with great earnings increases through the Jun '13 quarter. Rebounded and rallied impressively following a deep consolidation below its 200 DMA line since dropped from the Featured Stocks list on 8/28/12." 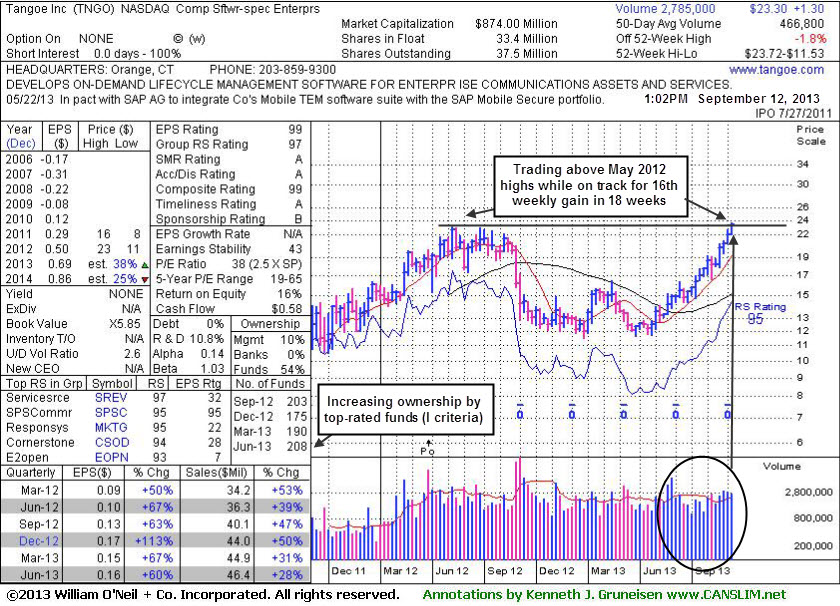
9/12/2013 1:34:42 PM - Y - Color code is changed to yellow with pivot point cited based on its May 2012 high plus 10 cents. Hovering at its 52-week high after recently topping its 2012 high with a recent spurt of gains backed by above average volume, and it is on track for its 16th weekly gain in the span of 18 weeks. Prior mid-day report repeatedly noted - "Fundamentals remain strong with great earnings increases through the Jun '13 quarter. Rebounded and rallied impressively following a deep consolidation below its 200 DMA line since dropped from the Featured Stocks list on 8/28/12."
9/10/2013 12:53:53 PM - Hitting another new 52-week high and topped its 2012 high today while adding to a recent spurt of gains backed by above average volume. Fundamentals remain strong with great earnings increases through the Jun '13 quarter. It has not formed a sound base. Patient investors may watch for a proper base to possibly form and be noted in the weeks ahead. Rebounded and rallied impressively following a deep consolidation below its 200 DMA line since dropped from the Featured Stocks list on 8/28/12.
9/6/2013 12:59:33 PM - Hovering near its 52-week high today following 5 consecutive gains backed by above average volume. Showing resilience and impressive strength since noted in the 8/27/13 mid-day report with caution - "Fundamentals remain strong with great earnings increases through the Jun '13 quarter. It has not formed a sound base. Patient investors may watch for a proper base to possibly form and be noted in the weeks ahead. The broader market (M criteria) should also confirm a new rally before any new buying efforts may be justified. Rebounding near its 2012 high following a deep consolidation below its 200 DMA line since dropped from the Featured Stocks list on 8/28/12."
9/5/2013 12:55:36 PM - Hovering near its 52-week high today following 4 consecutive gains backed by above average volume. Showing resilience and impressive strength since noted in the 8/27/13 mid-day report with caution - "Fundamentals remain strong with great earnings increases through the Jun '13 quarter. It has not formed a sound base. Patient investors may watch for a proper base to possibly form and be noted in the weeks ahead. The broader market (M criteria) should also confirm a new rally before any new buying efforts may be justified. Rebounding near its 2012 high following a deep consolidation below its 200 DMA line since dropped from the Featured Stocks list on 8/28/12."
9/3/2013 12:41:49 PM - Hitting a new 52-week high with today's 3rd consecutive gain. Showing resilience and strength since noted in the 8/27/13 mid-day report with caution - "Fundamentals remain strong with great earnings increases through the Jun '13 quarter. It has not formed a sound base. Patient investors may watch for a proper base to possibly form and be noted in the weeks ahead. The broader market (M criteria) should also confirm a new rally before any new buying efforts may be justified. Rebounding near its 2012 high following a deep consolidation below its 200 DMA line since dropped from the Featured Stocks list on 8/28/12."
8/30/2013 12:56:03 PM - Showing resilience and strength since noted in the 8/27/13 mid-day report - "Fundamentals remain strong with great earnings increases through the Jun '13 quarter. It has not formed a sound base. Patient investors may watch for a proper base to possibly form and be noted in the weeks ahead. The broader market (M criteria) should also confirm a new rally before any new buying efforts may be justified. Rebounding near its 2012 high following a deep consolidation below its 200 DMA line since dropped from the Featured Stocks list on 8/28/12."
8/27/2013 1:15:38 PM - Fundamentals remain strong with great earnings increases through the Jun '13 quarter. It has not formed a sound base. Patient investors may watch for a proper base to possibly form and be noted in the weeks ahead. The broader market (M criteria) should also confirm a new rally before any new buying efforts may be justified. Rebounding near its 2012 high following a deep consolidation below its 200 DMA line since dropped from the Featured Stocks list on 8/28/12.
8/28/2012 4:09:31 PM - Fell sharply in the late afternoon and violated its 200 DMA line with a considerable loss on very heavy volume nearly 15 times average. It will be dropped from the Featured Stocks list tonight due to poor technical action. A rebound above its 50 DMA line is needed for its outlook to improve.
8/24/2012 6:10:46 PM - G - Slump below its 50 DMA line this week hurt its outlook. Faces resistance up to the $23 level which has been a stubborn resistance area in recent months. See the latest FSU analysis for more details and a new annotated graph.
8/23/2012 2:50:30 PM - G - Still quietly slumping below its 50 DMA line, and it faces resistance up to the $23 level which has been a stubborn resistance area in recent months. Volume-driven gains above its pivot point are needed to trigger a proper technical buy signal.
8/20/2012 2:34:10 PM - G - Slumping back below its 50 DMA line with today's loss on light volume. It faces resistance up to the $23 level which has been a stubborn resistance area in recent months. Volume-driven gains above its pivot point are needed to trigger a proper technical buy signal.
8/16/2012 3:58:12 PM - G - Rebounding near its 50 DMA line with today's gain on light volume. It still faces resistance up to the $23 level which has been a stubborn resistance area in recent months. Volume-driven gains above its pivot point are needed to trigger a proper technical buy signal.
8/15/2012 12:57:20 PM - G - Loss today has it slumping under its 50 DMA line hurting its technical stance and its color code is changed to green. Reported earnings +67% on +39% sales revenues for the Jun '12 quarter. Pivot point cited is based on its 6/26/12 high plus 10 cents, and it still faces resistance up to the $23 level which has been a stubborn resistance area in recent months. Volume-driven gains above its pivot point are needed to trigger a proper technical buy signal.
8/13/2012 3:55:20 PM - Y - Pulling back today with below average volume. Last week's gap up and rally above its 50 DMA line improved its technical stance. Reported earnings +67% on +39% sales revenues for the Jun '12 quarter. Pivot point cited is based on its 6/26/12 high plus 10 cents, and it still faces resistance up to the $23 level which has been a stubborn resistance area in recent months. Volume-driven gains above its pivot point are needed to trigger a proper technical buy signal.
8/9/2012 1:37:21 PM - Y - Gapped up above its 50 DMA line today, improving its technical stance with a volume-driven gain. Reported earnings +67% on +39% sales revenues for the Jun '12 quarter. Color code is changed to yellow again as it returns to the Featured Stocks list with a new pivot point cited based on its 6/26/12 high plus 10 cents. It still faces resistance up to the $23 level which has been a stubborn resistance area in recent months. Volume-driven gains above its pivot point are needed to trigger a proper technical buy signal.
7/24/2012 4:06:24 PM - Slumped further below its 50 DMA line today and violated recent lows raising more serious concerns. Its next support comes into play near its June low and its 200 DMA line in the $17 area. Faces overhead supply up to the $23 level which has been a stubborn resistance area in recent months. Based on weak action it will be dropped from the Featured Stocks list tonight.
7/24/2012 3:48:10 PM - G - Today's 4th consecutive loss has it slumping further below its 50 DMA line and violating recent lows raising more serious concerns. Its next support comes into play near its June low and its 200 DMA line in the $17 area. Faces overhead supply up to the $23 level which has been a stubborn resistance area in recent months. It did not trigger a new technical buy signal since recently featured again in yellow.
7/23/2012 4:37:56 PM - G - Traded further below its 50 DMA line and slumped toward prior lows with today's 3rd consecutive loss. Faces overhead supply up to the $23 level which has been a stubborn resistance area in recent months. It did not trigger a new technical buy signal since recently featured again in yellow.
7/20/2012 5:31:59 PM - G - Color code is changed to green after finishing the week slumping back below its 50 DMA line hurting its technical stance. It did not trigger a new technical buy signal since recently featured again in yellow.
7/18/2012 1:18:17 PM - Y - Trading up today on light volume, and its color code is changed to yellow after rising back above its 50 DMA line helped its technical stance. Gains above the pivot point backed by +40% above average volume or greater could trigger a new technical buy signal.
7/13/2012 3:22:34 PM - G - Trading up today on light volume, but still below its 50 DMA line following a streak of 6 consecutive losses on light volume. Gains back above that important short-term average are needed to help its outlook, and gains above the pivot point backed by +40% above average volume or greater could trigger a new technical buy signal.
7/11/2012 8:05:34 PM - G - Slumped under its 50 DMA line today with a 5th consecutive loss on light volume, and its color code is changed to green. Gains back above that important short-term average are needed to help its outlook, and gains above the pivot point backed by +40% above average volume or greater could trigger a new technical buy signal.
7/10/2012 5:00:40 PM - Y - Sputtering near its 50 DMA line with a 4th consecutive loss today on light volume. Gains above the pivot point backed by +40% above average volume or greater could trigger a new technical buy signal.
7/6/2012 6:21:45 PM - Y - Pulled back near its 50 DMA line with a loss on light volume today. Gains above the pivot point backed by +40% above average volume or greater could trigger a new technical buy signal.
7/3/2012 1:51:32 PM - Y - Finished near the session high with a gain on light volume today. Gains above the pivot point backed by +40% above average volume or greater could trigger a new technical buy signal.
6/29/2012 6:17:46 PM - Y - Rebounded above its 50 DMA line today with a gap up gain backed by above average volume indicative of institutional support near that important short-term average. Color code is changed to yellow again based on its resilience. Gains above the pivot point backed by +40% above average volume or greater could trigger a new technical buy signal.
6/28/2012 5:46:44 PM - G - Color code is changed to green after slumping below its 50 DMA line again without triggering a new technical buy signal. See the latest FSU analysis for more details and a new annotated graph.
6/27/2012 1:10:32 PM - Y - Color code is changed to yellow with new pivot point cited based on its 5/09/12 high plus 10 cents. Little resistance remains due to overhead supply and a volume-driven gain above its pivot point may trigger a new technical buy signal. Based on poor technical action when last noted on 6/01/12 it was dropped from the Featured Stocks list. However, it subsequently rebounded above its 50 DMA line and showed resilience near that important short-term average in recent weeks.
6/1/2012 1:54:54 PM - Gapped down today amid widespread market weakness, slumping further below its 50 DMA line with a 7th consecutive loss. Based on poor technical action it will be dropped from the Featured Stocks list tonight.
5/31/2012 2:06:55 PM - G - Volume is above average today as a 6th consecutive loss raises more concerns while slumping under prior highs in the $20 area and violating its 50 DMA line. The M criteria argues against new buying efforts in any stocks until a new rally is confirmed with a solid follow-through day by at least one of the major averages.
5/30/2012 2:10:35 PM - G - Volume is light today thus far but concerns are being raised while quietly slumping below prior highs in the $20 area and below important support at its 50 DMA line. The M criteria argues against new buying efforts in any stocks until a new rally is confirmed with a solid follow-through day by at least one of the major averages.
5/29/2012 4:53:55 PM - G - Volume totals have been drying up while consolidating above prior highs in the $20 area and above important support at its 50 DMA line. It has consolidated below its "max buy" level, however investors' odds are more favorable when buying on strength rather than on pullbacks.
5/25/2012 4:53:08 PM - G - Volume totals have been drying up while consolidating above prior highs in the $20 area and above important support at its 50 DMA line. It has consolidated below its "max buy" level, however investors' odds are more favorable when buying on strength rather than on pullbacks. Broader market conditions (M criteria) also argue against new buying efforts until a new confirmed rally with follow-through day. See the latest FSU analysis for more details and a new annotated graph.
5/21/2012 4:45:48 PM - G - Volume totals have been cooling while consolidating above prior highs in the $20 area and above important support at its 50 DMA line. Broader market conditions (M criteria) argue against new buying efforts until a new confirmed rally with follow-through day.
5/18/2012 4:05:02 PM - G - Loss on light volume today, consolidating above prior highs in the $20 area and above important support at its 50 DMA line. Broader market conditions (M criteria) argue against new buying efforts until a new confirmed rally with follow-through day.
5/16/2012 2:06:03 PM - G - Reversing for a considerable loss and slumping under its "max buy" level today after starting the session with a small gap up. Support to watch is at its 50 DMA line.
5/11/2012 4:03:58 PM - G - It found impressive support at its 50 DMA line and now it is extended from its prior base. Up today with light volume while rallying further above its "max buy" level for a best-ever close.
5/9/2012 1:03:54 PM - G - Reported earnings +50% on +53% sales revenues for the quarter ended March 31, 2012 versus the year ago period. Color code is changed to green after rallying above its "max buy" level to new 52-week high territory.
5/9/2012 10:08:44 AM - Y - Reported earnings +50% on +53% sales revenues for the quarter ended March 31, 2012 versus the year ago period. Its considerable gain today has it rallying near its "max buy" level and near its 52-week high after finding support at its 50 DMA line.
5/4/2012 1:21:18 PM - Y - Loss today has it retreating below its pivot point again. A close below its recent low close ($19.53 on 4/24/12) would raise more serious concerns of technical deterioration while negating its 4/19/12 breakout. The 50 DMA line defines important near-term support to watch.
5/3/2012 6:20:44 PM - Y - Color code is changed to yellow after a loss on light volume led to a close just below its "max buy" level. Recently found support near prior highs in the $20 area previously noted as initial support to watch on pullbacks following its 4/19/12 breakout. The 50 DMA line defines important support to watch.
5/1/2012 6:17:37 PM - G - Up today on light volume, closing above its "max buy" level and its color code is changed to green. Recently found support near prior highs in the $20 area previously noted as initial support to watch on pullbacks following its 4/19/12 breakout. The 50 DMA line defines important support to watch.
4/30/2012 5:29:09 PM - Y - Pulled back today on higher but below average volume. Recently found support near prior highs in the $20 area previously noted as initial support to watch on pullbacks following its 4/19/12 breakout. The 50 DMA line ($18.86 now) defines important support to watch.
4/27/2012 6:54:51 PM - Y - Its 3 consecutive gains came on very light volume, yet it rallied to its second-best close. It found support near prior highs in the $20 area previously noted as initial support to watch on pullbacks following its 4/19/12 breakout. The 50 DMA line ($18.81 now) defines important support to watch.
4/25/2012 8:06:31 PM - Y - Today's gain came on lighter volume following 3 consecutive losses, yet it rebounded above prior highs in the $20 area previously noted as initial support to watch on pullbacks. The 50 DMA line ($18.66) is the next important support level to watch.
4/23/2012 11:39:14 AM - Y - Today's 2nd consecutive loss amid a mostly negative market has negated the recent breakout with it slumping under prior highs in the $20 area previously noted as initial support to watch on pullbacks. The 50 DMA line ($18.38) is the next important support level to watch.
4/20/2012 1:32:08 PM - Y - Pulling back today following a considerable gain on the prior session with more than 2 times average that clinched a technical buy signal. Prior highs in the $20 area define initial support to watch on pullbacks.
4/19/2012 12:35:54 PM - Y - Color code was changed to yellow, and a strong finish with at least +40% above average volume may clinch a technical buy signal. Hitting a new 52-week high today, rising above its prior highs and quickly rallying near its "max buy" level.
4/19/2012 11:15:20 AM - Y - Hitting a new 52-week high today, rising above its prior highs and above its pivot point. Color code is changed to yellow, and a strong finish with sufficient above average volume may clinch a technical buy signal.
4/16/2012 5:44:08 PM - G - Gapped up today and challenged its 52-week high then reversed into the red for a small loss with below average volume. Found prompt support after recent violations of its 50 DMA line triggered technical sell signals following a 3/20/12 Public Offering.
4/12/2012 3:06:12 PM - G - Rebounding to within close striking distance of its 52-week high with light volume behind its gain today. Found prompt support after recent violations of its 50 DMA line triggered technical sell signals following a 3/20/12 Public Offering.
4/11/2012 11:40:52 AM - G - Rebounding near its 50 DMA line today. Damaging losses on higher volume led to technical deterioration that recently raised concerns.
4/10/2012 3:26:57 PM - G - Violating its 50 DMA line again with today's damaging loss on higher volume. Color code is changed to green as deterioration below that important short-term average raises concerns.
4/9/2012 5:44:30 PM - Y - Down today, finishing -7.5% off its all-time high. Its 50 DMA line defines important support to watch, while subsequent deterioration leading to a close below that important short-term average would raise concerns.
4/5/2012 3:59:37 PM - Y - Up today on lighter volume, only -3.2% off its all-time high. Finished the prior session near its intra-day high, finding prompt support after undercutting its 50 DMA line with a damaging pullback.
4/4/2012 10:45:23 AM - Y - Undercut its 50 DMA line with a damaging pullback today, now rebounding above that short-term average, yet clearly coming under distributional pressure. See the latest FSU analysis for more details and a new annotated graph.
4/3/2012 4:45:40 PM - Y - Still perched near its 52-week high, it completed a new Public Offering on 3/29/12. See the latest FSU analysis for more details and a new annotated graph.
3/30/2012 12:30:23 PM - Y - Perched near its 52-week high, it completed a Public Offering on 3/29/12. On 3/27/12 it was noted - "Latest consolidation above support at its 50 DMA line may be considered a 'square box' base. A new pivot point is cited based on its 2/24/12 high plus 10 cents while its color code is changed to yellow. A subsequent volume-driven gain with at least +40% above average volume may trigger a new (or add-on) technical buy signal."
3/29/2012 1:19:55 PM - Y - Today's volume-driven gain has it nearly challenging its 52-week high and its new pivot point, poised for a possible best-ever close. On 3/27/12 it was noted - "Latest consolidation above support at its 50 DMA line may be considered a 'square box' base. A new pivot point is cited based on its 2/24/12 high plus 10 cents while its color code is changed to yellow. A subsequent volume-driven gain with at least +40% above average volume may trigger a new (or add-on) technical buy signal."
3/28/2012 5:55:53 PM - Y - Finished near the session high today with a gain on above average volume after a positive reversal following early weakness. Touched a new 52-week high on the prior session and it was noted - "Latest consolidation above support at its 50 DMA line may be considered a 'square box' base. A new pivot point is cited based on its 2/24/12 high plus 10 cents while its color code is changed to yellow. A subsequent volume-driven gain with at least +40% above average volume may trigger a new (or add-on) technical buy signal."
3/27/2012 1:36:01 PM - Y - Touched a new 52-week high today. It was noted while working on a base-on-base type pattern, and it latest consolidation above support at its 50 DMA line may be considered a "square box" base. A new pivot point is cited based on its 2/24/12 high plus 10 cents while its color code is changed to yellow. A subsequent volume-driven gain with at least +40% above average volume may trigger a new (or add-on) technical buy signal.
3/23/2012 1:14:43 PM - G - Perched just -4.8% off its 52-week high today and working on a base-on-base type pattern. Consolidating above prior highs in the $16 area and its 50 DMA line defining support to watch.
3/22/2012 10:51:35 AM - G - Working on a base-on-base type pattern, still consolidating above prior highs in the $16 area and its 50 DMA line defining support to watch.
3/19/2012 7:05:50 PM - G - Prior highs in the $16 area and its 50 DMA line coincide and define important chart support to watch while consolidating.
3/13/2012 9:51:55 AM - G - Gapped down today, slumping near its "max buy" level. Prior highs in the $16 area and its 50 DMA line coincide and define important chart support to watch while consolidating.
3/12/2012 6:19:24 PM - G - Still consolidating above its "max buy" level today and extended from prior highs in the $16 area that define support to watch on pullbacks.
3/6/2012 11:41:19 AM - G - Small gap down today. Still consolidating above its "max buy" level and still too extended from prior highs in the $16 area to be considered buyable under the fact-based investment system's guidelines.
3/2/2012 4:36:22 PM - G - Down today for its 5th consecutive loss, 4 of which were marked by above average volume. Remains above its "max buy" level and extended from prior highs in the $16 area which define initial support to watch on pullbacks.
2/29/2012 4:44:19 PM - G - Down today for its 3rd consecutive loss marked by above average volume after rallying to new highs with volume-driven gains. It is extended from prior highs in the $16 area which define initial support to watch on pullbacks.
2/24/2012 3:40:27 PM - G - Getting more extended from its prior base, and above average volume is behind today's 4th consecutive gain. Prior highs in the $16 area define initial support to watch on pullbacks.
2/23/2012 12:59:20 PM - G - Gain today has getting more extended from its prior base. Found support near prior highs in the $16 area during the pullback following its technical breakout last week.
2/21/2012 1:28:15 PM - G - Gain today has it perched near its best-ever close. Found support near prior highs in the $16 area during the pullback following its technical breakout last week.
2/17/2012 12:44:08 PM - G - Reversed into the red after touching another new 52-week high today. Found support near prior highs in the $16 area during the pullback following its technical breakout this week.
2/16/2012 12:40:08 PM - G - Following earnings news it rallied with heavy volume and hit another new 52-week high today. Its color code is changed to green after rallying back above its "max buy" level. TNGO was featured in yellow in the 2/13/12 mid-day report (read here) with a pivot point cited based on its 52-week high plus 10 cents. See the latest FSU analysis for more details and an annotated graph.
2/15/2012 1:16:43 PM - Y - Erasing a large part of the prior session's big gain with a loss today on heavy volume. Color code is changed to yellow while pulling back near its prior high which define initial support to watch. Due to report earnings after the close today, and volume and volatility often increase near earnings news. TNGO was featured in yellow in the 2/13/12 mid-day report (read here) with a pivot point cited based on its 52-week high plus 10 cents. See the latest FSU analysis for more details and an annotated graph.
2/14/2012 6:37:02 PM - G - Triggered a technical buy signal and quickly blasted well above its "max buy" level with today's considerable gain backed by more than 8 times average volume. Color code is changed to green after getting too extended from the proper buying range defined under the fact-based system's guidelines. It was featured in yellow in the 2/13/12 mid-day report (read here) with a pivot point cited based on its 52-week high plus 10 cents. See the latest FSU analysis for more details and an annotated graph.
2/14/2012 12:57:38 PM - Y - Hit a new all-time high today and traded above its pivot point with a 2nd consecutive volume-driven gain. It was featured in yellow in the 2/13/12 mid-day report (read here) with a pivot point cited based on its 52-week high plus 10 cents while noted - "Currently it is consolidating above its 50 DMA line and building on an orderly base pattern while perched within close striking distance of its 52-week high. Recent quarterly comparisons showed strong sales revenues and earnings increases. Disciplined investors may watch for volume-driven gains above its pivot point which are needed to trigger a proper technical buy signal."
2/14/2012 11:44:34 AM - Y - Hit a new all-time high today with a 2nd consecutive volume-driven gain. It was featured in yellow in the 2/13/12 mid-day report (read here) with a pivot point cited based on its 52-week high plus 10 cents while noted - "Currently it is consolidating above its 50 DMA line and building on an orderly base pattern while perched within close striking distance of its 52-week high. Recent quarterly comparisons showed strong sales revenues and earnings increases. Disciplined investors may watch for volume-driven gains above its pivot point which are needed to trigger a proper technical buy signal."
2/13/2012 6:08:33 PM - Y - Posted a solid gain today with above average volume. It was featured in yellow in the mid-day report (read here) with a pivot point cited based on its 52-week high plus 10 cents while noted - "Currently it is consolidating above its 50 DMA line and building on an orderly base pattern while perched within close striking distance of its 52-week high. Recent quarterly comparisons showed strong sales revenues and earnings increases. Disciplined investors may watch for volume-driven gains above its pivot point which are needed to trigger a proper technical buy signal."
2/13/2012 12:21:34 PM - Y - Color code is changed to yellow with pivot point cited based on its 52-week high plus 10 cents. Currently it is consolidating above its 50 DMA line and building on an orderly base pattern while perched within close striking distance of its 52-week high. Recent quarterly comparisons showed strong sales revenues and earnings increases. Disciplined investors may watch for volume-driven gains above its pivot point which are needed to trigger a proper technical buy signal.
12/20/2011 1:45:09 PM - Gain today has it poised for a best-ever close and challenging its 52-week high. Recent quarterly comparisons showed strong sales revenues and earnings increases. Prior mid-day reports noted - "Limited history is a concern, and it is up considerably from its $10 IPO on 7/27/11."
12/15/2011 1:00:18 PM - It has not formed a sound looking base pattern, yet touched a new 52-week high today with above average volume behind a 5th consecutive gain. Recent quarterly comparisons showed strong sales revenues and earnings increases, however prior mid-day reports noted - "Limited history is a concern, and it is up considerably from its $10 IPO on 7/27/11."
12/14/2011 1:02:53 PM - A "negative reversal" marked its all-time high on 11/16/11, and it has not formed a sound looking base pattern. The 11/01/11 mid-day report noted - "Its choppy 4-week consolidation is not considered to be a sound base pattern. Limited history is a concern, and it is up considerably from its $10 IPO on 7/27/11."
11/11/2011 1:06:22 PM - Up today following a negative reversal on the prior session after touching a new high. The 11/09/11 mid-day report noted - "Its choppy 4-week consolidation is not considered to be a sound base pattern. Limited history is a concern, and it is up considerably from its $10 IPO on 7/27/11."
11/9/2011 1:30:01 PM - Its choppy 4-week consolidation is not considered to be a sound base pattern. Limited history is a concern, and it is up considerably from its $10 IPO on 7/27/11.