3/15/2023 12:58:41 PM - Due to report Jan '23 quarterly results. Volume and volatility often increase near earnings news. Today's damaging volume-driven loss has it -19.5% off its high hit last week. It will be dropped from the Featured Stocks list tonight. Only a prompt rebound above the 50 DMA line ($43.41) would help its outlook improve.
3/14/2023 1:05:54 PM - G - Today's gain has it rebounding near its 50 DMA line ($43.42) which may act as resistance after damaging volume-driven losses. Only a prompt rebound above the 50 DMA line would help its outlook improve.
3/13/2023 1:12:33 PM - G - Color code is changed to green after gapping down today violating its 50 DMA line ($43.39) triggering a technical sell signal folllowing noted volume-driven losses last week. Only a prompt rebound above the 50 DMA line would help its outlook improve.
3/10/2023 5:07:49 PM - Y - Pulled back today for a damaging 3rd consecutive volume-driven loss, testing support at its 50 DMA line ($43.35). Color code was changed to yellow after retreating below its "max buy" level. More damaging losses may raise concerns and trigger a technical sell signal.
3/10/2023 2:05:58 PM - Y - Pulling back today for a 3rd consecutive volume-driven loss, testing support at its 50 DMA line ($43.35), and its color code is changed to yellow after retreating below its "max buy" level. More damaging losses may raise concerns and trigger a technical sell signal.
3/7/2023 5:38:12 PM - G - Posted a gain today with light volume for a best-ever close. Its 50 DMA line ($42.98) definies important near-term support to watch on pullbacks.
3/3/2023 5:54:50 PM - G - Color code is changed to green after posting a 3rd consecutive gain rising above its "max buy" level for a best-ever close near its all-time high. Its 50 DMA line ($42.63) definies important near-term support to watch on pullbacks.
2/28/2023 6:22:50 PM - Y - Color code is changed to yellow after it pulled back today below its "max buy" level with above average volume after hitting a new all-time high with a volume-driven gain on the prior session. Its 50 DMA line ($42.16) definies important near-term support to watch on pullbacks. See the latest FSU analysis for more details and a new annotated graph.
2/27/2023 1:07:23 PM - G - Hitting a new all-time high with today's gain and its color code is changed to green after rising above its "max buy" level. Its 50 DMA line ($42.06) definies important near-term support to watch on pullbacks. It wedged into new high territory with gains lacking great volume conviction since a new pivot point was recently cited based on its 12/01/22 high plus 10 cents.
2/23/2023 10:46:04 AM - Y - Quietly challenging its all-time high with today's gain. Its 50 DMA line ($41.79) definies important near-term support to watch on pullbacks. It wedged into new high territory with gains lacking great volume conviction since a new pivot point was recently cited based on its 12/01/22 high plus 10 cents.
2/21/2023 10:14:00 AM - Y - Still sputtering near its pivot point. Its 50 DMA line ($41.60) definies important near-term support to watch. It wedged into new high territory with gains lacking great volume conviction since a new pivot point was recently cited based on its 12/01/22 high plus 10 cents.
2/10/2023 5:19:18 PM - Y - Pulled back today for a 5th consecutive loss with below average volume, sputtering below the pivot point. Its 50 DMA line ($41.34) definies important near-term support to watch on pullbacks. It wedged into new high territory with gains lacking great volume conviction since a new pivot point was recently cited based on its 12/01/22 high plus 10 cents.
2/6/2023 6:06:07 PM - Y - Pulled back today following a streak of 11 consecutive gains. Its 50 DMA line ($40.62) definies important near-term support to watch on pullbacks. It wedged into new high territory with gains lacking great volume conviction since a new pivot point was recently cited based on its 12/01/22 high plus 10 cents.
2/2/2023 6:23:32 PM - Y - Wedging higher, it hit yet another new all-time high with volume +18% above average behind today's 10th consecutive gain. Its 50 DMA line ($40.20) definies important near-term support to watch on pullbacks. A new pivot point was recently cited based on its 12/01/22 high plus 10 cents.
1/30/2023 6:04:29 PM - Y - Ended near the middle of iits intra-day range today after hitting a new all-time high with its 7th consecutive gain. The prior high in the $38 area defines important support to watch along with its 50 DMA line ($39.60). A new pivot point was recently cited based on its 12/01/22 high plus 10 cents. See the latest FSU analysis for more details and a new annotated graph.
1/30/2023 12:50:30 PM - Y - Hitting s new all-time high with today's 7th consecutive gain with near average volume. The prior high in the $38 area defines important support to watch along with its 50 DMA line ($39.61). A new pivot point was recently cited based on its 12/01/22 high plus 10 cents.
1/26/2023 5:48:33 PM - Y - Posted a 5th consecutive gain today with near average volume. The prior high in the $38 area defines important support to watch along with its 50 DMA line ($39.24)..A new pivot point was recently cited based on its 12/01/22 high plus 10 cents.
1/25/2023 5:36:20 PM - Y - Posted a 4th consecutive gain today with below average volume. The prior high in the $38 area defines important support to watch along with its 50 DMA line ($39.10)..A new pivot point was recently cited based on its 12/01/22 high plus 10 cents.
1/24/2023 5:47:15 PM - Y - Posted a 3rd consecutive gain today with lighter volume. The prior high in the $38 area defines important support to watch along with its 50 DMA line ($38.97)..A new pivot point was recently cited based on its 12/01/22 high plus 10 cents.
1/20/2023 10:34:35 PM - Y - Posted a gain today with lighter volume. The prior high in the $38 area defines important support to watch along with its 50 DMA line ($38.69)..A new pivot point was recently cited based on its 12/01/22 high plus 10 cents.
1/18/2023 5:18:53 PM - Y - Pulled back today with higher (near average) volume. The prior high in the $38 area defines important support to watch along with its 50 DMA line ($38.48)..A new pivot point was recently cited based on its 12/01/22 high plus 10 cents.
1/13/2023 5:14:11 PM - Y - Color code is changed to yellow with new pivot point cited based on its 12/01/22 high plus 10 cents. Found support when recently consolidating near the prior high in the $38 area which defines important support to watch along with its 50 DMA line ($38.17). See the latest FSU analysis for more details and a new annotated graph.
1/10/2023 1:35:28 PM - G - Color code is changed to green while rising back above its "max buy" level. Found support when recently consolidating near the prior high in the $38 area which defines initial support to watch above its 50 DMA line ($37.70). Fundamentals remain strong.
1/6/2023 3:57:27 PM - Y - Posting a 3rd consecutive gain today with higher volume. Found support when recently consolidating near the prior high in the $38 area which defines initial support to watch above its 50 DMA line ($37.35). Fundamentals remain strong after reporting Oct '22 quarterly earnings +91% on +47% sales revenues.
1/3/2023 12:46:18 PM - Y - Found support when recently consolidating near the prior high in the $38 area which defines initial support to watch above its 50 DMA line ($36.89). Fundamentals remain strong after reporting Oct '22 quarterly earnings +91% on +47% sales revenues.
12/30/2022 5:02:14 PM - Y - Found support when recently consolidating near the prior high in the $38 area which defines initial support to watch above its 50 DMA line ($36.73). Fundamentals remain strong after reporting Oct '22 quarterly earnings +91% on +47% sales revenues. See the latest FSU analysis for more details and a new annotated graph.
12/29/2022 3:35:52 PM - Y - Found support when recently consolidating near the prior high in the $38 area which defines initial support to watch above its 50 DMA line ($36.57). Fundamentals remain strong after reporting Oct '22 quarterly earnings +91% on +47% sales revenues.
12/23/2022 5:31:46 PM - Y - Posted a solid gain today with below average volume. Consolidating near the prior high in the $38 area which defines initial support to watch above its 50 DMA line ($36.08). Fundamentals remain strong after reporting Oct '22 quarterly earnings +91% on +47% sales revenues.
12/21/2022 6:08:48 PM - Y - Still consolidating near the prior high in the $38 area which defines initial support to watch above its 50 DMA line ($35.77). Fundamentals remain strong after reporting Oct '22 quarterly earnings +91% on +47% sales revenues.
12/15/2022 4:56:40 PM - Y - Suffered a big loss today consolidating near the prior high in the $38 area which defines initial support to watch. Fundamentals remain strong after reporting Oct '22 quarterly earnings +91% on +47% sales revenues.
12/12/2022 6:48:53 PM - Y - Consolidating in an orderly fashion above the prior high in the $38 area which defines initial support to watch. Fundamentals remain strong after reporting Oct '22 quarterly earnings +91% on +47% sales revenues.
12/7/2022 12:13:47 PM - Y - Prior high in the $38 area defines initial support to watch. Pulling back below its "max buy" level and its color code was changed to yellow. On track for a 5th consecutive loss with above average volume after a technical breakout noted on 11/30/22. Fundamentals remain strong after reporting Oct '22 quarterly earnings +91% on +47% sales revenues.
12/6/2022 12:28:19 PM - Y - Pulling back below its "max buy" level today and its color code is changed to yellow, on track for a 4th consecutive loss with above average volume, consolidating after a technical breakout noted on 11/30/22. Prior high in the $38 area defines initial support to watch. Fundamentals remain strong after reporting Oct '22 quarterly earnings +91% on +47% sales revenues.
12/5/2022 1:13:38 PM - G - Consolidating after a technical breakout noted on 11/30/22. Finished strong after highlighted in yellow with pivot point cited based on its 11/23/21 high plus 10 cents. Quickly got extended more than +5% above the prior high and its color code was changed to green. Prior high in the $38 area defines initial support to watch. Fundamentals remain strong after reporting Oct '22 quarterly earnings +91% on +47% sales revenues.
12/2/2022 12:39:45 PM - G - Consolidating after a technical breakout noted on 11/30/22. Finished strong after highlighted in yellow with pivot point cited based on its 11/23/21 high plus 10 cents. Quickly got extended more than +5% above the prior high and its color code was changed to green. Prior high in the $38 area defines initial support to watch. Fundamentals remain strong after reporting Oct '22 quarterly earnings +91% on +47% sales revenues.
12/1/2022 1:04:08 PM - G - Holding its ground today. Finished strong after highlighted in yellow with pivot point cited based on its 11/23/21 high plus 10 cents in the prior mid-day report. Gapped up and rallied for a big gain and new all-time high backed by +821% above average volume triggering a technical buy signal. Quickly got extended more than +5% above the prior high and its color code is changed to green. Fundamentals remain strong after reporting Oct '22 quarterly earnings +91% on +47% sales revenues. Went through a long consolidation below its 200 DMA line since dropped from the Featured Stocks list on 1/26/22.
11/30/2022 5:12:18 PM - Y - Finished strong after highlighted in yellow with pivot point cited based on its 11/23/21 high plus 10 cents in the earlier mid-day report. Gapped up and rallied for a big gain and new all-time high backed by +821% above average volume triggering a technical buy signal, but quickly getting extended from the prior high. Fundamentals remain strong after reporting Oct '22 quarterly earnings +91% on +47% sales revenues. Went through a long consolidation below its 200 DMA line since dropped from the Featured Stocks list on 1/26/22. See the latest FSU analysis for more details and a new annotated graph.
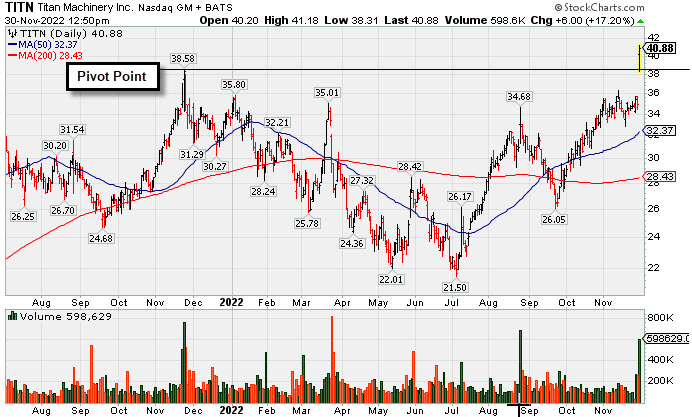
11/30/2022 12:53:42 PM - Y - Color code is changed to yellow with pivot point cited based on its 11/23/21 high plus 10 cents. Gapped up today rallying for a big volume-driven gain and new all-time high. Fundamentals remain strong after reporting Oct '22 quarterly earnings +91% on +47% sales revenues. Went through a long consolidation below its 200 DMA line since dropped from the Featured Stocks list on 1/26/22.
8/25/2022 12:41:08 PM - Today's big volume-driven gain has it challenging its March high. Additional resistance remains due to overhead supply up to the $38 level. Fundamentals remain strong after reporting Jul '22 quarterly earnings +96% on +31% sales revenues. Went through a deep consolidation below its 200 DMA line since last noted and dropped from the Featured Stocks list on 1/26/22.
1/26/2022 5:21:26 PM - Still consolidating above its 200 DMA line ($29.45) after briefly undercutting that long-term moving average and the prior low ($30.27 on 12/20/21). It will be dropped from the Featured Stocks list tonight. A rebound above the 50 DMA line ($33.11) still is needed for its outlook to improve. It faces resistance due to overhead supply up to the $38 level. Fundamentals remain strong. See the latest FSU analysis for more details and an annotated graph.
1/25/2022 5:13:45 PM - G - Suffered a loss today with lighter volume following a "positive reversal" after undercutting both its 200 DMA line and the prior low ($30.27 on 12/20/21). A rebound above the 50 DMA line ($33.16) still is needed for its outlook to improve. It faces resistance due to overhead supply up to the $38 level. Fundamentals remain strong. See the latest FSU analysis for more details and an annotated graph.
1/24/2022 5:38:53 PM - G - Managed a "positive reversal" today after undercutting both its 200 DMA line and the prior low ($30.27 on 12/20/21). A rebound above the 50 DMA line ($33.20) still is needed for its outlook to improve. It faces resistance due to overhead supply up to the $38 level. Fundamentals remain strong. See the latest FSU analysis for more details and a new annotated graph.
1/20/2022 5:39:00 PM - G - Sank well below its 50 DMA line ($33.25) with today's 3rd consecutive loss testing the prior low ($30.27 on 12/20/21). A rebound above the 50 DMA line is needed for its outlook to improve. It faces resistance due to overhead supply up to the $38 level. Fundamentals remain strong.
1/18/2022 5:18:12 PM - G - Pulled back today with lighter volume still testing support near its 50 DMA line ($33.24). It faces resistance due to overhead supply up to the $38 level. Reported Oct '21 quarterly earnings +81% on +26% sales revenues over the year ago period, its 4th strong quarterly comparison.
1/10/2022 5:23:56 PM - G - Pulled back today with lighter volume undercutting its 50 DMA line ($32.86). It has not formed a sound base and faces resistance due to overhead supply up to the $38 level. Reported Oct '21 quarterly earnings +81% on +26% sales revenues over the year ago period, its 4th strong quarterly comparison.
1/5/2022 8:21:37 PM - G - Pulled back today with lighter volume, consolidating above its 50 DMA line ($32.52). It has not formed a sound base and faces resistance due to overhead supply up to the $38 level. Reported Oct '21 quarterly earnings +81% on +26% sales revenues over the year ago period, its 4th strong quarterly comparison.
12/31/2021 5:03:59 PM - G - Consolidating after finding prompt support near its 50 DMA line ($32.18) but it has not formed a sound base and faces resistance due to overhead supply up to the $38 level. Reported Oct '21 quarterly earnings +81% on +26% sales revenues over the year ago period, its 4th strong quarterly comparison. See the latest FSU analysis for more details and a new annotated graph.
12/29/2021 3:53:11 PM - G - Posting a 6th consecutive gain today with near average volume. Found prompt support near its 50 DMA line ($31.95) but it has not formed a sound base and faces resistance due to overhead supply up to the $38 level. Reported Oct '21 quarterly earnings +81% on +26% sales revenues over the year ago period, its 4th strong quarterly comparison.
12/27/2021 5:22:39 PM - G - Posted a 4th consecutive gain today with higher volume. Found prompt support near its 50 DMA line ($31.69) but it has not formed a sound base and faces resistance due to overhead supply up to the $38 level. Reported Oct '21 quarterly earnings +81% on +26% sales revenues over the year ago period, its 4th strong quarterly comparison.
12/23/2021 5:32:26 PM - G - Prompt rebound above the 50 DMA line ($31.57) helped its outlook improve. Faces resistance due to overhead supply up to the $38 level. Reported Oct '21 quarterly earnings +81% on +26% sales revenues over the year ago period, its 4th strong quarterly comparison.
12/20/2021 12:01:21 PM - G - Gapped down today violating its 50 DMA line ($31.25) with a 3rd consecutive volume-driven loss triggering a technical sell signal. Only a prompt rebound above the 50 DMA line would help its outlook improve. Reported Oct '21 quarterly earnings +81% on +26% sales revenues over the year ago period, its 4th strong quarterly comparison.
12/13/2021 5:23:25 PM - G - Suffered another loss today on higher (near average) volume, still slumping back into the prior base. Reported Oct '21 quarterly earnings +81% on +26% sales revenues over the year ago period, its 4th strong quarterly comparison.
12/10/2021 5:03:51 PM - G - Still showing resilience but gains have lacked great volume after slumping back into the prior base with volume-driven losses. Reported Oct '21 quarterly earnings +81% on +26% sales revenues over the year ago period, its 4th strong quarterly comparison.
12/6/2021 5:39:22 PM - G - Showing resilience but gains have lacked great volume after slumping back into the prior base with volume-driven losses. Reported Oct '21 quarterly earnings +81% on +26% sales revenues over the year ago period, its 4th strong quarterly comparison.
12/2/2021 5:32:47 PM - G - Posted a gain today with lighter volume after slumping below the prior high with 5 consecutive losses marked by above average volume. Reported Oct '21 quarterly earnings +81% on +26% sales revenues over the year ago period, its 4th strong quarterly comparison.
12/1/2021 4:49:49 PM - G - Color code is changed to green after slumping further below the prior high with today's 5th consecutive loss marked by above average volume. Reported Oct '21 quarterly earnings +81% on +26% sales revenues over the year ago period, its 4th strong quarterly comparison.
11/29/2021 1:17:52 PM - Y - Holding its ground today. Pulled back for 2nd consecutive losses after a gain for a new 52-week high clinched a technical buy signal. Highlighted in the 11/23/21 mid-day report in yellow with pivot point cited base on its 6/01/21 high plus 10 cents. Reported Oct '21 quarterly earnings +81% on +26% sales revenues over the year ago period, its 4th strong quarterly comparison. Volume and volatility often increase near earnings news. Following years of losses it has shown strong earnings growth for FY '19-21.
11/26/2021 12:03:41 PM - Y - Pulling back today for a 2nd consecutive volume-driven loss after a gain for a new 52-week high clinched a technical buy signal. Highlighted in the 11/23/21 mid-day report in yellow with pivot point cited base on its 6/01/21 high plus 10 cents. Reported Oct '21 quarterly earnings +81% on +26% sales revenues over the year ago period, its 4th strong quarterly comparison. Volume and volatility often increase near earnings news. Following years of losses it has shown strong earnings growth for FY '19-21.
11/24/2021 1:05:09 PM - Y - Churning above average volume while pulling back today. Prior gain for a new 52-week high clinched a technical buy signal as it finished strong after highlighted in yellow with pivot point cited base on its 6/01/21 high plus 10 cents. Reported Oct '21 quarterly earnings +81% on +26% sales revenues over the year ago period, its 4th strong quarterly comparison. Volume and volatility often increase near earnings news. Following years of losses it has shown strong earnings growth for FY '19-21. See the latest FSU analysis for more details and an annotated graph.
11/23/2021 5:27:30 PM - Y - Finished strong today after highlighted in yellow with pivot point cited base on its 6/01/21 high plus 10 cents in the earlier mid-day report. Reported Oct '21 quarterly earnings +81% over the year ago period, its 4th strong quarterly comparison. Volume and volatility often increase near earnings news. Hit a new 52-week high with today's 2nd consecutive big volume-driven gain clinching a technical buy signal. Following years of losses it has shown strong earnings growth for FY '19-21. See the latest FSU analysis for more details and a new annotated graph.
11/23/2021 12:49:28 PM - Y - Color code is changed to yellow with pivot point cited base on its 6/01/21 high plus 10 cents. Reported Oct '21 quarterly earnings +81% over the year ago period, its 4th strong quarterly comparison. Volume and volatility often increase near earnings news. Hitting a new 52-week high with today's 2nd consecutive big volume-driven gain. A gain and strong close above the pivot point may clinch a technical buy signal. Following years of losses it has shown strong earnings growth for FY '19-21.
11/22/2021 1:05:39 PM - Due to report Oct '21 quarterly results. Volume and volatility often increase near earnings news. Hitting a new 52-week high with today's big volume-driven gain. Found support near its 200 DMA line since noted in the 6/28/21 mid-day report. Reported Jul '21 quarterly earnings +97% on +24% sales revenues versus the year ago period, its 3rd strong quarterly comparison. Prior quarterly results were erratic. Following years of losses it has shown strong earnings growth for FY '19-21.
11/11/2021 1:02:50 PM - Found support near its 200 DMA line since last noted in the 6/28/21 mid-day report. Reported Jul '21 quarterly earnings +97% on +24% sales revenues versus the year ago period, its 3rd strong quarterly comparison. Prior quarterly results were erratic. Following years of losses it has shown strong earnings growth for FY '19-21.
6/28/2021 12:56:34 PM - Encountering some distributional pressure while recently consolidating above prior highs. Posted a couple of big volume-driven gains after reporting Mar '21 quarterly earnings +207% on +20% sales revenues versus the year ago period, its 2nd strong quarterly comparison. Prior quarterly results were erratic. Following years of losses it has shown strong earnings growth for FY '19-21.
6/16/2021 1:14:50 PM - Showed resilience after encountering some distributional pressure while recently perched near its 52-week high. Posted a couple of big volume-driven gains after reporting Mar '21 quarterly earnings +207% on +20% sales revenues versus the year ago period, its 2nd strong quarterly comparison. Prior quarterly results were erratic. Following years of losses it has shown strong earnings growth for FY '19-21.
6/15/2021 12:50:42 PM - Encountered some distributional pressure while recently perched near its 52-week high. Posted a couple of big volume-driven gains after reporting Mar '21 quarterly earnings +207% on +20% sales revenues versus the year ago period, its 2nd strong quarterly comparison. Prior quarterly results were erratic. Following years of losses it has shown strong earnings growth for FY '19-21.
6/3/2021 12:27:08 PM - Encountering some distributional pressure today while perched near its 52-week high. Posted a couple of big volume-driven gains after reporting Mar '21 quarterly earnings +207% on +20% sales revenues versus the year ago period, its 2nd strong quarterly comparison. Prior quarterly results were erratic. Following years of losses it has shown strong earnings growth for FY '19-21.
6/2/2021 12:30:06 PM - Perched at its 52-week high. Posted a couple of big volume-driven gains after reporting Mar '21 quarterly earnings +207% on +20% sales revenues versus the year ago period, its 2nd strong quarterly comparison. Prior quarterly results were erratic. Following years of losses it has shown strong earnings growth for FY '19-21.
6/1/2021 12:51:48 PM - Perched at its 52-week high today. Posted a big volume-driven gain last week after reporting Mar '21 quarterly earnings +207% on +20% sales revenues versus the year ago period, its 2nd strong quarterly comparison. Prior quarterly results were erratic. Following years of losses it has shown strong earnings growth for FY '19-21.
7/13/2012 12:41:11 PM - Rallying back above its 50 DMA line today. Found support at its 200 DMA line during a deep consolidation since last noted at its 52-week high in the 4/16/12 mid-day report - "Reported earnings +47% on +65% sales revenues for the quarter ended January 31, 2012 versus the year ago period. Technically, it broke out from a sound base pattern with a volume-driven gain on 4/09/12. It when through a deep consolidation below its 200 DMA line since completing a new Public Offering on 5/06/11. The 6 most recent quarterly comparisons show improving sales revenues and earnings increases, but its annual earnings history (A criteria) had a downward turn in FY '10, making it fall below the fact-based investment system's fundamental guidelines."
4/16/2012 12:30:42 PM - Pulling back today following 3 consecutive volume-driven gains for new 52-week highs. The 4/11/12 mid-day report noted - "Reported earnings +47% on +65% sales revenues for the quarter ended January 31, 2012 versus the year ago period. Technically, it broke out from a sound base pattern with a volume-driven gain on 4/09/12. It when through a deep consolidation below its 200 DMA line since completing a new Public Offering on 5/06/11. The 6 most recent quarterly comparisons show improving sales revenues and earnings increases, but its annual earnings history (A criteria) had a downward turn in FY '10, making it fall below the fact-based investment system's fundamental guidelines."
4/13/2012 12:53:42 PM - Up today for a 3rd consecutive volume-driven gain and another new 52-week high. The 4/11/12 mid-day report noted - "Reported earnings +47% on +65% sales revenues for the quarter ended January 31, 2012 versus the year ago period. Technically, it broke out from a sound base pattern with a volume-driven gain on 4/09/12. It when through a deep consolidation below its 200 DMA line since completing a new Public Offering on 5/06/11. The 6 most recent quarterly comparisons show improving sales revenues and earnings increases, but its annual earnings history (A criteria) had a downward turn in FY '10, making it fall below the fact-based investment system's fundamental guidelines."
4/12/2012 12:43:43 PM - Today's 2nd consecutive considerable volume-driven gain helped it blast to another new 52-week high. The 4/11/12 mid-day report noted - "Reported earnings +47% on +65% sales revenues for the quarter ended January 31, 2012 versus the year ago period. Technically, it broke out from a sound base pattern with a volume-driven gain on 4/09/12. It when through a deep consolidation below its 200 DMA line since completing a new Public Offering on 5/06/11. The 6 most recent quarterly comparisons show improving sales revenues and earnings increases, but its annual earnings history (A criteria) had a downward turn in FY '10, making it fall below the fact-based investment system's fundamental guidelines."
4/11/2012 12:15:42 PM - Considerable gap up gain today for a new 52-week high. Reported earnings +47% on +65% sales revenues for the quarter ended January 31, 2012 versus the year ago period. Technically, it broke out from a sound base pattern with a volume-driven gain on 4/09/12. It when through a deep consolidation below its 200 DMA line since completing a new Public Offering on 5/06/11. The 6 most recent quarterly comparisons show improving sales revenues and earnings increases, but its annual earnings history (A criteria) had a downward turn in FY '10, making it fall below the fact-based investment system's fundamental guidelines.
6/10/2011 12:23:02 PM - Perched -6.2% off its 52-week high today after a gap up from below its 50 DMA line on the prior session. It completed a new Public Offering on 5/06/11 and had slumped below its 50 DMA line since last noted in the 4/19/11 mid-day report following a breakaway gap. The 3 most recent quarterly comparisons show improving sales revenues and earnings increases, but its prior quarterly and annual earnings history (C and A criteria) is below the fact-based investment system guidelines.
4/19/2011 1:13:01 PM - Perched near its 52-week high today after a "breakaway gap" on the prior session. The 2 most recent quarterly comparisons show improving sales revenues and earnings increases, but its prior quarterly and annual earnings history (C and A criteria) is below the fact-based investment system guidelines.
6/17/2008 1:42:41 PM - Second consecutive gain on heavy volume, now very extended from any sound base. Continuing higher since gapping up on 5/16/08 after a follow-on share offering priced at $20 per share. Strong action helped this agriculture/construction equipment retailer more than triple since its 12/06/07 IPO at $9.00. Impressive earnings and sales increases in recent quarterly comparisons are encouraging.
6/16/2008 1:01:42 PM - Gapped up today, extended from an ideal base or buy point. Continuing higher since gapping up on 5/16/08 after a follow-on share offering priced at $20 per share. Strong action helped this agriculture/construction equipment retailer more than triple since its 12/06/07 IPO at $9.00. Impressive earnings and sales increases in recent quarterly comparisons are encouraging.
5/23/2008 1:15:31 PM - Hovered near all-time highs in the $24-25 area this week, holding recent gap up gains since a 5/16/08 follow-on share offering priced at $20 per share. Strong action helped this agriculture/construction equipment retailer more than double since its 12/06/07 IPO at $9.00. Impressive earnings and sales increases in recent quarterly comparisons are encouraging.
5/19/2008 2:02:54 PM - Gapped up today for another considerable gain with above average volume after pricing its previously announced follow-on offering at $20 per share and gapping up on 5/16/08. Strong action helped this agriculture/construction equipment retailer more than double since its 12/06/07 IPO at $9.00. Questionable fundamental data, yet impressive earnings and sales increases in recent quarterly comparisons are encouraging.
5/16/2008 1:48:39 PM - Gapped up today for a considerable gain with above average volume after pricing its previously announced follow-on offering at $20 per share. Strong action helped this agriculture/construction equipment retailer more than double since its 12/06/07 IPO at $9.00. Questionable fundamental data, yet impressive earnings and sales increases in recent quarterly comparisons are encouraging.
4/22/2008 1:52:28 PM - Pulling back today after considerable gains with above average volume. It is extended after rising from a 6-week base during which it found support at its 50 DMA line. Strong action helped this agriculture/construction equipment retailer more than double since its 12/06/07 IPO at $9.00. This relatively new issue has limited and questionable fundamental data, yet impressive earnings and sales increases in recent quarterly comparisons are encouraging.
4/21/2008 1:39:49 PM - Pulling back after a considerable gain on 4/18/08 with above average volume to new all-time highs. It is extended now, after rising from a 6-week base during which it found support at its 50 DMA line. Strong action helped this agriculture/construction equipment retailer more than double since its 12/06/07 IPO at $9.00. This relatively new issue has limited and questionable fundamental data, yet impressive earnings and sales increases in recent quarterly comparisons are encouraging.
4/18/2008 1:44:53 PM - Considerable gains today with above average volume to new all-time highs. It is extended now, after rising from a 6-week base during which it found support at its 50 DMA line. Strong action helped this agriculture/construction equipment retailer more than double since its 12/06/07 IPO at $9.00. This relatively new issue has limited and questionable fundamental data, yet impressive earnings and sales increases in recent quarterly comparisons are encouraging.
4/9/2008 1:01:48 PM - Gains with volume running at an above average pace have it trading near all-time highs. Since last noted on 2/19/08 it has formed a 6-week base while finding support at its 50 DMA line. Strong action helped this agriculture/construction equipment retailer more than double since its 12/06/07 IPO at $9.00. This relatively new issue has limited and questionable fundamental data, yet impressive earnings and sales increases in recent quarterly comparisons are encouraging.
2/19/2008 1:16:13 PM - It is now well off today's early highs after spiking to a new all-time high with another considerable gain on above average volume. On 2/15/08 it rose from a choppy 5-week base. Questionable group strength, yet it has shown impressive earnings and sales growth. Strong action helped this agriculture/construction equipment retailer more than double since its 12/06/07 IPO at $9.00.
2/15/2008 1:05:01 PM - Blasting to new all-time highs with a considerable gain today on above average volume helping it rise from a choppy 5-week base. Questionable group strength, yet it has shown impressive earnings and sales growth. Strong action helped this agriculture/construction equipment retailer more than double since its 12/06/07 IPO at $9.00.
1/14/2008 12:50:50 PM - Continuing higher today after a gap up gain for new highs on 1/11/08. Impressive earnings and sales growth, but it has a limited trading history. There is no sound base now due to strong action in this agriculture/construction equipment retailer since its 12/06/07 IPO at $9.00.
1/11/2008 1:05:25 PM - Impressive earnings and sales growth, but it has a limited trading history. Gapped up and hit a new high today. Getting extended after strong action in this agriculture/construction equipment retailer since its 12/06/07 IPO at $9.00.