5/14/2012 7:36:14 PM - Slumping under its 50 DMA lineand under prior resistance in the $31 area has not acted as a support level. Only a prompt rebound above its 50 DMA line would help its outlook, but it now faces resistance due to overhead supply up through the $34 level. Based on weak action it will be dropped from the Featured Stocks list tonight.
5/10/2012 11:03:16 AM - G - Slumping under its 50 DMA line, raising concerns. It is trading near prior resistance in the $31 area that may act as a support level, but a prompt rebound above its 50 DMA line is needed for its outlook to improve.
5/3/2012 2:51:58 PM - G - Consolidating well above support at prior highs in the $31 area and its 50 DMA line. It is extended from its prior base.
4/26/2012 4:01:26 PM - G - Up today for a 2nd consecutive gain on lighter volume. Traded under its "max buy" level this week yet found support above prior highs in the $31 area and its 50 DMA line. More damaging losses would raise serious concerns.
4/24/2012 4:06:24 PM - G - Sank near its pivot point and closed near the session low with above average volume behind today's 4th consecutive loss. Raised concerns as it violated the previously noted upward trendline connecting its December, March, and April lows triggering an early sell signal. Important support to watch is at prior highs in the $31 area and its 50 DMA line where more damaging losses would raise serious concerns.
4/23/2012 12:51:40 PM - G - Gapped down today amid widespread market weakness, and it has slumped under the "max buy" level cited. Its 3rd consecutive loss has it now testing the previously noted upward trendline connecting its December, March, and April lows which defines an initial support level to watch above additional support at prior highs in the $31 area and its 50 DMA line.
4/23/2012 11:34:47 AM - G - Gapped down today amid widespread market weakness, and it has slumped under the "max buy" level cited. Now testing the previously noted upward trendline connecting its December, March, and April lows which defines an initial support level to watch above additional support at prior highs in the $31 area and its 50 DMA line.
4/18/2012 1:03:53 PM - G - Up today with volume running at an above average pace while getting further extended from its previous base. Color code was changed to green after rising beyond the cited "max buy" level. An upward trendline connecting its December, March, and April lows defines an initial support level to watch above additional support at prior highs in the $31 area and its 50 DMA line.
4/18/2012 10:16:47 AM - G - Up today with volume running at an above average pace while getting further extended from its previous base. Color code is changed to green after rising beyond the cited "max buy" level. An upward trendline connecting its December, March, and April lows defines an initial support level to watch above additional support at prior highs in the $31 area and its 50 DMA line.
4/17/2012 12:46:03 PM - Y - Hovering near its "max buy" level after trading to new 52-week highs last week. Recent low ($30.03 on 4/02/12) and its 50 DMA line coincide and define a very important support level to watch on pullbacks.
4/16/2012 5:42:36 PM - Y - Perched near its "max buy" level after trading to new 52-week highs last week. A recent low ($30.03 on 4/02/12) and its 50 DMA line nearly coincide, defining an important support level to watch on pullbacks.
4/10/2012 6:26:44 PM - Y - Volume was higher and slightly above average behind today's loss and close below its "max buy" level after trading near its 52-week high. Color code is changed to yellow, however more damaging losses may raise greater concerns. Recent low ($30.03 on 4/02/12) defines a near-term support level to watch above its 50 DMA line.
4/5/2012 4:49:02 PM - G - Volume was above average behind today's 3rd gain in the span of 4 sessions and it finished above its "max buy" level after hitting another new 52-week high. Color code is changed to green after getting extended from its prior base. Recent low ($30.03 on 4/02/12) defines a near-term support level to watch above its 50 DMA line. See the latest FSU analysis for more details and a new annotated daily graph.
4/5/2012 1:18:31 PM - Y - Volume is above average behind today's 3rd gain in the span of 4 sessions and it briefly traded above its "max buy" level and hit another new 52-week high. Its recent low ($30.03 on 4/02/12) defines a near-term support level to watch above its 50 DMA line.
4/2/2012 5:47:02 PM - Y - Volume was 2 times average behind today's gain. Reported earnings +25% on +22% sales revenues for the quarter ended February 29, 2012 versus they year ago period. It was featured again in yellow in the 3/30/12 mid-day report with the graph below included while noted - "Fundamentals remain strong concerning the C and A criteria."
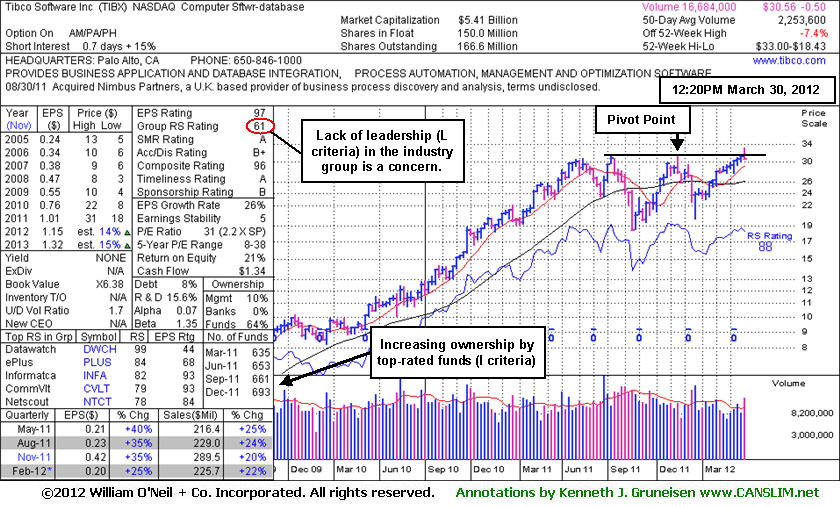
3/30/2012 12:28:35 PM - Y - Color code is changed to yellow with pivot point cited based on its 11/16/11 high plus 10 cents. Technically, its volume-driven gain on the prior session triggered a buy signal. Touched a new 52-week high today then reversed into the red. Reported earnings +25% on +22% sales revenues for the quarter ended February 29, 2012 versus they year ago period. Volume and volatility often increase near earnings news. Recently rebounded after another deep consolidation below its 200 DMA line since last noted in the 11/14/11 mid-day report - "Dropped from the Featured Stocks list on 6/13/11. Fundamentals remain strong concerning the C and A criteria."
11/14/2011 1:42:01 PM - Approaching prior highs in the $31 area and its 52-week high after a deep consolidation below its 200 DMA line since dropped from the Featured Stocks list on 6/13/11. Fundamentals remain strong concerning the C and A criteria. It did not form a sound base pattern, yet no resistance remains due to overhead supply.
6/13/2011 6:05:34 PM - Down further today on slightly higher volume, slumping under its February-March highs leading to even more technical damage. Based on weak action it will be dropped from the Featured Stocks list tonight.
6/6/2011 6:35:10 PM - G - Down further today on light volume, closing near the session low. Serious concerns were raised last week after it technically triggered sell signals with losses and slumped below its 50 DMA line. Overhead supply up through the $30 area may now act as resistance.
6/3/2011 3:46:24 PM - G - Gapped down today and serious concerns were raised this week after it technically triggered sell signals with losses and slumped below its 50 DMA line. Overhead supply may act as resistance.
6/1/2011 5:20:22 PM - G - Today marked its lowest close since its 4/12/11 gap up gain on high volume, erasing all progress it made and leaving it now with 7-weeks worth of overhead supply to act as resistance. More damaging losses may raise serious concerns after it technically triggered sell signals with losses and slumped further below its 50 DMA line.
5/31/2011 7:16:20 PM - G - Down today for a small loss with very heavy volume, closing just below its 50 DMA line. The recent low ($27.17) defines important chart support where any more damaging losses may trigger technical sell signals.
5/26/2011 3:05:24 PM - G - Up today with light volume, positively reversing after starting the session with a small gap down just below its 50 DMA line and dipping near the recent low ($27.17). More damaging violations may trigger technical sell signals.
5/23/2011 3:48:09 PM - G - Gapped down today, consolidating just above its 50 DMA line and recent low ($27.17). Violations may trigger technical sell signals.
5/20/2011 3:28:37 PM - G - After a small gap down today it has managed a positive reversal. It is consolidating above its 50 DMA line, extended from a sound base pattern. Technically, that short-term average and recent low ($27.17) mark important chart support levels to watch where violations may trigger sell signals.
5/18/2011 6:43:06 PM - G - Volume totals have been cooling while consolidating above its 50 DMA line, extended from a sound base pattern. Technically, that short-term average and recent low ($27.17) mark important chart support levels to watch where violations may trigger sell signals. See the latest FSU analysis for details and a new annotated graph.
5/16/2011 3:44:14 PM - G - Volume totals have been cooling while consolidating above its 50 DMA line, extended from a sound base pattern. Technically, that short-term average and recent low ($27.17) mark important chart support levels to watch where violations may trigger sell signals.
5/13/2011 4:41:33 PM - G - Quietly holding its ground perched near its all-time high, technically extended from a sound base pattern. Its 50 DMA line and recent low ($27.17) define important chart support to watch where violations may trigger sell signals.
5/11/2011 6:14:16 PM - G - Perched near its all-time high, technically extended from a sound base pattern. Its 50 DMA line and recent low ($27.17) define important chart support to watch where violations may trigger sell signals.
5/10/2011 4:38:51 PM - G - Up today on near average volume for a new all-time high, technically getting more extended from a sound base pattern. Its 50 DMA line and recent chart low ($27.17) define important chart support to watch where violations may trigger sell signals.
5/9/2011 12:28:15 PM - G - Gain today has it challenging its all-time high after last week's streak of mild distributional losses. Prior highs and its 50 DMA line define important chart support near the $26 level.
5/6/2011 1:31:33 PM - G - Gapped up today after pulling back from its all-time high with 4 consecutive losses. Prior highs and its 50 DMA line define important chart support near the $26 level.
5/4/2011 1:47:47 PM - G - Pulling back from its all-time high today with a 3rd consecutive loss. Prior highs and its 50 DMA line define chart support near the $26 level.
5/3/2011 6:52:55 PM - G - Pulling back from its all-time high today with a small loss on slightly above average volume. Repeatedly noted as extended from any sound base, meanwhile prior highs and its 50 DMA line define chart support near the $26 level.
4/27/2011 5:16:43 PM - G - Quietly holding its ground near its all-time high, extended from any sound base after a spurt of volume-driven gains. As previously noted, support is defined by prior highs in the $25-26 area and its 50 DMA line.
4/20/2011 5:03:45 PM - G - Small gap up gain today with below average volume for its second best close. It is extended from a sound base after a spurt of volume-driven gains. As previously noted, support is defined by prior highs in the $25-26 area and its 50 DMA line.
4/18/2011 11:11:46 AM - G - Small gap down today amid widespread market weakness. It is extended from a sound base after a spurt of volume-driven gains. As previously noted, support is defined by prior highs in the $25-26 area and its 50 DMA line. See the latest FSU analysis for more details and a new annotated graph.
4/14/2011 6:42:08 PM - G - Finished near the session high for a best-ever close today, getting more extended from a sound base after a spurt of volume-driven gains. Support is defined by prior highs in the $25-26 area and its 50 DMA line. See the latest FSU analysis for more details and a new annotated graph.
4/13/2011 1:15:19 PM - G - Gapped up again today, getting extended from a sound base following a 4/12/11 gap up and gain with heavy volume for a new 52-week high. Found support above prior highs in the $25-26 area during its recent consolidation.
4/12/2011 1:41:00 PM - G - Off earlier highs after a gap up today for a new 52-week high. Found support above prior highs in the $25-26 area during its consolidation. Color code was changed to green again after getting extended from a sound base.
4/12/2011 9:45:08 AM - G - Gapped up today and hit a new 52-week high. Found support above prior highs in the $25-26 area during its consolidation. Color code is changed to green again after getting extended from a sound base.
4/8/2011 6:40:36 PM - Y - Down for small losses on light or average volume 5 sessions in a row. Color code was changed to yellow after pulling back just under its "max buy" level. Consolidating above prior highs in the $25-26 area defining support to watch on pullbacks.
4/7/2011 3:43:54 PM - Y - Color code is changed to yellow after pulling back just under its "max buy" level. Volume totals have been cooling while it has been consolidating in a tight range, stubbornly holding its ground after a spurt of volume-driven gains. Prior highs in the $25-26 area define support to watch on pullbacks.
4/4/2011 4:14:26 PM - G - Inched higher today with light volume for a 5th consecutive gain and a new high close. Extended from its prior base after a spurt of gains last week with above average volume, its color code was changed to green. Prior highs in the $25-26 area define support to watch on pullbacks.
4/1/2011 11:14:35 AM - G - Gapped up today, hitting another new 52-week high. Extended from its prior base after a spurt of gains this week with above average volume, its color code is changed to green. Prior highs in the $25-26 area define support to watch on pullbacks.
3/31/2011 4:06:44 PM - Y - Gains this week with above average volume have it rising to new 52-week highs making gradual progress toward its "max buy" level. It is free of all resistance due to overhead supply.
3/30/2011 1:21:38 PM - Y - Its gain on the prior session with above average volume could be considered a technical buy signal. However, the churning above average volume at its 52-week high this week while not making meaningful price progress suggests that it has been enduring distributional pressure since rising clear of all resistance due to overhead supply.
3/29/2011 1:49:48 PM - Y - Touched a new 52-week high today. It is clear of all resistance due to overhead supply. A convincing gain and close above its pivot point with at least the minimum above average volume may trigger a proper technical buy signal. The M criteria remains a concern for disciplined investors, but stronger leadership (stocks hitting new 52 week highs) has recently been a reassuring sign.
3/28/2011 3:42:01 PM - Y - Holding its ground near its 52-week high, clear of all resistance, however volume as it rallied above its pivot point last week did not meet the minimum guideline to trigger a proper technical buy signal. The M criteria also remains an overriding concern for disciplined investors until the rally attempt is confirmed with a follow-through day from at least one of the major averages.
3/24/2011 11:36:16 AM - Y - Gapped up today and rallied to a new 52-week high, clear of all resistance. Volume is running at an above average pace while it has risen above its pivot point, and a strong close with at least +50% above average volume may trigger a technical buy signal. However, the M criteria remains an overriding concern for disciplined investors until the rally attempt is confirmed with a follow-through day from at least one of the major averages.
3/23/2011 7:10:14 PM - Y - Posted a 4th consecutive small gain today, closing perched -4.4% off its 52-week high. Currently consolidating above support at its 50 DMA line and recent chart lows defining support above its old resistance area.
3/21/2011 1:41:13 PM - Y - Small gap up today. Color code was changed to yellow with new pivot point cited based on its 52-week high plus ten cents. Currently consolidating above support at its 50 DMA line and recent chart lows defining support above its old resistance area. More damaging losses would raise concerns and trigger more worrisome technical sell signals.
3/18/2011 6:17:13 PM - Y - Color code is changed to yellow with new pivot point cited based on its 52-week high plus ten cents. Currently consolidating above support at its 50 DMA line and recent chart lows defining support above its old resistance area. More damaging losses would raise concerns and trigger more worrisome technical sell signals. See the latest FSU analysis for more details and a new annotated graph.
3/15/2011 10:30:13 AM - G - Down today, testing support at its 50 DMA line and matching its recent chart low ($22.87) earlier in the session. More damaging losses would raise concerns and trigger more worrisome technical sell signals.
3/10/2011 4:02:40 PM - G - Down today on average volume, finishing -7.8% off its 52-week high. Recently found support above prior highs in the $22 area and well above its 50 DMA line.
3/8/2011 5:06:56 PM - G - Up today on lighter volume, finishing -5.2% off its 52-week high. Recently found support above prior highs in the $22 area and well above its 50 DMA line.
3/7/2011 5:30:27 PM - G - Pulling back today with below average volume, finishing -7.1% off its 52-week high. Recently found support above prior highs in the $22 area and well above its 50 DMA line.
3/3/2011 11:13:15 AM - G - Gapped up today, rallying near its 52-week high. Found support above prior highs in the $22 area and well above its 50 DMA line.
2/28/2011 6:45:28 PM - G - Consolidating -5.1% off its 52-week high today. Found support amid widespread market weakness last week well above prior highs in the $22 area defining support along with its 50 DMA line.
2/24/2011 6:13:29 PM - G - Up today with above average volume heavier than the 2 prior losing sessions. Consolidating above prior highs in the $22 area defining support along with its 50 DMA line.
2/23/2011 4:24:36 PM - G - Down on average volume today following a gap down on the prior session amid widespread market weakness, pulling back on higher volume after recently wedging up to new 52-week highs with gains on lighter volume. Prior highs in the $22 area define support along with its 50 DMA line.
2/22/2011 2:23:39 PM - G - Gapped down today amid widespread market weakness, pulling back on higher volume after recently wedging up to new 52-week highs with gains on lighter volume. Extended from its latest sound base, its prior highs in the $22 area define support.
2/18/2011 5:43:06 PM - G - Perched near its 52-week high after wedging higher with gains on lighter volume. Extended from its latest sound base, its prior highs in the $22 area define support.
2/14/2011 2:46:09 PM - G - Inched to another new 52-week high today with a gain on lighter volume. Extended from its latest sound base, its prior highs in the $22 area define support. See the latest FSU analysis for details and a new annotated graph.
2/10/2011 6:43:14 PM - G - Hit another new 52-week high today with a gain on light volume. Extended from its latest sound base, its prior highs in the $22 area define support. See the latest FSU analysis for details and a new annotated graph.
2/4/2011 5:02:14 PM - G - Small gain today for a new 52-week high with light volume. Rose from an orderly flat base this week and quickly got extended from its "late-stage" or riskier base. Color code is changed to green, meanwhile disciplined investors may watch for light volume pullbacks toward prior resistance. Previously noted its streak of 4 quarterly comparisons with +25% earnings (good C criteria) increases with good sales revenues growth. It also has a good annual earnings (A criteria) history, and leadership (L criteria) in the Computer Software - Database group is reassuring.
2/1/2011 2:08:15 PM - Y - Spiked to a new 52-week high today with heavy volume behind its considerable gain while rising from an orderly flat base. Color code is changed to yellow but it has quickly gotten extended from what may be considered a "late-stage" or riskier base. Previously noted its streak of 4 quarterly comparisons with +25% earnings (good C criteria) increases with good sales revenues growth. It also has a good annual earnings (A criteria) history, and leadership (L criteria) in the Computer Software - Database group is reassuring.
12/22/2010 1:28:31 PM - Hit a new 52-week high today and then reversed into the red while trading heavy volume following its report of earnings +35% on +23% sales revenues for the quarter ended November 30, 2010. It now has a streak of 4 quarterly comparisons with +25% earnings (good C criteria) increases with good sales revenues growth. It also has a good annual earnings (A criteria) history, and leadership (L criteria) in the Computer Software - Database group is reassuring. In recent months it wedged into new high territory without great volume conviction and it did not form a sound new base pattern, yet found support above its 50 DMA line since last noted on 9/28/10 following its considerable 9/24/10 gap up gain when it was noted - "Patient investors may watch for a sound base to form and offer ideal secondary buy points."
9/28/2010 1:26:19 PM - Holding its ground since a considerable 9/24/10 gap up gain for a new 52-week high. Noted in recent mid-day reports - "After its latest earnings report it has a streak of 3 quarterly comparisons with +25% earnings increases with accelerating sales revenues growth. It also has a good annual earnings (A criteria) history. It is extended from the 5-week flat base it cleared when noted in the 8/31/10 mid-day report. Leadership (L criteria) in the Computer Software - Database group is reassuring. Patient investors may watch for a sound base to form and offer ideal secondary buy points."
9/27/2010 1:10:14 PM - Pulling back slightly today after a considerable gap up gain for a new 52-week high on the prior session. Noted in the 9/24/10 mid-day report - "After its latest earnings report it has a streak of 3 quarterly comparisons with +25% earnings increases with accelerating sales revenues growth. It also has a good annual earnings (A criteria) history. It is extended from the 5-week flat base it cleared when noted in the 8/31/10 mid-day report. Leadership (L criteria) in the Computer Software - Database group is reassuring. Patient investors may watch for a sound base to form and offer ideal secondary buy points."
9/24/2010 1:04:43 PM - Gapped up today for a new 52-week high, and after its latest earnings report it has a streak of 3 quarterly comparisons with +25% earnings increases with accelerating sales revenues growth. It also has a good annual earnings (A criteria) history. It is extended from the 5-week flat base it cleared when noted in the 8/31/10 mid-day report. Leadership (L criteria) in the Computer Software - Database group is reassuring. Patient investors may watch for a sound base to form and offer ideal secondary buy points.
9/22/2010 1:51:15 PM - Pulling back today from a new 52-week high on the prior session. It is extended from the 5-week flat base it cleared when last noted in the 8/31/10 mid-day report. Leadership (L criteria) in the Computer Software - Database group is reassuring. The 2 most recent quarterly comparisons have featured better than +25% earnings increases with accelerating sales revenues growth, and it also has a good annual earnings (A criteria) history.
8/31/2010 12:44:20 PM - Hit a new 52-week high today after a 5-week flat base above its 50 DMA line. Leadership (L criteria) in the Computer Software - Database group is a reassuring sign. The 2 most recent quarterly comparisons have featured better than +25% earnings increases with accelerating sales revenues growth, and it also has a good annual earnings (A criteria) history.
8/23/2010 1:21:03 PM - Consolidating above its 50 DMA line within -4% of its 52-week high. The 2 most recent quarterly comparisons have featured better than +25% earnings increases with accelerating sales revenues growth, and it also has a good annual earnings (A criteria) history.
6/25/2010 12:39:37 PM - Gapped up today following strong earnings news, posting a considerable gain with above average volume for a new 52-week high. Technically, its rally from a 7-week base leaves it clear of resistance due to overhead supply. The 2 most recent quarterly comparisons have featured better than +25% earnings increases with accelerating sales revenues growth, and it also has a good annual earnings (A criteria) history.
5/14/2010 1:04:54 PM - Pulling back today from its 52-week high after 5 consecutive gains including a couple of sessions backed by above average volume. Found recent support near its 50 DMA line, and it is clear of resistance due to overhead supply. It has a good annual earnings (A criteria) history. Recent quarterly comparisons have not featured better than +25% earnings and sales revenues increases.
5/13/2010 1:13:36 PM - Hit a new 52-week high today with a 5th consecutive gain backed by above average volume helping it rally from support near its 50 DMA line. It has a good annual earnings (A criteria) history. Recent quarterly comparisons have not featured better than +25% earnings and sales revenues increases.
8/11/2009 1:57:09 PM - Pulling back today following a big gap up gain on 8/10/09 with heavy volume, approaching multi-year highs. It has a good annual earnings history and recent quarters have featured better than +25% earnings increases. Concerns remain because it reported no growth or lower sales revenues than the year ago period levels in the 3 latest quarterly comparisons. Street estimates for FY '09 & '10 are calling for only +6% and +10% growth.
8/10/2009 1:56:27 PM - Gapped up today, rallying toward multi-year highs. It has a good annual earnings history and recent quarters have featured better than +25% earnings increases. Concerns remain due to it sales revenues at or lower than the year ago period levels in the 3 latest quarterly comparisons, meanwhile Street estimates form FY '09 & '10 are for only +6% and +10% growth.
12/7/2006 12:51:29 PM - "C" and sales history below guidelines and base questionable.
10/18/2006 1:09:51 PM - "C" and sales history below guidelines and base questionable.
10/16/2006 12:40:42 PM - "C" and sales history below guidelines.
9/20/2006 12:46:33 PM - "C" and sales history below guidelines.
1/3/2005 1:02:14 PM - Strong "C." Too ET from a sound base of support at this point to be considered buyable under the guidelines.
12/29/2004 12:48:05 PM - Strong "C." Too ET from a sound base of support at this point to be considered buyable under the guidelines.
12/28/2004 1:06:00 PM - Strong "C." Too ET from a sound base of support at this point to be considered buyable under the guidelines.
12/27/2004 12:34:49 PM - Group poor. Low priced. Strong "C"
12/23/2004 12:49:06 PM - Group poor. Low priced. Strong "C"
12/13/2004 1:00:38 PM - Group poor. Low priced.
11/3/2004 1:04:45 PM - Group poor. Low priced.
10/19/2004 1:00:00 PM - Group poor. Low priced.