2/2/2024 1:37:03 PM - Gapped down today violating its 50 DMA line ($223.66) triggering a technical sell signal. Reported strong results for the Mar, Jun, Sep, and Dec '23 quarters versus the year-ago periods. Annual earnings history has been strong.
10/16/2023 12:48:53 PM - Consolidating near its 50 DMA line ($197). Reported improved results for the Mar and Jun '23 quarters versus the year-ago periods but fundamental concerns remain. Went through a deep consolidation since 3/03/21 when it was dropped from the Featured Stocks list.
10/13/2023 12:49:42 PM - Gapped down on the prior session violating its 50 DMA line ($197). Reported improved results for the Mar and Jun '23 quarters versus the year-ago periods but fundamental concerns remain. Went through a deep consolidation since 3/03/21 when it was dropped from the Featured Stocks list.
10/12/2023 12:47:54 PM - Gapped down today violating its 50 DMA line ($197). Reported improved results for the Mar and Jun '23 quarters versus the year-ago periods but fundamental concerns remain. Went through a deep consolidation since 3/03/21 when it was dropped from the Featured Stocks list.
10/29/2021 1:14:18 PM - Gapped up today hitting a new all-time high, getting extended from any sound base. Fundamental concerns remain. Reported Sep '21 quarterly earnings +53% on +34% sales revenues versus the year ago period. Prior quarterly comparisons were not strong and steady above the +25% minimum earnings guideline (C criteria). It showed resilience and impressive strength since noted on 3/03/21 when it was dropped from the Featured Stocks list.
9/21/2021 12:53:07 PM - Perched at its all-time high, extended from any sound base. Fundamental concerns remain after it reported Jun '21 quarterly earnings -4% on +30% sales revenues versus the year ago period. Prior quarterly comparisons were not strong and steady above the +25% minimum earnings guideline (C criteria). It showed resilience and impressive strength since noted on 3/03/21 when it was dropped from the Featured Stocks list.
9/17/2021 1:14:24 PM - Perched at its all-time high, extended from any sound base. Fundamental concerns remain after it reported Jun '21 quarterly earnings -4% on +30% sales revenues versus the year ago period. Prior quarterly comparisons were not strong and steady above the +25% minimum earnings guideline (C criteria). It showed resilience and impressive strength since last noted on 3/03/21 when it was dropped from the Featured Stocks list.
3/3/2021 4:57:24 PM - Violated its 50 DMA line ($238) decisively with today's big loss backed by above average volume triggering a technical sell signal. The recent low ($208.62 on 1/27/21) defines the next important near-term support to watch. Relative Strength Rating has slumped to 53, below the +80 minimum guideline for buy candidates. Fundamental concerns were noted as the 2 latest quarterly comparisons were below the +25% minimum earnings guideline (C criteria). It will be dropped from the Featured Stocks list tonight.
3/1/2021 5:33:53 PM - G - Rebounded above its 50 DMA line ($238) with today's big gain backed by average volume. The recent low ($208.62 on 1/27/21) defines the next important near-term support to watch. Still, its current Relative Strength Rating is 65, below the +80 minimum guideline for buy candidates. Fundamental concerns remain after earnings rose +0% on +23% sales revenues for the Dec '20 quarter versus the year ago period, its 2nd comparison below the +25% minimum earnings guideline (C criteria).
2/25/2021 5:36:36 PM - G - Violated its 50 DMA line ($238) with today's big loss on below average volume. The recent low ($208.62 on 1/27/21) defines the next important near-term support to watch. Its current Relative Strength Rating is 61, below the +80 minimum guideline for buy candidates. Fundamental concerns remain after earnings rose +0% on +23% sales revenues for the Dec '20 quarter versus the year ago period, its 2nd comparison below the +25% minimum earnings guideline (C criteria).
2/23/2021 1:24:48 PM - G - Abruptly retreating from its all-time high with today's 2nd consecutive big loss on higher volume while undercutting 50 DMA line ($237.89). The recent low ($208.62 on 1/27/21) defines the next important near-term support to watch. Its current Relative Strength Rating is 65, below the +80 minimum guideline for buy candidates. Fundamental concerns remain after earnings rose +0% on +23% sales revenues for the Dec '20 quarter versus the year ago period, its 2nd comparison below the +25% minimum earnings guideline (C criteria).
2/22/2021 6:31:49 PM - G - Abruptly retreated from its all-time high with today's big loss undercutting the prior high ($250). Its 50 DMA line ($237.65) and recent low ($208.62 on 1/27/21) define important near-term support to watch. Its current Relative Strength Rating is 65, below the +80 minimum guideline for buy candidates. Fundamental concerns remain after earnings rose +0% on +23% sales revenues for the Dec '20 quarter versus the year ago period, its 2nd comparison below the +25% minimum earnings guideline (C criteria).
2/16/2021 5:54:47 PM - G - Quietly hovering at its all-time high. Rebounded impressively from a brief dip below its 50 DMA line ($235.70). Recent low ($208.62 on 1/27/21) defines important near-term support to watch. Its current Relative Strength Rating is 70, below the +80 minimum guideline for buy candidates. Fundamental concerns remain after earnings rose +0% on +23% sales revenues for the Dec '20 quarter versus the year ago period, its 2nd comparison below the +25% minimum earnings guideline (C criteria).
2/8/2021 5:17:07 PM - G - Quietly touched a new high today. Rebounded impressively from a brief dip below its 50 DMA line ($232.94). Recent low ($208.62 on 1/27/21) defines important near-term support to watch. Its current Relative Strength Rating is 72, below the +80 minimum guideline for buy candidates. Fundamental concerns remain after earnings rose +0% on +23% sales revenues for the Dec '20 quarter versus the year ago period, its 2nd comparison below the +25% minimum earnings guideline (C criteria). See the latest FSU analysis for more details and a new annotated graph.
2/5/2021 5:18:51 PM - G - Recently rebounded from below its 50 DMA line ($232) to challenge its 52-week high. Recent low ($208.62 on 1/27/21) defines important near-term support to watch. Its current Relative Strength Rating is 69, below the +80 minimum guideline for buy candidates. Earnings rose +0% on +23% sales revenues for the Dec '20 quarter versus the year ago period, its 2nd comparison below the +25% minimum earnings guideline (C criteria), raising fundamental concerns.
1/29/2021 12:50:46 PM - G - Sputtering below its 50 DMA line ($228) which acted as resistance after a violation raised concerns. Recent low ($208.62 on 1/27/21) defines important near-term support to watch. Its current Relative Strength Rating is 62, below the +80 minimum guideline for buy candidates. Earnings rose +7% on +26% sales revenues for the Sep '20 quarter versus the year ago period, below the +25% minimum earnings guideline (C criteria), raising fundamental concerns.
1/26/2021 6:05:25 PM - G - Volume was higher (near average) behind today's big loss as it slumped to close below its 50 DMA line ($226) raising concerns. Prior high in the $216 area defines the next important near-term support to watch. However, its current Relative Strength Rating is 59, below the +80 minimum guideline for buy candidates. Earnings rose +7% on +26% sales revenues for the Sep '20 quarter versus the year ago period, below the +25% minimum earnings guideline (C criteria), raising fundamental concerns.
1/19/2021 5:10:36 PM - G - Found support today while consolidating above its 50 DMA line ($222) and above the prior high in the $216 area which defines important near-term support to watch. However, its current Relative Strength Rating is 64, below the +80 minimum guideline for buy candidates. Earnings rose +7% on +26% sales revenues for the Sep '20 quarter versus the year ago period, below the +25% minimum earnings guideline (C criteria), raising fundamental concerns.
1/11/2021 5:52:39 PM - G - Consolidating above its 50 DMA line ($218.81) and prior high in the $216 area which define important near-term support to watch. Its current Relative Strength Rating is 75, below the +80 minimum guideline for buy candidates. Earnings rose +7% on +26% sales revenues for the Sep '20 quarter versus the year ago period, below the +25% minimum earnings guideline (C criteria), raising concerns. See the latest FSU analysis for more details and a new annotated graph.
1/6/2021 6:08:50 PM - G - Its 50 DMA line ($217) and prior high in the $216 area define important near-term support to watch. Its Relative Strength Rating has slumped to 71, below the +80 minimum guideline for buy candidates. Earnings rose +7% on +26% sales revenues for the Sep '20 quarter versus the year ago period, below the +25% minimum earnings guideline (C criteria), raising concerns.
1/5/2021 5:29:16 PM - G - Extended from any sound base, still consolidating well above its prior high and above its 50 DMA line which coincide defining important near-term support in the $216 area. Showed resilience and strength after earnings rose +7% on +26% sales revenues for the Sep '20 quarter versus the year ago period, below the +25% minimum earnings guideline (C criteria), raising concerns.
12/29/2020 5:12:44 PM - G - Extended from any sound base, consolidating above its prior high and 50 DMA line which define near-term support in the $115-116 area. Showed resilience and strength after earnings rose +7% on +26% sales revenues for the Sep '20 quarter versus the year ago period, below the +25% minimum earnings guideline (C criteria), raising concerns.
12/22/2020 5:15:48 PM - G - Volume totals cooled while stubbornly holding its ground perched at its 52-week high. Showed resilience and strength after earnings rose +7% on +26% sales revenues for the Sep '20 quarter versus the year ago period, below the +25% minimum earnings guideline (C criteria), raising concerns.
12/18/2020 5:11:51 PM - G - Extended from any sound base, it paused today after 6 consecutive gains for new 52-week highs. Showed resilience and strength after earnings rose +7% on +26% sales revenues for the Sep '20 quarter versus the year ago period, below the +25% minimum earnings guideline (C criteria), raising concerns. See the latest FSU analysis for more details and a new annotated graph.
12/16/2020 12:59:53 PM - G - Extended from any sound base, posting a 5th consecutive gain today for yet another new 52-week high. Reported earnings +7% on +26% sales revenues for the Sep '20 quarter versus the year ago period, well below the +25% minimum earnings guideline (C criteria), raising concerns.
12/11/2020 5:02:22 PM - G - Extended from any sound base, it posted another gain with below average volume today for a best-ever close. Reported earnings +7% on +26% sales revenues for the Sep '20 quarter versus the year ago period, well below the +25% minimum earnings guideline (C criteria), raising concerns.
12/8/2020 7:18:33 PM - G - Extended from any sound base, it posted another gain with below average volume today for a new all-time high and best-ever close. Reported earnings +7% on +26% sales revenues for the Sep '20 quarter versus the year ago period, well below the +25% minimum earnings guideline (C criteria), raising concerns.
12/2/2020 6:01:07 PM - G - Posted a gain with below average volume today for a new best-ever close. Found prompt support after undercutting the prior low ($180) but it has not formed a sound new base of sufficient length. Reported earnings +7% on +26% sales revenues for the Sep '20 quarter versus the year ago period, well below the +25% minimum earnings guideline (C criteria), raising concerns.
11/27/2020 2:24:51 PM - G - Hit a new all-time high with light volume behind today's 6th consecutive gain.. Found prompt support after undercutting the prior low ($180) but it has not formed a sound new base of sufficient length. Reported earnings +7% on +26% sales revenues for the Sep '20 quarter versus the year ago period, well below the +25% minimum earnings guideline (C criteria), raising concerns. See the latest FSU analysis for more details and a new annotated graph.
11/19/2020 1:16:56 PM - G - Consolidating above its 50 DMA line ($190) in recent weeks, perched not far off its all-time high. Found prompt support after undercutting the prior low ($180) but it has not formed a sound new base of sufficient length. Reported earnings +7% on +26% sales revenues for the Sep '20 quarter versus the year ago period, well below the +25% minimum earnings guideline (C criteria), raising concerns.
11/18/2020 12:45:58 PM - G - Consolidating above its 50 DMA line ($189.79), it recently found prompt support after undercutting the prior low ($180). Reported earnings +7% on +26% sales revenues for the Sep '20 quarter versus the year ago period, well below the +25% minimum earnings guideline (C criteria), raising concerns.
11/17/2020 6:26:57 PM - G - Consolidating above its 50 DMA line ($189), it recently found prompt support after undercutting the prior low ($180). Reported earnings +7% on +26% sales revenues for the Sep '20 quarter versus the year ago period, well below the +25% minimum earnings guideline (C criteria), raising concerns.
11/11/2020 5:54:54 PM - G - Rebounded back above its 50 DMA line ($188) with today's gain on average volume after undercutting the prior low ($180) and finding prompt support. Reported earnings +7% on +26% sales revenues for the Sep '20 quarter versus the year ago period, well below the +25% minimum earnings guideline (C criteria), raising concerns.
11/9/2020 5:42:50 PM - G - Slumped back below its 50 DMA line ($188) raising concerns with today's loss and the prior low ($180) defines the next important support level. Reported earnings +7% on +26% sales revenues for the Sep '20 quarter versus the year ago period, well below the +25% minimum earnings guideline (C criteria), raising concerns.
11/5/2020 5:47:21 PM - G - Gapped up for a 2nd consecutive session today, rebounding well above its 50 DMA line ($188) and finding prompt support after damaging losses on higher volume triggered a technical sell signal. Reported earnings +7% on +26% sales revenues for the Sep '20 quarter versus the year ago period, well below the +25% minimum earnings guideline (C criteria), raising concerns.
11/4/2020 5:20:38 PM - G - Gapped up today and rebounded above its 50 DMA line ($188) finding support after damaging losses on higher volume triggered a technical sell signal. Reported earnings +7% on +26% sales revenues for the Sep '20 quarter versus the year ago period, well below the +25% minimum earnings guideline (C criteria), raising concerns.
11/2/2020 5:33:58 PM - G - Weak action negated the prior breakout and violated its 50 DMA line ($187.43) triggering a technical sell signal. Reported earnings +7% on +26% sales revenues for the Sep '20 quarter versus the year ago period, well below the +25% minimum earnings guideline (C criteria), raising concerns. See the latest FSU analysis for more details and a new annotated graph.
11/2/2020 12:55:28 PM - G - Gapped down on the prior session slumping into the prior base and today's loss has undercut its 50 DMA line ($187) raising greater concerns. Weak action came after it reported earnings +7% on +26% sales revenues for the Sep '20 quarter versus the year ago period, well below the +25% minimum earnings guideline (C criteria), raising concerns.
10/30/2020 1:01:42 PM - G - Gapped down today and slumped below its pivot point testing its 50 DMA line ($187). Weak action came after it reported earnings +7% on +26% sales revenues for the Sep '20 quarter versus the year ago period, well below the +25% minimum earnings guideline (C criteria), raising concerns.
10/27/2020 7:28:58 PM - G - Posted a gain today with light volume for its best-ever close and its color code is changed to green after rising back above its "max buy" level. Prior highs in the $199 area define initial support to watch above its 50 DMA line.
10/22/2020 12:20:02 PM - Y - Color code is changed to yellow while pulling back from its 52-week highs and below its "max buy" level. Prior highs in the $199 area define initial support to watch above its 50 DMA line.
10/19/2020 12:48:35 PM - G - Powering to new 52-week highs with today's 2nd consecutive volume-driven gain. Color code is changed to green after quickly getting extended more than +5% above the prior high. Disciplined investors avoid chasing extended stocks. Its big gain above the pivot point on the prior session was backed +226% above average volume triggering a new technical buy signal. Its Relative Strength Rating has improved to 89.
10/16/2020 12:32:45 PM - Y - Challenged its 52-week high and pivot point with today's early gain following 4 consecutive losses marked by higher volume. Highlighted again in yellow in the 10/12/20 mid-day report with a new pivot point cited based on its 9/01/20 high plus 10 cents. Subsequent gains above the pivot point backed by at least +40% above average volume may trigger a new technical buy signal. Its Relative Strength Rating has improved to 84, above the 80+ minimum guideline for buy candidates. Three of the past 4 quarterly comparisons through Jun '20 were at or above the +25% minimum earnings guideline (C criteria). It was dropped from the Featured Stocks list on 8/07/20 and found support well above its 200 DMA line during recent consolidations.
10/12/2020 5:37:29 PM - Y - Highlighted in yellow with new pivot point cited based on its 9/01/20 high plus 10 cents. Pulled back today with higher volume. It was perched within close striking distance of its 52-week high after recently wedging higher with gains lacking great volume conviction. Subsequent gains above the pivot point backed by at least +40% above average volume may trigger a new technical buy signal. Its Relative Strength Rating has improved to 84, above the 80+ minimum guideline for buy candidates. Three of the past 4 quarterly comparisons through Jun '20 were at or above the +25% minimum earnings guideline (C criteria). It was dropped from the Featured Stocks list on 8/07/20 and found support well above its 200 DMA line during recent consolidations. See the latest FSU analysis for more details and a new annotated graph.
10/12/2020 12:35:27 PM - Y - Color code is changed to yellow with new pivot point cited based on its 9/01/20 high plus 10 cents. Pulling back today after it was perched within close striking distance of its 52-week high, recently wedging higher with gains lacking great volume conviction. Subsequent gains above the pivot point backed by at least +40% above average volume may trigger a new technical buy signal. Its Relative Strength Rating has improved to 84, above the 80+ minimum guideline for buy candidates. Three of the past 4 quarterly comparisons through Jun '20 were at or above the +25% minimum earnings guideline (C criteria). It was dropped from the Featured Stocks list on 8/07/20 and found support well above its 200 DMA line during recent consolidations.
8/7/2020 5:42:44 PM - Slumped further today with higher volume slightly above average. Its Relative Strength Rating has fallen to 74, below the 80+ minimum guideline for buy candidates. It will be dropped from the Featured Stocks list tonight. After violating its 50 DMA line ($181) on 7/31/20 with a damaging volume-driven loss, triggering a technical sell signal, that short-term average acted as resistance. A rebound above the 50 DMA line is needed for its outlook to improve. The prior low ($169.11 on 7/14/20) defines the next important support where any violation would trigger a more worrisome technical sell signal.
8/6/2020 5:28:08 PM - G - After violating its 50 DMA line ($181) on 7/31/20 with a damaging volume-driven loss, triggering a technical sell signal, that short-term average has been acting as resistance. A rebound above it is needed for its outlook to improve. The prior low ($169.11 on 7/14/20) defines the next important support where any violation would trigger a more worrisome technical sell signal.
7/31/2020 1:16:38 PM - G - Color code is changed to green after gapping down today and violating its 50 DMA line ($181.13) with a damaging volume-driven loss triggering a technical sell signal. Weak action came after it reported Jun '20 quarterly earnings +25% on +29% sales revenues versus the year ago period. Volume and volatility often increase near earnings news. Recent gains above the pivot point lacked the +40% above average volume necessary to trigger a convincing new (or add-on) technical buy signal. The prior low ($169.11 on 7/14/20) defines the next important support below its 50 DMA line.
7/29/2020 6:21:00 PM - Y - Consolidating above its 50 DMA line ($181.23) with volume totals cooling. Recent gains above the pivot point lacked the +40% above average volume necessary to trigger a convincing new (or add-on) technical buy signal. Confirming volume-driven gains would be a reassuring sign of fresh institutional buying demand. The prior low ($169.11 on 7/14/20) defines the next important support below its 50 DMA line. Keep in mind it is due to report earnings news after the close on Thursday, on 7/30/20. Volume and volatility often increase near earnings news.
7/24/2020 7:23:26 PM - Y - Pulled back toward its its 50 DMA line ($181.10) with a loss today on light volume. Recent rebound above its 50 DMA line helped its outlook to improve and its color code was changed to yellow. Recent gains above the pivot point lacked the +40% above average volume necessary to trigger a convincing new (or add-on) technical buy signal. Confirming volume-driven gains would be a reassuring sign of fresh institutional buying demand. The prior low ($169.11 on 7/14/20) defines the next important support below its 50 DMA line. Keep in mind it is due to report earnings news on 7/30/20. See the latest FSU analysis for more details and a new annotated graph.
7/20/2020 1:15:27 PM - Y - Today's big volume-driven gain has it rebounding above its 50 DMA line ($180) helping its outlook to improve and its color code is changed to yellow. Recent gains above the pivot point lacked the +40% above average volume necessary to trigger a convincing new (or add-on) technical buy signal. The prior low ($160.20 on 5/27/20) defines its next important support above prior highs in the $156 area.
7/16/2020 6:27:13 PM - G - Slumped further below its 50 DMA line ($179.85) with today's loss on average volume. A rebound above the 50 DMA line is needed for its outlook to improve after recently triggering a technical sell signal. Recent gains above the pivot point lacked the +40% above average volume necessary to trigger a convincing new (or add-on) technical buy signal. The prior low ($160.20 on 5/27/20) defines its next important support above prior highs in the $156 area.
7/14/2020 1:02:24 PM - G - Color code is changed to green after it abruptly slumped below its 50 DMA line ($179.56) with higher volume behind today's big 4th consecutive loss triggering a technical sell signal. Recent gains above the pivot point lacked the +40% above average volume necessary to trigger a convincing new (or add-on) technical buy signal. The prior ow ($160.20 on 5/27/20) defines its next important support above prior highs in the $156 area.
7/13/2020 6:47:50 PM - Y - Abruptly slumped near its 50 DMA line ($179.18) with a big loss today on above average volume. More damaging losses leading to a violation may trigger a worrisome technical sell signal .Recent gains above the pivot point lacked the +40% above average volume necessary to trigger a convincing new (or add-on) technical buy signal.
7/10/2020 6:02:11 PM - Y - Hovering near its all-time high. Wedged higher after an orderly consolidation above its 50 DMA line ($178). Subsequent gains above the pivot point backed by at least +40% above average volume may help clinch a convincing new (or add-on) technical buy signal.
7/7/2020 6:25:25 PM - Y - Stalled after quietly touching a new all-time high on the prior session. Color code is changed to yellow with new pivot point cited based on its 6/01/20 high plus 10 cents after an orderly consolidation above its 50 DMA line ($176). Subsequent gains above the pivot point backed by at least +40% above average volume may trigger a new (or add-on) technical buy signal.
7/1/2020 6:14:22 PM - G - Posted a big gain today with below average volume while building on an orderly consolidation above its 50 DMA line ($174). The next important near-term support is the prior low ($163.72 on 6/05/20).
6/30/2020 5:51:48 PM - G - Found support while recently consolidating above its 50 DMA line ($173). The next important near-term support is the prior low ($163.72 on 6/05/20). See the latest FSU analysis for more details and an annotated graph.
6/29/2020 6:25:51 PM - G - Consolidating above support at its 50 DMA line ($172.39). The next important near-term support is the prior low ($163.72 on 6/05/20). See the latest FSU analysis for more details and a new annotated graph.
6/24/2020 6:32:33 PM - G - Volume was light behind today's loss, consolidating well above its "max buy" level. Near term support is defined by its 50 DMA line ($170.51). The next important near-term support is the prior low ($163.72 on 6/05/20).
6/22/2020 3:23:23 PM - G - Posting a solid gain today, however it is extended from any sound base. Found support above its 50 DMA line ($168.89). The next important near-term support is the prior low ($163.72 on 6/05/20).
6/19/2020 5:35:54 PM - G - Suffered a loss today with below average volume. Consolidating above its 50 DMA line ($167.99) which defines important near-term support above prior highs in the $156 area.
6/16/2020 6:11:41 PM - G - Managed a "positive reversal" today for a gain with higher volume. Consolidating above its 50 DMA line ($165.65) which defines important near-term support above prior highs in the $156 area.
6/11/2020 5:32:17 PM - G - Consolidating above its 50 DMA line ($163.22) which defines important near-term support above prior highs in the $156 area.
6/10/2020 6:06:55 PM - G - Posted a 3rd gain in the span of 4 sessions with below average volume. Its 50 DMA line ($162.49) defines important support above prior highs in the $156 area.
6/5/2020 6:15:31 PM - G - Managed a positive reversal today after losses backed by above average volume. Its 50 DMA line ($160.55) defines important support above prior highs in the $156 area. See the latest FSU analysis for more details and a new annotated graph.
6/4/2020 5:54:30 PM - G - Pulled back today for 2nd consecutive loss backed by above average volume. Its 50 DMA line ($160) defines important support above prior highs in the $156 area.
6/2/2020 6:29:39 PM - G - Extended from any sound base, it pulled back today with lighter volume following 4 consecutive gains that helped it reach a new all-time high. Prior highs in the $156 area define initial support to watch.
5/29/2020 6:24:42 PM - G - Extended from any sound base, it posted a 3rd consecutive gain today for its second best ever close. Prior highs in the $156 area define initial support to watch.
5/27/2020 2:44:34 PM - G - Briefly dipped below the "max buy" level at the session's early low. Prior highs in the $156 area define initial support to watch.
5/26/2020 5:03:08 PM - G - Pulled back for a big loss with higher (slightly above average) volume today. It has been repeatedly noted as extended from the previously noted base, and prior highs in the $156 area define initial support to watch on pullbacks.
5/21/2020 6:11:53 PM - G - Pulled back with higher (near average) volume today. It is extended from the previously noted base, and prior highs in the $156 area define initial support to watch on pullbacks.
5/18/2020 5:19:12 PM - G - Pulled back with lighter volume today following a gain with above average volume for a new all-time high on the prior session. Extended from the previously noted base, and prior highs in the $156 area define initial support to watch on pullbacks. See the latest FSU analysis for more details and a new annotated graph.
5/15/2020 5:22:57 PM - G - Posted a big gain today with above average volume for a new all-time high, getting more extended from the previously noted base. Prior highs in the $156 area define initial support to watch on pullbacks.
5/14/2020 5:14:19 PM - G - Posted a gain today with light volume for a best-ever close. Extended from the previously noted base. Prior highs in the $156 area define initial support to watch on pullbacks.
5/7/2020 6:45:57 PM - G - Posted a 4th consecutive gain today, getting more extended from the previously noted base. Prior highs in the $156 area define initial support to watch on pullbacks.
5/6/2020 7:22:33 PM - G - Rallied further above its "max buy" level with today's 3rd consecutive gain, getting more extended from the previously noted base. Prior highs in the $156 area define initial support to watch on pullbacks. See the latest FSU analysis for more details and an annotated graph.
5/5/2020 12:35:10 PM - G - Color code is changed to green after quickly rallying above its "max buy" level, getting extended from the previously noted base. Finished strong after highlighted in yellow with pivot point based on its 2/19/20 high plus 10 cents in the 5/04/20 mid-day report. Hit a new all-time high with a big gain and strong close above the pivot point backed by +61% above average volume clinching a convincing technical buy signal. It has a 98 Earnings Per Share rating, but last week it reported earnings +19% on +33% sales revenues for the Mar '20 quarter, breaking a strong track record of +25% earnings increases (C criteria). Rebounded from below its 200 DMA line in recent weeks and showed resilience since dropped from the Featured Stocks list on 3/11/20. See the latest FSU analysis for more details and an annotated graph.
5/4/2020 6:05:33 PM - Y - Finished strong after highlighted in yellow with pivot point based on its 2/19/20 high plus 10 cents in the earlier mid-day report. Hit a new all-time high with today's gain and strong close above the pivot point backed by +61% above average volume clinching a convincing technical buy signal. It has a 98 Earnings Per Share rating, but last week it reported earnings +19% on +33% sales revenues for the Mar '20 quarter, breaking a strong track record of +25% earnings increases (C criteria). Rebounded from below its 200 DMA line in recent weeks and showed resilience since dropped from the Featured Stocks list on 3/11/20. See the latest FSU analysis for more details and a new annotated graph.
5/4/2020 12:39:06 PM - Y - Color code is changed to yellow with pivot point based on its 2/19/20 high plus 10 cents. Hit a new all-time high with today's early gain. A gain and strong close above the pivot point backed by at least +40% above average volume may clinch a convincing technical buy signal. It has a 98 Earnings Per Share rating, but last week it reported earnings +19% on +33% sales revenues for the Mar '20 quarter, breaking a strong track record of +25% earnings increases (C criteria). Rebounded from below its 200 DMA line in recent weeks and showed resilience since dropped from the Featured Stocks list on 3/11/20.
5/1/2020 12:43:14 PM - Reported earnings +19% on +33% sales revenues for the Mar '20 quarter, breaking a strong track record of +25% earnings increases (C criteria). Rebounded from below its 200 DMA line in recent weeks and it is perched at its all-time high. It has shown resilience since dropped from the Featured Stocks list on 3/11/20.
4/9/2020 12:51:49 PM - Rebounded from below its 200 DMA line ($132) in recent weeks. Meeting resistance near its 50 DMA line ($141) and it faces resistance due to overhead supply up to the $156 level. It was dropped from the Featured Stocks list on 3/11/20.
3/11/2020 5:43:09 PM - Suffered another damaging volume-driven loss and closed below its 200 DMA line ($132). A rebound above its 50 DMA line ($141) is needed for its outlook to improve. It will be dropped from the Featured Stocks list tonight.
3/10/2020 5:18:34 PM - G - Gapped down on the prior session yet it has been finding support at its 200 DMA line ($132). A rebound above its 50 DMA line ($141) is needed for its outlook to improve.
3/9/2020 5:34:47 PM - G - Gapped down today with a damaging volume-driven loss is testing its 200 DMA line ($132) amid widespread market weakness (M criteria). A rebound above its 50 DMA line ($140.87) is needed for its outlook to improve.
3/9/2020 12:53:03 PM - G - Gapped down today violating its 50 DMA line ($140.88) triggering a technical sell signal. Today's damaging volume-driven loss is testing its 200 DMA line ($132) amid widespread market weakness (M criteria).
3/6/2020 5:33:56 PM - G - Pulled back below its "max buy" level testing support at its 50 DMA line ($140) with today's damaging volume-driven loss amid widespread market weakness (M criteria). Fundamentals remain strong.
3/4/2020 5:53:20 PM - G - Posted a solid gain with average volume and its color code is changed to green after rising back above its "max buy" level. Found support above its 50 DMA line ($139.52) amid widespread market weakness (M criteria). Fundamentals remain strong. See the latest FSU analysis for more details and a new annotated graph.
3/2/2020 5:37:54 PM - Y - Posted a 2nd consecutive gain with above average volume, showing resilience and still consolidating above its 50 DMA line ($138) amid widespread market weakness (M criteria). Fundamentals remain strong.
2/27/2020 5:16:30 PM - Y - Showing resilience and still consolidating above its 50 DMA line ($137) amid widespread market weakness (M criteria). Fundamentals remain strong.
2/24/2020 6:36:57 PM - Y - Color code is changed to yellow as it managed a "positive reversal" today after undercutting its "max buy" level amid widespread weakness. Fundamentals remain strong.
2/18/2020 5:26:54 PM - G - Extended from the prior base and perched above its "max buy" level. Rallied from a cup-with-handle base pattern with volume +514% above average behind the considerable gain on 1/24/20 triggering a technical buy signal. Bullish action came after it reported earnings +48% on +37% sales revenues for the Dec '19 quarter.
2/10/2020 6:31:20 PM - G - Color code is changed to green after rising above its "max buy" level with today's 3rd consecutive gain. Rallied from a cup-with-handle base pattern with volume +514% above average behind the considerable gain on 1/24/20 triggering a technical buy signal. Bullish action came after it reported earnings +48% on +37% sales revenues for the Dec '19 quarter.
2/5/2020 6:00:32 PM - Y - Color code is changed to yellow after pulling back below its "max buy" level with today's big loss on near average volume. Rallied from a cup-with-handle base pattern with volume +514% above average behind the considerable gain on 1/24/20 triggering a technical buy signal. Bullish action came after it reported earnings +48% on +37% sales revenues for the Dec '19 quarter.
2/4/2020 5:33:49 PM - G - Color code is changed to green after it posted a gain with average volume today for a new all-time high above its "max buy" level. Rallied from a cup-with-handle base pattern with volume +514% above average behind the considerable gain on 1/24/20 triggering a technical buy signal. Bullish action came after it reported earnings +48% on +37% sales revenues for the Dec '19 quarter.
1/28/2020 12:50:26 PM - Y - Poised for a best-ever close with today's early gain. Gapped up and touched a new all-time high on the prior session, rising from a cup-with-handle base pattern with volume +514% above average behind the considerable gain triggering a technical buy signal. Bullish action came after it reported earnings +48% on +37% sales revenues for the Dec '19 quarter. Fundamentals remained strong while it went through a deep consolidation below its 200 DMA line since dropped from the Featured Stocks list on 9/09/19.
1/27/2020 12:39:39 PM - Y - Sputtering today amid widespread market weakness. Gapped up and touched a new all-time high on the prior session, rising from a cup-with-handle base pattern with volume +514% above average behind the considerable gain triggering a technical buy signal. Bullish action came after it reported earnings +48% on +37% sales revenues for the Dec '19 quarter. Fundamentals remained strong while it went through a deep consolidation below its 200 DMA line since dropped from the Featured Stocks list on 9/09/19. See the latest FSU analysis for more details and an annotated graph.
1/24/2020 5:59:29 PM - Y - Finished strong today after highlighted in yellow with pivot point cited based on its 1/13/20 high in the earlier mid-day report. Gapped up and touched a new all-time high, rising from a cup-with-handle base pattern with volume +514% above average behind the considerable gain triggering a technical buy signal. Bullish action came after it reported earnings +48% on +37% sales revenues for the Dec '19 quarter. Fundamentals remained strong while it went through a deep consolidation below its 200 DMA line since dropped from the Featured Stocks list on 9/09/19. See the latest FSU analysis for more details and a new annotated graph.
1/24/2020 12:44:25 PM - Y - Color code is changed to yellow with pivot point cited based on its 1/13/20 high. Gapped up today and touched a new all-time high, rising from a cup-with-handle base pattern with a big volume-driven gain triggering a technical buy signal. Bullish action came after it reported earnings +48% on +37% sales revenues for the Dec '19 quarter. Fundamentals remained strong while it went through a deep consolidation below its 200 DMA line since dropped from the Featured Stocks list on 9/09/19.
10/4/2019 12:44:16 PM - Met resistance near its 50 DMA line and it found support above its 200 DMA line. A subsequent rebound above its downward sloping 50 DMA line ($135.35) is needed for its outlook to improve. Fundamentals remain strong. It was dropped from the Featured Stocks list on 9/09/19.
9/24/2019 1:23:30 PM - Met resistance near its 50 DMA line. A rebound above the 50 DMA line ($136.84) is needed for its outlook to improve. Fundamentals remain strong. It was dropped from the Featured Stocks list on 9/09/19.
9/9/2019 3:30:27 PM - Sinking further below its 50 DMA line with today's 2nd consecutive volume-driven loss. A rebound above the 50 DMA line ($138.13) is needed for its outlook to improve. Last week's losses undercutting the prior low ($130.78 on 7/23/19) triggered a worrisome technical sell signal. Fundamentals remain strong. It will be dropped from the Featured Stocks list tonight.
9/6/2019 12:25:28 PM - G - A rebound above the 50 DMA line ($138.35) is needed for its outlook to improve. Halted its slide on the prior session after undercutting the prior low ($130.78 on 7/23/19) this week triggering a worrisome technical sell signal. Fundamentals remain strong.
9/5/2019 1:03:07 PM - G - On track today for a 7th consecutive loss, and this week it undercut the prior low ($130.78 on 7/23/19) triggering a more worrisome technical sell signal. Fundamentals remain strong. A rebound above the 50 DMA line ($138.08) is needed for its outlook to improve.
8/30/2019 1:28:37 PM - G - Color code is changed to green after violating its 50 DMA line with today's 4th consecutive loss Formed a 5-week flat base with new pivot point cited based on its 7/26/19 high plus 10 cents. Prior low ($130.78 on 7/23/19) defines the next important near-term support to watch where a violation would raise serious concerns and trigger a more worrisome technical sell signal. Reported earnings +43% on +36% sales revenues for the Jun '19 quarter, continuing its strong earnings track record.
8/27/2019 5:21:35 PM - Y - Formed a 5-week flat base and its color code is changed to yellow with new pivot point cited based on its 7/26/19 high plus 10 cents. Prior low ($130.78 on 7/23/19) defines the next important near-term support to watch where a violation would raise serious concerns and trigger a more worrisome technical sell signal. Reported earnings +43% on +36% sales revenues for the Jun '19 quarter, continuing its strong earnings track record.
8/21/2019 6:07:59 PM - G - Found support above its pivot point and at its 50 DMA line ($136.79) in recent weeks but did not form a sound base. Prior low ($130.78 on 7/23/19) defines the next important near-term support to watch where a violation would raise serious concerns and trigger a more worrisome technical sell signal. Reported earnings +43% on +36% sales revenues for the Jun '19 quarter, continuing its strong earnings track record. See the latest FSU analysis for more details and a new annotated graph.
8/20/2019 5:35:37 PM - G - Found support at its 50 DMA line ($136.49) in recent weeks but did not form a sound base. Its prior low ($130.78 on 7/23/19) defines the next important near-term support to watch where a violation would raise serious concerns and trigger a more worrisome technical sell signal. Reported earnings +43% on +36% sales revenues for the Jun '19 quarter, continuing its strong earnings track record.
8/14/2019 5:59:55 PM - G - Pulled back toward support at its 50 DMA line ($135.56). Its prior low ($130.78 on 7/23/19) defines the next important near-term support to watch where a violation would raise serious concerns and trigger a more worrisome technical sell signal. Reported earnings +43% on +36% sales revenues for the Jun '19 quarter, continuing its strong earnings track record.
8/13/2019 6:29:31 PM - G - Posted a gain today with below average volume and its color code is changed to green while getting extended from any sound base. Found support above its 50 DMA line ($135). Its prior low ($130.78 on 7/23/19) defines important near-term support to watch where a violation would raise serious concerns and trigger a more worrisome technical sell signal. Reported earnings +43% on +36% sales revenues for the Jun '19 quarter, continuing its strong earnings track record.
8/7/2019 6:56:15 PM - Y - Posted a gain with above average volume, finding support above its 50 DMA line ($133.45). Its prior low ($123.43 on 6/25/19) defines important near-term support to watch where a violation would raise serious concerns and trigger a more worrisome technical sell signal. Reported earnings +43% on +36% sales revenues for the Jun '19 quarter, continuing its strong earnings track record.
8/5/2019 4:27:26 PM - Y - Color code is changed to yellow after gapping down and slumping below its "max buy" level as it also undercut the 50 DMA line ($133.07). Its prior low ($123.43 on 6/25/19) defines important near-term support to watch where a violation would raise serious concerns and trigger a more worrisome technical sell signal. Reported earnings +43% on +36% sales revenues for the Jun '19 quarter, continuing its strong earnings track record.
8/1/2019 5:44:40 PM - G - Posted another gain with above average volume today. Color code was changed to green after rising back above its "max buy" level. The 50 DMA line ($132.65) and prior low ($123.43 on 6/25/19) define important near-term support to watch where violations would raise concerns and trigger technical sell signals. Reported earnings +43% on +36% sales revenues for the Jun '19 quarter, continuing its strong earnings track record.
7/31/2019 6:26:37 PM - G - Posted a gain with higher volume today. Color code is changed to green after rising back above its "max buy" level. The 50 DMA line ($132.287) and prior low ($123.43 on 6/25/19) define important near-term support to watch where violations would raise concerns and trigger technical sell signals. Reported earnings +43% on +36% sales revenues for the Jun '19 quarter, continuing its strong earnings track record.
7/29/2019 5:31:31 PM - Y - Abruptly retreated today with heavy volume after hitting a new all-time high on the prior session. Color code was changed to yellow after pulling back below its "max buy" level. The 50 DMA line ($131.81) and prior low ($123.43 on 6/25/19) define important near-term support to watch where violations would raise concerns and trigger technical sell signals. Reported earnings +43% on +36% sales revenues for the Jun '19 quarter, continuing its strong earnings track record. See the latest FSU analysis for more details and a new annotated graph.
7/29/2019 12:50:13 PM - Y - Abruptly retreating today after hitting a new all-time high on the prior session and its color code is changed to yellow after pulling back below its "max buy" level. The 50 DMA line ($131.78) and prior low ($123.43 on 6/25/19) define important near-term support to watch where violations would raise concerns and trigger technical sell signals. Reported earnings +43% on +36% sales revenues for the Jun '19 quarter, continuing its strong earnings track record.
7/26/2019 12:49:54 PM - G - Reported earnings +43% on +36% sales revenues for the Jun '19 quarter, continuing its strong earnings track record. Volume and volatility often increase near earnings news. Color code was changed to green after rallying back above its "max buy" level and hitting a new all-time high today. The 50 DMA line ($131.68) and prior low ($123.43 on 6/25/19) define important near-term support to watch on pullbacks.
7/26/2019 11:50:13 AM - G - Reported earnings +43% on +36% sales revenues for the Jun '19 quarter, continuing its strong earnings track record. Volume and volatility often increase near earnings news. Color code is changed to green after rallying back above its "max buy" level and hitting a new all-time high today. The 50 DMA line ($131.68) and prior low ($123.43 on 6/25/19) define important near-term support to watch.
7/22/2019 1:50:02 PM - Y - Color code is changed to yellow after pulling back below its "max buy" level. The 50 DMA line ($130.63) and prior low ($123.43 on 6/25/19) define important near-term support to watch. Due to report earnings news on 7/25/19. Volume and volatility often increase near earnings news.
7/15/2019 4:55:19 PM - G - Perched slightly above its "max buy" level and near its all-time high. The 50 DMA line ($128.51) and prior low ($123.43 on 6/25/19) define important near-term support to watch. Reported earnings +133% on +38% sales revenues for the Mar '19 quarter, continuing its strong earnings track record.
7/9/2019 3:15:40 PM - G - Color code is changed to green after quietly rising above its "max buy" level to a new all-time high. The 50 DMA line ($126) and prior low ($123.43 on 6/25/19) define important near-term support to watch. Reported earnings +133% on +38% sales revenues for the Mar '19 quarter, continuing its strong earnings track record.
7/8/2019 4:28:23 PM - Y - Posted a gain again today with below average volume and hit a new all-time high. The 50 DMA line ($125.44) and prior low ($115.87 on 6/03/19) define important near-term support to watch. Reported earnings +133% on +38% sales revenues for the Mar '19 quarter, continuing its strong earnings track record.
7/1/2019 1:17:55 PM - Y - Volume totals in recent weeks have been mostly below average while remaining perched near its all-time high. The 50 DMA line ($123) and prior low ($115.87 on 6/03/19) define important near-term support to watch. Reported earnings +133% on +38% sales revenues for the Mar '19 quarter, continuing its strong earnings track record.
6/24/2019 5:31:03 PM - Y - Pulled back for a second session with below average volume. The 50 DMA line ($121) and prior low ($115.87 on 6/03/19) define important near-term support to watch. Reported earnings +133% on +38% sales revenues for the Mar '19 quarter, continuing its strong earnings track record. See the latest FSU analysis for more details and a new annotated graph.
6/19/2019 5:04:00 PM - Y - Posted a gain today with below average volume for its second best close ever. The 50 DMA line ($120) and prior low ($115.87 on 6/03/19) define important neat-term support to watch. Reported earnings +133% on +38% sales revenues for the Mar '19 quarter, continuing its strong earnings track record.
6/14/2019 10:13:02 AM - Y - Perched near its all-time high. The 50 DMA line ($118.78) and prior low ($115.87 on 6/03/19) define important neat-term support to watch. Reported earnings +133% on +38% sales revenues for the Mar '19 quarter, continuing its strong earnings track record.
6/7/2019 6:35:11 PM - Y - Posted a 4th consecutive gain today with lighter than average volume and ended at a best-ever close. The 50 DMA line and prior high ($117)define important neat-term support to watch. Reported earnings +133% on +38% sales revenues for the Mar '19 quarter, continuing its strong earnings track record.
6/4/2019 6:14:26 PM - Y - Posted a gain today with lighter volume after testing the prior high ($117) which defines important neat-term support to watch. More damaging losses would raise greater concerns and trigger a technical sell signal. Reported earnings +133% on +38% sales revenues for the Mar '19 quarter, continuing its strong earnings track record.
6/3/2019 9:15:02 PM - Y - Slumped today with above average volume while testing the prior high ($117) which defines important neat-term support to watch. More damaging losses would raise greater concerns and trigger a technical sell signal. Reported earnings +133% on +38% sales revenues for the Mar '19 quarter, continuing its strong earnings track record.
5/29/2019 5:24:15 PM - Y - Gapped down today. Formed an advanced "3-weeks tight" base. Prior high ($117) defines important neat-term support to watch. Subsequent volume-driven gains for new highs may trigger a new (or add-on) technical buy signal. Reported earnings +133% on +38% sales revenues for the Mar '19 quarter, continuing its strong earnings track record.
5/24/2019 5:41:53 PM - Y - Color code is changed to yellow after it has formed an advanced "3-weeks tight" base. Subsequent volume-driven gains for new highs may trigger a new (or add-on) technical buy signal. Reported earnings +133% on +38% sales revenues for the Mar '19 quarter, continuing its strong earnings track record. See the latest FSU analysis for more details and a new annotated graph.
5/20/2019 1:27:49 PM - G - Color code is changed to green while perched near its all-time high and above its "max buy" level. Reported earnings +133% on +38% sales revenues for the Mar '19 quarter, continuing its strong earnings track record.
5/13/2019 5:46:08 PM - Y - Today's big loss broke a streak of 7 consecutive gains into new all-time high territory and its color code is changed to yellow after closing below its "max buy" level. Reported earnings +133% on +38% sales revenues for the Mar '19 quarter, continuing its strong earnings track record.
5/10/2019 1:21:37 PM - G - Today's 7th consecutive gain has it powering further into new all-time high territory, quickly getting extended from any sound base. Repaired technical damage after violating its 50 DMA line with a big gap down on 4/18/19. Reported earnings +133% on +38% sales revenues for the Mar '19 quarter, continuing its strong earnings track record.
5/9/2019 1:05:56 PM - G - Today's 6th consecutive gain has it powering above the "max buy" price into new all-time high territory and its color code is changed to green. Prior session's gain above the pivot point backed by +104% above average volume clinched a convincing technical buy signal. Recently reported earnings +133% on +38% sales revenues for the Mar '19 quarter, continuing its strong earnings track record.
5/8/2019 1:25:13 PM - Y - Today's 5th consecutive gain has it perched within close striking distance of a best-ever close and new all-time high. A strong close and gain above the pivot point backed by at least +40% above average volume may clinch a convincing technical buy signal. Color code is changed to yellow after rebounding above its 50 DMA line ($109.81). Recently reported earnings +133% on +38% sales revenues for the Mar '19 quarter, continuing its strong earnings track record.
5/1/2019 7:15:57 PM - G - Retreated quietly today to close just below the 50 DMA line ($109.19) after wedging higher. Recently reported earnings +133% on +38% sales revenues for the Mar '19 quarter, continuing its strong earnings track record.
4/24/2019 5:52:33 PM - G - Reversed into the red today. The 50 DMA line may act as resistance, but a rebound above the 50 DMA line ($108.83) is needed for its outlook to improve. Reported earnings +133% on +38% sales revenues for the Mar '19 quarter, continuing its strong earnings track record.
4/23/2019 1:22:09 PM - G - Rebounding after a damaging gap down and volume-driven loss on 4/18/19 violated its 50 DMA line triggering a technical sell signal. That short-term average may act as resistance, but a rebound above the 50 DMA line ($108.84) is needed for its outlook to improve. Reported earnings +133% on +38% sales revenues for the Mar '19 quarter, continuing its strong earnings track record.
4/22/2019 12:46:31 PM - G - Gapped down on the prior session violating its 50 DMA line ($108.79) and triggering a technical sell signal with a big volume-driven loss. A prompt rebound above the 50 DMA line is needed for its outlook to improve. Reported earnings +133% on +38% sales revenues for the Mar '19 quarter, continuing its strong earnings track record. Volume and volatility often increase near earnings news. Fundamentals remain strong.
4/18/2019 12:51:56 PM - G - Color code was changed to green after violating its 50 DMA line ($108.78) with a gap down and big volume-driven loss today. Reported earnings +133% on +38% sales revenues for the Mar '19 quarter, continuing its strong earnings track record. Volume and volatility often increase near earnings news. Fundamentals remain strong.
4/18/2019 10:50:35 AM - G - Color code is changed to green after violating its 50 DMA line ($108.78) with a gap down today. Reported earnings +133% on +38% sales revenues for the Mar '19 quarter, continuing its strong earnings track record. Volume and volatility often increase near earnings news. Fundamentals remain strong.
4/16/2019 1:02:09 PM - Y - Color code is changed to yellow after forming an advanced "3-weeks tight" base. Pivot point cited is based on its 4/03 high plus 10 cents. Subsequent gains above the pivot point backed by at least +40% above average volume may trigger a new (or add-on) technical buy signal. Due to report financial results for the quarter ended March 31, 2019 after market close on Wednesday, April 17, 2019. Volume and volatility often increase near earnings news. Its 50 DMA line ($108.67) and recent lows define near-term support to watch. Fundamentals remain strong.
4/15/2019 12:47:22 PM - G - Due to report financial results for the quarter ended March 31, 2019 after market close on Wednesday, April 17, 2019. Volume and volatility often increase near earnings news. Endured distributional pressure in recent weeks and it is extended from any sound base. Its 50 DMA line ($108.43) and recent lows define near-term support to watch. Fundamentals remain strong.
4/9/2019 5:20:01 PM - G - Endured distributional pressure in recent weeks and it is extended from any sound base. Its 50 DMA line ($107) and recent lows define near-term support to watch. Fundamentals remain strong. See the latest FSU analysis for more details and a new annotated graph.
4/4/2019 3:54:50 PM - G - Enduring more distributional pressure today and it is extended from any sound base. Its 50 DMA line ($106) and recent low ($99.77 on 3/04/19) define near-term support to watch. Fundamentals remain strong.
3/27/2019 6:14:29 PM - G - Enduring distributional pressure and it is extended from any sound base. Its 50 DMA line ($103.67) and recent low ($99.77 on 3/04/19) define near-term support to watch. Fundamentals remain strong.
3/22/2019 1:06:02 PM - G - Pulling back today after inching into new all-time high territory with gains in recent weeks lacking great volume-conviction. Extended from any sound base, its 50 DMA line ($102.83) and recent low ($99.77 on 3/04/19) define near-term support to watch. Fundamentals remain strong.
3/20/2019 6:30:23 PM - G - Posted 3 consecutive gains with lighter than average volume, inching into new all-time high territory. Extended from any sound base. Its 50 DMA line ($102) and recent low define near-term support to watch on pullbacks. Fundamentals remain strong.
3/13/2019 12:36:37 PM - G - Posted 4 consecutive gains with light or average volume, challenging its all-time high, extended from any sound base. Prior high ($98.21) and 50 DMA line ($99.84) define near-term support to watch on pullbacks. Fundamentals remain strong.
3/11/2019 6:12:24 PM - G - Posted a 3rd consecutive gain today with below average volume, challenging its all-time high. Recently found support while consolidating above its prior high ($98.21) and 50 DMA line ($98.92) define near-term support to watch on pullbacks. Fundamentals remain strong.
3/4/2019 8:26:25 PM - G - Loss today came with above average volume after wedging to new all-time highs with recent gains lacking great volume conviction. Color code is changed to green after finishing the session back above its "max buy" level. Prior high ($98.21) and 50 DMA line ($96.57) define near-term support to watch on pullbacks. Fundamentals remain strong. See the latest FSU analysis for more details and a new annotated graph.
3/4/2019 12:38:38 PM - Y - Color code is changed to yellow while pulling back below its "max buy" level with a big loss today with above average volume, abruptly retreating after wedging to another new all-time high last week with gains lacking great volume conviction. Its prior high ($98.21) and 50 DMA line ($96.53) define near-term support to watch on pullbacks. Fundamentals remain strong.
3/1/2019 6:04:16 PM - G - Posted a big gain today with near average volume for a new all-time high. Recent gains lacked great volume conviction. Its prior high ($98.21) and 50 DMA line ($96.06) define near-term support to watch on pullbacks. Fundamentals remain strong.
2/25/2019 6:18:26 PM - G - Gapped up and posted a small gain with below average volume for a new all-time high. Recent gains lacked great volume conviction. Its prior high ($98.21) and 50 DMA line ($94.07) define near-term support to watch on pullbacks. Fundamentals remain strong.
2/19/2019 12:53:12 PM - G - Volume totals have been cooling while stubbornly holding its ground at its all-time high. Recent gains lacked great volume conviction. Its prior high ($98.21) and 50 DMA line ($92.32) define near-term support to watch on pullbacks. Fundamentals remain strong.
2/11/2019 5:21:47 PM - G - Quiet gain today hit another new all-time high. Recent gains have lacked great volume conviction. Gains and a strong close above the pivot point backed by at least +40% above average volume are needed to clinch a proper technical buy signal. Its 50 DMA line ($90.34) and prior low define near-term support to watch on pullbacks. Fundamentals remain strong.
2/5/2019 3:58:03 PM - G - Color code is changed to green while posting a 5th consecutive gain today, rising above its "max buy" level and hitting new all-time highs, however gains have lacked great volume conviction. Gains and a strong close above the pivot point backed by at least +40% above average volume are needed to clinch a proper technical buy signal. Its 50 DMA line ($87.97) and prior low define near-term support to watch on pullbacks. Fundamentals remain strong.
2/4/2019 5:36:51 PM - Y - Posted a 4th consecutive gain today hitting new all-time highs, however gains have lacked great volume conviction. Gains and a strong close above the pivot point backed by at least +40% above average volume are needed to clinch a proper technical buy signal. Its 50 DMA line ($87.32) and prior low define near-term support to watch on pullbacks. Fundamentals remain strong.
1/31/2019 1:09:49 PM - Y - Volume is running at an above average pace today while matching its all-time high. Subsequent gains and a strong close above the pivot point backed by at least +40% above average volume may help to clinch a convincing technical buy signal. Its 50 DMA line ($86.21) and prior low define near-term support to watch on pullbacks. Fundamentals remain strong.
1/29/2019 5:46:38 PM - Y - Volume totals have been drying up while hovering near its high. Reported earnings +92% on +39% sales revenues for the Dec '18 quarter. Subsequent gains and a strong close above the pivot point backed by at least +40% above average volume may help to clinch a convincing technical buy signal. Its 50 DMA line ($85.29) and prior low define near-term support to watch on pullbacks. See the latest FSU analysis for more details and an annotated graph.
1/28/2019 5:51:08 PM - Y - Hovering near its high with lighter than average volume for the past 3 sessions. Reported earnings +92% on +39% sales revenues for the Dec '18 quarter. Subsequent gains and a strong close above the pivot point backed by at least +40% above average volume may help to clinch a convincing technical buy signal. Its 50 DMA line ($84.41) and prior low define near-term support to watch on pullbacks. See the latest FSU analysis for more details and a new annotated graph.
1/25/2019 5:03:34 PM - Y - Posted a gain for a new high close with light volume. Reported earnings +92% on +39% sales revenues for the Dec '18 quarter. Subsequent gains and a strong close above the pivot point backed by at least +40% above average volume may help to clinch a convincing technical buy signal. Its 50 DMA line ($84.41) and prior low define near-term support to watch on pullbacks.
1/23/2019 11:39:46 AM - Y - There was a big "negative reversal" and weak close on 1/18/19 after hitting a new high, and heavy volume behind recent losses was action indicative of distributional pressure. Volume and volatility often increase near earnings news. Reported earnings +92% on +39% sales revenues for the Dec '18 quarter. Recently held its ground in a tight range, churning higher volume while perched within close striking distance of its prior high. Color code was changed to yellow with new pivot point cited based on its 10/01/18 high plus 10 cents. Subsequent gains and a strong close above the pivot point backed by at least +40% above average volume may help to clinch a convincing technical buy signal. Its 50 DMA line ($83.59) and prior low define near-term support to watch on pullbacks.
1/22/2019 12:28:04 PM - Y - There was a big "negative reversal" and weak close on the prior session after hitting a new high, and heavy volume behind recent losses was action indicative of distributional pressure. Volume and volatility often increase near earnings news. Reported earnings +92% on +39% sales revenues for the Dec '18 quarter. Recently held its ground in a tight range, churning higher volume while perched within close striking distance of its prior high. Color code was changed to yellow with new pivot point cited based on its 10/01/18 high plus 10 cents. Subsequent gains and a strong close above the pivot point backed by at least +40% above average volume may help to clinch a convincing technical buy signal. Its 50 DMA line ($83.30) and prior low define near-term support to watch on pullbacks.
1/18/2019 6:16:31 PM - Y - There was a big "negative reversal" and weak close today after hitting a new high, and heavy volume was action indicative of distributional pressure. Volume and volatility often increase near earnings news. Reported earnings +92% on +39% sales revenues for the Dec '18 quarter. Recently held its ground in a tight range, churning higher volume while perched within close striking distance of its prior high. Color code was changed to yellow with new pivot point cited based on its 10/01/18 high plus 10 cents. Subsequent gains and a strong close above the pivot point backed by at least +40% above average volume may help to clinch a convincing technical buy signal. Its 50 DMA line ($82.90) and prior low define near-term support to watch on pullbacks.
1/18/2019 12:36:15 PM - Y - Hit a new high today then reversed into the red. Volume and volatility often increase near earnings news. Reported earnings +92% on +39% sales revenues for the Dec '18 quarter after the close today. It has been holding its ground in a tight range, churning higher volume while perched within close striking distance of its prior high. Color code was changed to yellow with new pivot point cited based on its 10/01/18 high plus 10 cents. Subsequent gains and a strong close above the pivot point backed by at least +40% above average volume may trigger a convincing technical buy signal. Its 50 DMA line ($82.94) and prior low define near-term support to watch on pullbacks.
1/17/2019 5:06:00 PM - Y - Volume and volatility often increase near earnings news. Reported earnings +92% on +39% sales revenues for the Dec '18 quarter after the close today. It has been holding its ground in a tight range, churning higher volume while perched within close striking distance of its prior high. Color code was changed to yellow with new pivot point cited based on its 10/01/18 high plus 10 cents. Subsequent gains above the pivot point backed by at least +40% above average volume may trigger a technical buy signal. Its 50 DMA line ($82.58) and prior low define near-term support to watch on pullbacks.
1/17/2019 2:14:00 PM - Y - Stubbornly holding its ground in a tight range, churning higher volume while perched within close striking distance of its prior high. Due to report earnings news after market close on Thursday, January 17, 2019. Volume and volatility often increase near earnings news. Color code was changed to yellow with new pivot point cited based on its 10/01/18 high plus 10 cents. Subsequent gains above the pivot point backed by at least +40% above average volume may trigger a technical buy signal. Its 50 DMA line ($82.60) and prior low define near-term support to watch on pullbacks.
1/15/2019 12:45:24 PM - Y - Managed a "positive reversal" after early weakness today. Stubbornly holding its ground perched within close striking distance of its prior high. Due to report earnings news after market close on Thursday, January 17, 2019. Color code was changed to yellow with new pivot point cited based on its 10/01/18 high plus 10 cents. Subsequent gains above the pivot point backed by at least +40% above average volume may trigger a technical buy signal. Fundamentals remain strong. Found support at its 200 DMA line during its consolidation in recent months.
1/14/2019 12:41:23 PM - Y - Volume totals have been cooling while stubbornly holding its ground perched within close striking distance of its prior high. Due to report earnings news after market close on Thursday, January 17, 2019. Color code was changed to yellow with new pivot point cited based on its 10/01/18 high plus 10 cents. Subsequent gains above the pivot point backed by at least +40% above average volume may trigger a technical buy signal. Fundamentals remain strong. It found support at its 200 DMA line during the consolidation after dropped from the Featured Stocks list on 10/10/18.
1/11/2019 5:14:58 PM - Y - Volume totals have been cooling while stubbornly holding its ground perched within close striking distance of its prior high. Color code was changed to yellow with new pivot point cited based on its 10/01/18 high plus 10 cents. Subsequent gains above the pivot point backed by at least +40% above average volume may trigger a technical buy signal. Fundamentals remain strong. It found support at its 200 DMA line during the consolidation after dropped from the Featured Stocks list on 10/10/18.
1/8/2019 12:39:13 PM - Y - Posted a solid gain on the prior session with heavy volume and it is on track today for a 3rd consecutive gain. Color code was changed to yellow with new pivot point cited based on its 10/01/18 high plus 10 cents. Subsequent gains above the pivot point backed by at least +40% above average volume may trigger a technical buy signal. Fundamentals remain strong. It found support at its 200 DMA line during the consolidation after dropped from the Featured Stocks list on 10/10/18. See the latest FSU analysis for more details and an annotated graph.
1/7/2019 6:37:38 PM - Y - Posted a solid gain today with heavy volume. Color code was changed to yellow with new pivot point cited based on its 10/01/18 high plus 10 cents. Subsequent volume-driven gains above the pivot point may trigger a technical buy signal. Fundamentals remain strong. It found support at its 200 DMA line during the consolidation after dropped from the Featured Stocks list on 10/10/18. See the latest FSU analysis for more details and a new annotated graph.
1/7/2019 12:37:38 PM - Y - Color code is changed to yellow with new pivot point cited based on its 10/01/18 high plus 10 cents. Subsequent volume-driven gains above the pivot point may trigger a technical buy signal. Fundamentals remain strong. It found support at its 200 DMA line during the consolidation after dropped from the Featured Stocks list on 10/10/18.
12/31/2018 12:21:25 PM - Consolidating above the 50 DMA line. Some resistance remains due to overhead supply up to the $98 level. Fundamentals remain strong. It found support at its 200 DMA line during the consolidation after dropped from the Featured Stocks list on 10/10/18.
10/10/2018 5:29:58 PM - Slumped further below its 50 DMA line ($85.56) with a volume-driven loss today after a recently noted technical sell signal. A rebound above the 50 DMA line is needed for its outlook to improve. It will be dropped from the Featured Stocks list tonight.
10/8/2018 7:01:19 PM - G - Violated its 50 DMA line ($85.23) triggering a technical sell signal with above average volume behind today's 6th consecutive loss. Only a prompt rebound above the 50 DMA line would help its outlook improve.
10/4/2018 12:49:56 PM - G - Gapped down, retreating from its all-time high with above average volume behind today's 4th consecutive loss. The 50 DMA line ($84.73) defines near-term support to watch. Fundamentals through Jun '18 have been strong.
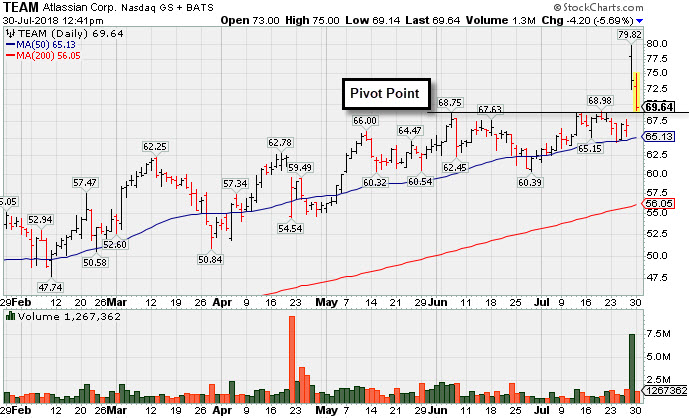
10/1/2018 6:22:09 PM - G - Hit a new all-time high today but reversed into the red, ending a 5-session winning streak. Extended from any sound base. The 50 DMA line ($83.23) defines near-term support to watch on pullbacks. Fundamentals through Jun '18 have been strong.
9/24/2018 3:59:51 PM - G - Posting a gain and rallying near its all-time high today with average volume. Extended from any sound base. The 50 DMA line ($80.48) defines near-term support to watch on pullbacks. Fundamentals through Jun '18 have been strong.
9/17/2018 4:51:09 PM - G - Pulled back from its all-time high today with average volume. Extended from any sound base. The 50 DMA line ($77.95) defines near-term support to watch on pullbacks. Fundamentals through Jun '18 have been strong.
9/14/2018 4:52:04 PM - G - Posted a gain on light volume for another new all-time high, getting more extended from any sound base. The 50 DMA line ($77.43) defines near-term support to watch on pullbacks. Fundamentals through Jun '18 have been strong. See the latest FSU analysis for more details and a new annotated graph.
9/11/2018 5:15:57 PM - G - Posted a gain on light volume ending near its all-time high, very extended from any sound base. The 50 DMA line ($75.68) defines near-term support to watch on pullbacks. Fundamentals through Jun '18 have been strong.
9/5/2018 12:37:41 PM - G - Extended from any sound base, well above its 50 DMA line ($73.63) which defines near-term support. Fundamentals through Jun '18 have been strong.
9/4/2018 5:29:08 PM - G - Hit another new high with today's gain backed by greater volume conviction, getting more extended from any sound base. Its 50 DMA line ($73) defines near-term support above prior highs in the $68 area. Fundamentals through Jun '18 have been strong.
8/28/2018 12:13:44 PM - G - Powering higher with today's 7th consecutive gain backed by greater volume conviction, getting more extended from any sound base. Its 50 DMA line ($71.09) defines near-term support above prior highs in the $68 area. Fundamentals through Jun '18 have been strong.
8/27/2018 12:54:07 PM - G - Powering higher with today's 6th consecutive gain backed by greater volume conviction, getting more extended from any sound base. Its 50 DMA line ($70.69) defines near-term support above prior highs in the $68 area. Fundamentals through Jun '18 have been strong.
8/24/2018 4:59:16 PM - G - Powered to new highs with big gains backed by greater volume conviction, getting more extended from any sound base. Fundamentals through Jun '18 have been strong.
8/20/2018 12:45:42 PM - G - Stubbornly holding its ground after recently wedging to new highs with gains lacking great volume conviction, and it is extended from any sound base. Fundamentals through Jun '18 have been strong.
8/13/2018 7:11:19 PM - G - Posted a small gain today with light volume. It has recently wedged to new highs with gains lacking great volume conviction, and it is extended from any sound base. Fundamentals through Jun '18 have been strong.
8/6/2018 6:25:14 PM - G - Posted a gain today with +20% above average volume for a best-ever close, rising above its "max buy" level, and its color code is changed to green. It was highlighted in yellow with pivot point cited based on its 6/06/18 high plus 10 cents. This Australia - based software developer reported earnings +44% on +40% sales revenues for the Jun '18 quarter helping it better match with the fact-based investment system's guidelines.
7/30/2018 6:16:25 PM - Y - Retreated from its all-time high hit on the prior session. It was highlighted in yellow with pivot point cited based on its 6/06/18 high plus 10 cents. This Australia - based software developer reported earnings +44% on +40% sales revenues for the Jun '18 quarter helping it better match with the fact-based investment system's guidelines. Annual earnings (A criteria) history has been strong since its $21 IPO on 12/10/15. See the latest FSU analysis for more details and a new annotated graph.
7/30/2018 12:44:41 PM - Y - Abruptly retreating from its all-time high hit on the prior session. It was highlighted in yellow with pivot point cited based on its 6/06/18 high plus 10 cents. This Australia - based software developer reported earnings +44% on +40% sales revenues for the Jun '18 quarter helping it better match with the fact-based investment system's guidelines. Annual earnings (A criteria) history has been strong since its $21 IPO on 12/10/15.
7/27/2018 1:18:15 PM - Y - Color code is changed to yellow with pivot point cited based on its 6/06/18 high plus 10 cents. This Australia - based software developer recently wedged higher, and it gapped up today hitting a new all-time high with a considerable gain backed by great volume conviction. Reported earnings +44% on +40% sales revenues for the Jun '18 quarter helping it better match with the fact-based investment system's guidelines. Annual earnings (A criteria) history has been strong since its $21 IPO on 12/10/15.
6/4/2018 12:40:09 PM - This Australia -based software developer rebounded above its 50 DMA line and recently wedged to new highs with gains lacking great volume conviction. Reported earnings +25% on +40% sales revenues for the Mar '18 quarter. Fundamentals are not a great match with the fact-based investment system's guidelines. Limited history since its $21 IPO on 12/10/15.
5/29/2018 12:52:12 PM - This Australia -based software developer rebounded above its 50 DMA line and recently wedged to new highs with gains lacking great volume conviction. Reported earnings +25% on +40% sales revenues for the Mar '18 quarter. Fundamentals are not a great match with the fact-based investment system's guidelines. Limited history since its $21 IPO on 12/10/15.
4/25/2018 1:21:20 PM - This Australia -based software developer gapped down on 4/20/18 for a volume-driven loss and today it is slumping below its 50 DMA line ($56.91). Reported earnings +25% on +40% sales revenues for the Mar '18 quarter. It had just rebounded to touch a new 52-week high, however prior mid-day reports cautioned members - "Fundamental concerns remain. Limited history since its $21 IPO on 12/10/15."
4/24/2018 1:08:11 PM - This Australia -based software developer gapped down on 4/20/18 for a volume-driven loss testing its 50 DMA line ($56.83) after it reported earnings +25% on +40% sales revenues for the Mar '18 quarter. It had just rebounded to touch a new 52-week high, however prior mid-day reports cautioned members - "Fundamental concerns remain. Limited history since its $21 IPO on 12/10/15."
4/23/2018 1:13:20 PM - Reported earnings +25% on +40% sales revenues for the Mar '18 quarter. This Australia -based software developer gapped down on the prior session for a volume-driven loss testing its 50 DMA line ($56.66). It had just rebounded to touch a new 52-week high, however prior mid-day reports cautioned members - "Fundamental concerns remain. Limited history since its $21 IPO on 12/10/15."
4/20/2018 12:52:05 PM - This UK-based software developer gapped down with a volume-driven loss today testing its 50 DMA line ($56.47) after it had just rebounded to touch a new 52-week high. Prior mid-day reports noted - "Fundamental concerns remain. Limited history since its $21 IPO on 12/10/15."
4/18/2018 1:40:54 PM - This UK-based software developer found support after undercutting its 50 DMA line in recent weeks and rebounded to touch a new 52-week high. Prior mid-day reports noted - "Fundamental concerns remain. Limited history since its $21 IPO on 12/10/15."
2/21/2018 12:42:07 PM - Hitting a new all-time high with today's 8th consecutive gain. This UK-based software developer found support at its 50 DMA line in recent weeks. Prior mid-day reports noted - "Fundamental concerns remain. Limited history since its $21 IPO on 12/10/15."
1/22/2018 1:27:52 PM - Retreating further from its all-time high after a big loss on heavy volume on the prior session broke an impressive streak of volume-driven gains. This UK-based software developer was noted with caution in the 1/03/18 mid-day report when rebounding above its 50 DMA line with a big volume-driven gain - "Fundamental concerns remain. Limited history since its $21 IPO on 12/10/15."
1/19/2018 12:57:42 PM - Retreating from its new all-time high with today's big loss on heavy volume after an impressive streak of volume-driven gains. This UK-based software developer was noted with caution in the 1/03/18 mid-day report when rebounding above its 50 DMA line with a big volume-driven gain - "Fundamental concerns remain. Limited history since its $21 IPO on 12/10/15."
1/17/2018 1:06:32 PM - Hitting new 52-week highs this week while adding upon prior volume-driven gains. Noted with caution in the 1/03/18 mid-day report when rebounding above its 50 DMA line with a big volume-driven gain - "Fundamental concerns remain. Limited history since its $21 IPO on 12/10/15."
1/16/2018 12:35:04 PM - Gapped up today hitting a new 52-week high with a big volume-driven gain. Last noted with caution in the 1/03/18 mid-day report when rebounding above its 50 DMA line with a big volume-driven gain - "Fundamental concerns remain. Limited history since its $21 IPO on 12/10/15."
1/3/2018 1:45:00 PM - Rebounding above its 50 DMA line with a big volume-driven gain today. The 10/23/17 mid-day report last cautioned members - "Fundamental concerns remain. Limited history since its $21 IPO on 12/10/15."
10/23/2017 1:41:27 PM - Gapped up hitting yet another new 52-week high with a considerable volume-driven gain on the prior session. Held is ground after a very impressive streak of volume-driven gains. Prior mid-day reports cautioned members - "Fundamental concerns remain. Limited history since its $21 IPO on 12/10/15."
10/20/2017 12:57:39 PM - Gapped up hitting yet another new 52-week high with today's considerable volume-driven gain. Held is ground after a very impressive streak of volume-driven gains. Prior mid-day reports cautioned members - "Fundamental concerns remain. Limited history since its $21 IPO on 12/10/15."
10/11/2017 12:39:09 PM - Hitting yet another new 52-week high with today's gain adding to a very impressive streak of volume-driven gains. Prior mid-day reports cautioned members - "Fundamental concerns remain. Limited history since its $21 IPO on 12/10/15."
10/10/2017 12:50:02 PM - Hitting another new 52-week high with today's gain adding to an impressive streak of volume-driven gains. Prior mid-day reports cautioned members - "Fundamental concerns remain. Limited history since its $21 IPO on 12/10/15."
10/9/2017 12:12:30 PM - Hitting a new 52-week high with today's gain adding to an impressive streak of gains. Prior mid-day reports cautioned members - "Fundamental concerns remain. Limited history since its $21 IPO on 12/10/15."
7/31/2017 11:50:02 AM - Pulled back from its 52-week high testing its 50 DMA line. Prior mid-day reports cautioned members - "Fundamental concerns remain. Limited history since its $21 IPO on 12/10/15."
7/28/2017 12:05:27 PM - Perched near its 52-week high. Prior mid-day reports cautioned members - "Fundamental concerns remain. Limited history since its $21 IPO on 12/10/15."
7/25/2017 1:02:12 PM - Gapped up today and hit a new 52-week high. The 5/12/17 mid-day report last cautioned - "Reported Mar '17 earnings +14% on +36% sales revenues and fundamental concerns remain. Limited history since its $21 IPO on 12/10/15."
5/12/2017 2:10:41 PM - Perched at its 52-week high, stubbornly holding its ground. The 5/02/17 mid-day report cautioned - "Reported Mar '17 earnings +14% on +36% sales revenues and fundamental concerns remain. Limited history since its $21 IPO on 12/10/15."
5/2/2017 1:40:47 PM - Perched at its 52-week high. Reported Mar '17 earnings +14% on +36% sales revenues and fundamental concerns remain. Limited history since its $21 IPO on 12/10/15.
5/1/2017 1:24:14 PM - Perched at its 52-week high. Reported Mar '17 earnings +14% on +36% sales revenues and fundamental concerns remain. Limited history since its $21 IPO on 12/10/15.
4/28/2017 1:36:36 PM - Challenging its 52-week high following a deep consolidation. Reported Mar '17 earnings +14% on +36% sales revenues and fundamental concerns remain. Limited history since its $21 IPO on 12/10/15.
4/20/2017 12:33:43 PM - Went through a deep consolidation and fundamental concerns remain. Reported Dec '16 earnings +0% on +36% sales revenues. Limited history since its $21 IPO on 12/10/15.
4/11/2017 12:38:11 PM - Went through a deep consolidation and fundamental concerns remain since last noted with caution in the 9/22/16 mid-day report - "Limited history since its $21 IPO on 12/10/15. Reported Jun '16 earnings +0% on +39% sales revenues and fundamental concerns remain."
9/22/2016 1:05:45 PM - Pulling back today after spiking to a new high on the prior session but finishing below the middle of its wide intra-day range. Found support above its 50 DMA line during its consolidation since last noted with caution in the 8/10/16 mid-day report - "Limited history since its $21 IPO on 12/10/15. Reported Jun '16 earnings +0% on +39% sales revenues and fundamental concerns remain."
8/10/2016 1:59:19 PM - Prior mid-day reports cautioned - "Limited history since its $21 IPO on 12/10/15. Reported Jun '16 earnings +0% on +39% sales revenues and fundamental concerns remain."
8/8/2016 12:56:29 PM - Pulling back today after spiking to a new 52-week high with volume-driven gains. The 8/05/16 mid-day report cautioned - "Limited history since its $21 IPO on 12/10/15. Reported Jun '16 earnings +0% on +39% sales revenues and fundamental concerns remain."
8/5/2016 12:50:55 PM - Challenging its 52-week high with volume-driven gains. Limited history since its $21 IPO on 12/10/15. Reported Jun '16 earnings +0% on +39% sales revenues and fundamental concerns remain.
2/16/2005 12:46:01 PM - Poor group. Low priced and no base.
2/10/2005 12:38:35 PM - Poor group. Low priced and no base.
8/3/2004 1:00:00 PM - Poor group. Low priced and no base.
7/29/2004 1:00:00 PM - Poor group. Low priced and no base.
7/27/2004 1:00:00 PM - Poor group. Low priced and no base.
7/23/2004 1:00:00 PM - Poor group. Low priced and no base.