11/7/2024 12:53:43 PM - Suffering a volume-driven loss today while sinking back below its 50 DMA line. Reported Sep '24 quarterly earnings +22% on +10% sales revenues, its 2nd subpar quarterly comparison. It was dropped from the Featured Stocks list on 8/05/24.
8/5/2024 8:54:50 PM - Suffered a 2nd volume-driven loss today while sinking further below its 50 DMA line ($1,288) to new lows. A rebound above the 50 DMA line is needed for its outlook to improve. It will be dropped from the Featured Stocks list tonight.
8/2/2024 7:05:03 PM - G - Color code was changed to green after meeting resistance near its 50 DMA line ($1,290) and slumping to new lows. A rebound above the 50 DMA line is needed for its outlook to improve. See the latest FSU analysis for more details and a new annotated graph.
8/2/2024 12:49:49 PM - G - Color code is changed to green after meeting resistance near its 50 DMA line ($1,290) and slumping to new lows. A rebound above the 50 DMA line is needed for its outlook to improve. Fundamentals remain strong.
7/31/2024 5:10:08 PM - Y - Color code is changed to yellow after today's 4th consecutive gain helped it rebound above its 50 DMA line ($1,294). It is -5.5% off its all-time high. The new pivot point cited is based on its 6/06/24 high plus 10 cents. Subsequent gains above the pivot point backed by at least +40% above average volume are needed to trigger a proper new technical buy signal. Fundamentals remain strong.
7/24/2024 3:30:36 PM - G - Gapped down today after rebounding but meeting resistance at its 50 DMA line ($1,297.53) which is now downward sloping. It is -8.3% off its all-time high. A rebound above the 50 DMA line is needed to improve its outlook. Fundamentals remain strong.
7/22/2024 5:41:59 PM - G - Posted a small gain today with below-average volume. Recently lingering below its 50 DMA line ($1,299) which is now downward sloping. It is -8.3% off its all-time high. A rebound above the 50 DMA line is needed to improve its outlook. Fundamentals remain strong.
7/17/2024 5:31:13 PM - G - Pulled back today with lighter volume. Recently lingering below its 50 DMA line ($1,303) which is now downward sloping. It is -9.4% off its all-time high. A rebound above the 50 DMA line is needed to help its outlook improve. Fundamentals remain strong.
7/16/2024 6:14:23 PM - G - Posted a big gain today with below-average volume following a spurt of volume-driven losses. Recently lingering below its 50 DMA line ($1,304), yet it is only -6.5% off its all-time high. A rebound above the 50 DMA line is needed to help its outlook improve. Fundamentals remain strong.
7/12/2024 12:40:59 PM - G - Sputtering today and still lingering below its 50 DMA line ($1,304), however, it remains only -8.9% off its all-time high. A rebound above the 50 DMA line is needed to help its outlook improve. Fundamentals remain strong.
7/10/2024 5:10:50 PM - G - Still lingering below its 50 DMA line ($1,304). A rebound above the 50 DMA line is needed to help its outlook improve. Fundamentals remain strong. See the latest FSU analysis for more details and a new annotated graph.
7/8/2024 5:36:46 PM - G - Still lingering below its 50 DMA line ($1,303.65). Only a prompt rebound above the 50 DMA line would help its outlook improve. Fundamentals remain strong.
6/28/2024 6:57:28 PM - G - Slumped further below its 50 DMA line ($1,298) with heavy volume behind today's 4th consecutive loss raising greater concerns and triggering a technical sell signal. Only a prompt rebound above the 50 DMA line would help its outlook improve. Fundamentals remain strong.
6/26/2024 5:33:02 PM - G - Testing its 50 DMA line ($1,295) and recent lows which define important near-term support to watch. More damaging losses would raise greater concerns. Fundamentals remain strong.
6/21/2024 3:45:13 PM - G - Still quietly consolidating above its "max buy" level. Its 50 DMA line ($1,290) defines near-term support to watch above recent lows in the $1,280 area. Fundamentals remain strong.
6/17/2024 3:54:05 PM - G - Quietly consolidating above its "max buy" level. Its 50 DMA line ($1,283) defines near-term support to watch. Fundamentals remain strong.
6/12/2024 5:29:08 PM - G - Color code is changed to green after rising back above its "max buy" level. Its 50 DMA line ($1,278) defines near-term support to watch. Fundamentals remain strong. See the latest FSU analysis for more details and a new annotated graph.
6/11/2024 5:30:22 PM - Y - Color code is changed to yellow after pulling back below its "max buy" level with today's 4th consecutie loss. Its 50 DMA line ($1,275) defines near-term support to watch. Fundamentals remain strong.
6/6/2024 3:52:40 PM - G - Touched a new all-time high today but again made a "negative reversal". It is extended from any sound base and its 50 DMA line ($1,271) defines near-term support to watch on pullbacks. Fundamentals remain strong.
6/3/2024 8:40:41 PM - G - Still hovering near its all-time high after a "negative reversal" on 5/28/24. It is extended from any sound base and its 50 DMA line ($1,264) defines near-term support to watch on pullbacks. Fundamentals remain strong.
5/29/2024 2:25:22 PM - G - There was a "negative reversal" on the prior session after hitting yet another new all-time high. It is extended from any sound base and its 50 DMA line ($1,257) defines near-term support to watch on pullbacks. Fundamentals remain strong.
5/24/2024 5:49:50 PM - G - Posted a gain today with below-average volume hitting another new all-time high. It is extended from any sound base and its 50 DMA line ($1,251) defines near-term support to watch on pullbacks. Fundamentals remain strong.
5/21/2024 6:10:58 PM - G - Posted a 3rd consecutive gain today with average volume while hitting another new all-time high. It is extended from any sound base and its 50 DMA line ($1,242) defines near-term support to watch on pullbacks. Reported Mar '24 quarterly earnings +34% on +21% sales revenues versus the year-ago period. See the latest FSU analysis for more details and a new annotated graph.
5/20/2024 5:19:32 PM - G - Posted a gain today with lighter volume. It is extended from any sound base and its 50 DMA line ($1,238) defines near-term support to watch on pullbacks. Reported Mar '24 quarterly earnings +34% on +21% sales revenues versus the year-ago period.
5/16/2024 11:07:15 PM - G - It is extended from any sound base and its 50 DMA line ($1,233) defines near-term support to watch on pullbacks. Reported Mar '24 quarterly earnings +34% on +21% sales revenues versus the year-ago period.
5/13/2024 5:47:51 PM - G - Pulled back for a 2nd loss today with higher volume after 7 consecutive gains as it rose to new all-time highs. It is extended from any sound base and its 50 DMA line ($1,226) defines near-term support to watch on pullbacks. Reported Mar '24 quarterly earnings +34% on +21% sales revenues versus the year-ago period.
5/10/2024 5:15:16 PM - G - Paused today after 7 consecutive gains as it rose to new all-time highs. It is extended from any sound base and its 50 DMA line ($1,224) defines near-term support to watch on pullbacks. Reported Mar '24 quarterly earnings +34% on +21% sales revenues versus the year-ago period.
5/9/2024 4:08:16 PM - G - Posted 7 consecutive gains as it rose to new all-time highs above its "max buy" level and its color code was changed to green. Its 50 DMA line ($1,221) defines near-term support to watch on pullbacks. Reported Mar '24 quarterly earnings +34% on +21% sales revenues versus the year-ago period.
5/8/2024 5:05:38 PM - G - Posted 6 consecutive gains marked by volume as it rose to new all-time highs above its "max buy" level and its color code is changed to green. Its 50 DMA line ($1,218) defines near-term support to watch on pullbacks. Reported Mar '24 quarterly earnings +34% on +21% sales revenues versus the year-ago period.
5/7/2024 12:39:29 PM - Y - Gapped down today after reporting Mar '24 quarterly earnings +34% on +21% sales revenues versus the year-ago period. Pulling back from a new all-time high after gains above the pivot point backed by at least +40% above average volume triggered a technical buy signal. Its 50 DMA line ($1,215) defines near-term support to watch on pullbacks.
5/6/2024 6:21:20 PM - Y - Posted a 4th consecutive gain today with +73% above-average volume for a new all-time high. Gains above the pivot point backed by at least +40% above average volume triggered a technical buy signal. Its 50 DMA line ($1,214) defines near-term support to watch on pullbacks.
5/3/2024 5:30:32 PM - Y - Posted a 3rd consecutive gain today with +24% above-average volume for a new all-time high. New pivot point was cited based on its 4/04/24 high plus 10 cents. Gains above the pivot point backed by at least +40% above average volume are needed to trigger a proper technical buy signal. Its 50 DMA line ($1,211) defines near-term support to watch on pullbacks.
5/2/2024 9:00:58 PM - Y - Posted a gain today with average volume for a new all-time high. New pivot point was cited based on its 4/04/24 high plus 10 cents. Subsequent gains above the pivot point backed by at least +40% above average volume are needed to trigger a technical buy signal. Its 50 DMA line ($1,209) defines near-term support to watch.
4/30/2024 7:52:18 PM - Y - Churned above average volume today and ended slightly lower. Holding its ground at its all-time high. New pivot point was cited based on its 4/04/24 high plus 10 cents. Subsequent gains above the pivot point backed by at least +40% above average volume are needed to trigger a proper new technical buy signal. Its 50 DMA line ($1,205.61) defines near-term support to watch. See the latest FSU analysis for more details and a new annotated graph.
4/29/2024 6:06:46 PM - Y - Volume totals are cooling while holding its ground at its all-time high. New pivot point was cited based on its 4/04/24 high plus 10 cents. Subsequent gains above the pivot point backed by at least +40% above average volume are needed to trigger a proper new technical buy signal. Its 50 DMA line ($1,203) defines near-term support to watch.
4/23/2024 5:54:37 PM - Y - Posted a solid gain today with +22% above average volume for a best-ever close. Color code was changed to yellow after holding its ground in a tight range near its all-time high. New pivot point was cited based on its 4/04/24 high plus 10 cents. Subsequent gains above the pivot point backed by at least +40% above average volume are needed to trigger a proper new technical buy signal. Its 50 DMA line ($1,193) defines near-term support to watch.
4/17/2024 4:03:56 PM - Y - Color code is changed to yellow after holding its ground in a tight range near its all-time high. New pivot point was cited based on its 4/04/24 high plus 10 cents. Subsequent gains above the pivot point backed by at least +40% above average volume are needed to trigger a proper new technical buy signal. Its 50 DMA line ($1,187) defines near-term support to watch.
4/12/2024 10:41:16 AM - Y - Color code is changed to yellow after holding its ground in a tight range near its all-time high. New pivot point is cited based on its 4/04/24 high plus 10 cents. Subsequent gains above the pivot point backed by at least +40% above average volume are needed to trigger a proper new technical buy signal. Its 50 DMA line ($1,182) defines near-term support to watch.
4/9/2024 5:23:10 PM - G - Holding its ground following a noted "negative reversal" on 4/04/24 after touching a new all-time high. Its 50 DMA line ($1,173) defines near-term support to watch. See the latest FSU analysis for more details and a new annotated graph.
4/5/2024 7:26:47 PM - G - Rebounded today following a "negative reversal" on the prior session after touching a new all-time high. Its 50 DMA line ($1,168) defines near-term support to watch.
4/4/2024 4:00:13 PM - G - There was a "negative reversal" today after touching a new all-time high. Volume totals have still been cooling while stubbornly holding its ground. Its 50 DMA line ($1,164) defines near-term support to watch.
4/1/2024 9:21:15 PM - G - Volume totals have still been cooling while stubbornly holding its ground after wedging to a new all-time high. Its 50 DMA line ($1,156) defines near-term support to watch.
3/25/2024 5:36:07 PM - G - Volume totals have been cooling while stubbornly holding its ground after wedging to a new all-time high. Its 50 DMA line ($1,140) defines near-term support to watch.
3/20/2024 5:05:42 PM - G - Posted a 3rd consecutive gain today back by light volume, wedging to a new all-time high after 3 weeks of tight closes. Its 50 DMA line ($1,127) defines near-term support to watch.
3/15/2024 7:19:54 PM - G - Pulled back with higher volume yet remains perched near its all-time high after 3 weeks of tight closes. Its 50 DMA line ($1,114) defines near-term support to watch. See the latest FSU analysis for more details and a new annotated graph.
3/12/2024 9:07:11 PM - G - Posted a solid gain today with average volume. Its 50 DMA line ($1,103) defines near-term support to watch.
3/5/2024 9:15:39 PM - G - Pulled back today with average volume for a 2nd consecutive loss. Its 50 DMA line ($1,087) defines near-term support to watch.
2/27/2024 11:30:31 AM - G - Pulling back today with below-average volume for a 2nd loss off of its all-time high. Its 50 DMA line ($1,068) defines near-term support to watch.
2/21/2024 4:44:38 PM - G - Inched higher with below-average volume for a best-ever close today. Its 50 DMA line ($1,053) defines near-term support to watch above prior highs in the $1,013-1,015 area.
2/14/2024 8:17:51 PM - G - Managed a best-ever close today perched near its all-time high. Its 50 DMA line ($1,038) defines near-term support to watch above prior highs in the $1,013-1,015 area. See the latest FSU analysis for more details and a new annotated graph.
2/8/2024 1:00:40 PM - G - Extended from any sound base today's 8th consecutive gain with above-average volume has it hitting yet another new all-time high. Its 50 DMA line ($1,025) defines near-term support to watch above prior highs in the $1,013-1,015 area.
2/6/2024 6:11:21 PM - G - Posted a 6th consecutive gain today with above-average volume for a new all-time high. Prior highs in the $1,013-1,015 area define near-term support to watch on pullbacks.
1/31/2024 5:49:30 PM - G - Posted a gain today for a new all-time high with above average volume. Prior highs in the $1,013-1,015 area define near-term support to watch on pullbacks.
1/25/2024 5:44:15 PM - G - Posted again today and color code is changed to green as it rose above its "max buy" level for a new all-time high with a volume-driven gain. Prior highs in the $1,013-1,015 area define near-term support to watch on pullbacks.
1/24/2024 7:09:26 PM - Y - Pulled back from its all-time high with today's 2nd loss with below-average volume. Recently wedged higher with gains lacking great volume conviction.
1/17/2024 5:18:18 PM - Y - Hit another new all-time high with a small gain today with below-average volume. Recently wedging higher without great volume conviction.
1/11/2024 11:26:30 PM - Y - Hit a new high as it posted a 6th consecutive gain today with below-average volume. See the latest FSU analysis for more details and a new annotated graph.
1/8/2024 5:46:10 PM - Y - Posted a 3rd consecutive gain today with higher volume. The new pivot point cited was based on its 11/14/23 high plus 10 cents, however, recent gains above the pivot point were not backed by the +40% above-average volume necessary to trigger a proper new technical buy signal. Fundamentals remain strong. Its recent low ($972.08 on 1/03/24) defines near-term support to watch above its 50 DMA line ($957.46).
1/2/2024 6:26:48 PM - Y - Pulled back today with near-average (higher) volume. The new pivot point cited was based on its 11/14/23 high plus 10 cents, however, recent gains above the pivot point were not backed by the +40% above-average volume necessary to trigger a proper new technical buy signal. Fundamentals remain strong. Recent lows in the $950 area define near-term support to watch on pullbacks.
12/26/2023 8:41:22 PM - Y - Posted a 3rd consecutive gain backed by light volume for its second-best ever close. The new pivot point cited was based on its 11/14/23 high plus 10 cents, however, gains above the pivot point were not backed by the +40% above-average volume necessary to trigger a proper new technical buy signal. Fundamentals remain strong. Recent lows in the $950 area define near-term support to watch on pullbacks.
12/19/2023 5:18:55 PM - Y - Posted a 2nd consecutive gain backed by light volume following 2 volume-driven losses. The new pivot point cited was based on its 11/14/23 high plus 10 cents, however, gains above the pivot point were not backed by the +40% above-average volume necessary to trigger a proper new technical buy signal. Fundamentals remain strong. Recent lows in the $950 area define near-term support to watch on pullbacks.
12/14/2023 5:54:55 PM - Y - Suffered a loss today with above-average volume undercutting prior highs and breaking a streak of 6 consecutive gains backed by lackluster volume. The new pivot point cited was based on its 11/14/23 high plus 10 cents, however, gains above the pivot point were not backed by the +40% above-average volume necessary to trigger a proper new technical buy signal. Fundamentals remain strong. Recent lows in the $950 area define near-term support to watch on pullbacks. See the latest FSU analysis for more details and a new annotated graph.
12/12/2023 6:41:47 PM - Y - Managed a best-ever close with below-average volume behind today's 5th consecutive gain. Color code is changed to yellow with new pivot point cited based on its 11/14/23 high plus 10 cents. Subsequent gains above the pivot point backed by at least +40% above average volume may trigger a new technical buy signal. Fundamentals remain strong. Recent lows in the $950 area define near-term support to watch on pullbacks.
12/6/2023 5:48:01 PM - G - Volume totals have been cooling while consolidating in recent weeks after briefly trading above the $1,000 threshold. Fundamentals remain strong. Prior high ($940) defines initial support to watch on pullbacks.
11/30/2023 5:19:06 PM - G - Posted a gain today with average volume. Consolidating after briefly trading above the $1,000 threshold. Fundamentals remain strong. Prior high ($940) defines initial support to watch on pullbacks.
11/28/2023 5:49:36 PM - G - Pulled back today with higher (near average) volume. Consolidating after briefly trading above the $1,000 threshold. Fundamentals remain strong. Prior high ($940) defines initial support to watch on pullbacks.
11/27/2023 5:08:35 PM - G - Volume totals have been cooling while consolidating after briefly trading above the $1,000 threshold. Fundamentals remain strong. Prior high ($940) defines initial support to watch on pullbacks.
11/22/2023 5:07:01 PM - G - It stalled after briefly trading above the $1,000 threshold last week. Fundamentals remain strong. Prior high ($940) defines initial support to watch on pullbacks.
11/20/2023 6:39:57 PM - G - Today's small gain with average volume broke a streak of 3 consecutive losses with above-average volume after briefly trading above the $1,000 threshold. Fundamentals remain strong. Prior high ($940) defines initial support to watch on pullbacks.
11/15/2023 5:35:43 PM - G - Today's loss broke a streak of 13 consecutive gains. Ended near the session low on the prior session after trading above the $1,000 threshold. Fundamentals remain strong. Prior high ($940) defines initial support to watch on pullbacks.
11/14/2023 6:26:35 PM - G - Today marked its 13th consecutive gain but it reversed and ended near the session low after trading above the $1,000 threshold. Fundamentals remain strong. Prior high ($940) defines initial support to watch on pullbacks.
11/10/2023 5:16:41 PM - G - Color code is changed to green after rising above its "max buy" level for a new all-time with today's 11th consecutive gain. Reported Sep '23 quarterly earnings +46% on +23% sales revenues versus the year-ago period, its 10th consecutive comparison above the +25% minimum earnings guideline (C criteria).
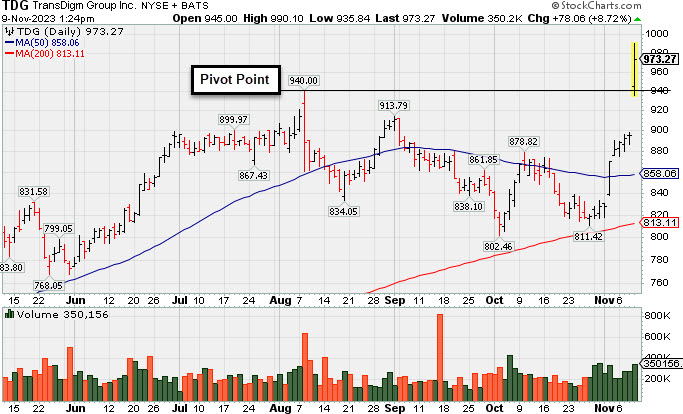
11/9/2023 5:14:39 PM - Y - Finished strong after highlighted in yellow in the earlier mid-day report with pivot point cited based on its 8/08/23 high plus 10 cents. Hit a new all-time high triggering a technical buy signal with a "breakaway gap" and 10th consecutive volume-driven gain. Reported Sep '23 quarterly earnings +46% on +23% sales revenues versus the year-ago period, its 10th consecutive comparison above the +25% minimum earnings guideline (C criteria). Growth has been very strong after a downturn in FY '20 and '21 (A criteria) hurt its earnings track record. See the latest FSU analysis for more details and a new annotated graph.
11/9/2023 1:29:34 PM - Y - Color code is changed to yellow with pivot point cited based on its 8/08/23 high plus 10 cents. Hitting a new all-time high triggering a technical buy signal with today's "breakaway gap" and 10th consecutive volume-driven gain. Reported Sep '23 quarterly earnings +46% on +23% sales revenues versus the year-ago period, its 10th consecutive comparison above the +25% minimum earnings guideline (C criteria). Growth has been very strong after a downturn in FY '20 and '21 (A criteria) hurt its earnings track record.
10/5/2023 1:08:40 PM - Slumped below its 50 DMA line toward its 200 DMA line since a "negative reversal" at its all-time high when last noted with caution in the 8/08/23 mid-day report. Reported Jun '23 quarterly earnings +49% on +25% sales revenues versus the year-ago period, its 9th consecutive comparison above the +25% minimum earnings guideline (C criteria). Fundamental concerns remain after a downturn in FY '20 and '21 (A criteria) hurt its strong earnings track record.
8/8/2023 1:29:28 PM - Hit a new all-time high today while churning above average volume and trading in a wider than usual intra-day range. Due to report Jun '23 quarterly results. Reported earnings +55% for the Mar '23 quarter, its 8th consecutive comparison above the +25% minimum earnings guideline (C criteria). Fundamental concerns remain after a downturn in FY '20 and '21 (A criteria) hurt its strong earnings track record.
5/9/2023 1:17:36 PM - Hitting a new all-time high with today's big volume-driven gain. Reported earnings +55% for the Mar '23 quarter, its 8th consecutive comparison above the +25% minimum earnings guideline (C criteria). Fundamental concerns remain after a downturn in FY '20 and '21 (A criteria) hurt its strong earnings track record.
2/10/2020 1:12:27 PM - Hovering near its all-time high. Reported earnings +28% on +48% sales revenues for the Dec '19 quarter, its 2nd comparison above the +25% minimum earnings guideline (C criteria). Fundamental concerns remain, yet it made choppy progress since dropped from the Featured Stocks list on 11/18/16.
1/8/2020 12:24:08 PM - Hitting new all-time highs today with a streak of 5 consecutive gains lacking great volume conviction. Reported earnings +27% on +47% sales revenues for the Sep '19 quarter. Prior mid-day reports cautioned members - "Reported earnings +23% on +69% sales revenues for the Jun '19 quarter, and prior comparisons were not strong and steady above the +25% minimum earnings guideline (C criteria). Fundamental concerns remain, yet it made choppy progress since dropped from the Featured Stocks list on 11/18/16."
11/22/2019 12:11:54 PM - Pulling back from its all-time high hit this week with a streak of volume-driven gains. Reported earnings +27% on +47% sales revenues for the Sep '19 quarter. The 8/30/19 mid-day report last cautioned members - "Reported earnings +23% on +69% sales revenues for the Jun '19 quarter, and prior comparisons were not strong and steady above the +25% minimum earnings guideline (C criteria). Fundamental concerns remain, yet it made choppy progress since dropped from the Featured Stocks list on 11/18/16."
8/30/2019 1:27:16 PM - Perched near its all-time high. Repaired a recent 50 DMA line violation with a considerable gap gain on heavy volume when the 8/06/19 mid-day report cautioned members - "Reported earnings +23% on +69% sales revenues for the Jun '19 quarter, and prior comparisons were not strong and steady above the +25% minimum earnings guideline (C criteria). Fundamental concerns remain, yet it made choppy progress since dropped from the Featured Stocks list on 11/18/16."
8/27/2019 1:10:12 PM - Gapped down today retreating with volume-driven losses after hitting a new all-time high. Repaired a recent 50 DMA line violation with a considerable gap gain on heavy volume when the 8/06/19 mid-day report last cautioned members - "Reported earnings +23% on +69% sales revenues for the Jun '19 quarter, and prior comparisons were not strong and steady above the +25% minimum earnings guideline (C criteria). Fundamental concerns remain, yet it made choppy progress since dropped from the Featured Stocks list on 11/18/16."
8/6/2019 1:01:36 PM - Gapped up today hitting a new all-time high, repairing the recent 50 DMA line violation. Reported earnings +23% on +69% sales revenues for the Jun '19 quarter, and prior comparisons were not strong and steady above the +25% minimum earnings guideline (C criteria). Fundamental concerns remain, yet it made choppy progress since dropped from the Featured Stocks list on 11/18/16.
5/15/2019 1:21:13 PM - Violating its 50 DMA line with today's big volume-driven loss. Reported earnings +11% on +28% sales revenues for the Mar '19 quarter, below the +25% minimum earnings guideline (C criteria). Fundamental concerns remain, yet it made choppy progress since dropped from the Featured Stocks list on 11/18/16.
5/7/2019 1:23:11 PM - Reported earnings +11% on +28% sales revenues for the Mar '19 quarter, below the +25% minimum earnings guideline (C criteria). Fundamental concerns remain, yet it made choppy progress since dropped from the Featured Stocks list on 11/18/16.
11/18/2016 5:08:09 PM - Sank below its prior low ($251.58 on 10/12/16) today raising greater concerns and triggering another technical sell signal. A rebound above its 50 DMA line ($262) is needed for its outlook to improve. Reported earnings +16% on +8% sales revenues for the Sep '16 quarter, below the +25% minimum earnings guideline (C criteria), raising fundamental concerns. It will be dropped from the Featured Stocks list tonight.
11/18/2016 12:35:39 PM - G - Sputtering today near its prior low ($251.58 on 10/12/16) where a violation may raise greater concerns. Its 50 DMA line acted as resistance following a volume-driven loss on 11/14/16 triggering a technical sell signal. A rebound above its 50 DMA line ($262) is needed for its outlook to improve. Reported earnings +16% on +8% sales revenues for the Sep '16 quarter, below the +25% minimum earnings guideline (C criteria), raising fundamental concerns. See the latest FSU analysis for more details and a an annotated graph.
11/16/2016 5:37:28 PM - G - Its 50 DMA line may act as resistance following a volume-driven loss on 11/14/16 triggering a technical sell signal. A rebound above its 50 DMA line ($262) is needed for its outlook to improve. Reported earnings +16% on +8% sales revenues for the Sep '16 quarter, below the +25% minimum earnings guideline (C criteria), raising fundamental concerns. See the latest FSU analysis for more details and a new annotated graph.
11/16/2016 12:20:11 PM - G - Its 50 DMA line may act as resistance following a volume-driven loss on 11/14/16 triggering a technical sell signal. A rebound above its 50 DMA line ($262) is needed for its outlook to improve. Reported earnings +16% on +8% sales revenues for the Sep '16 quarter, below the +25% minimum earnings guideline (C criteria), raising fundamental concerns.
11/15/2016 4:40:15 PM - G - Rebounded today after a damaging loss on the prior session violated its 50 DMA line raising concerns and triggering a technical sell signal. A rebound above its 50 DMA line ($262) is needed for its outlook to improve. Reported earnings +16% on +8% sales revenues for the Sep '16 quarter, below the +25% minimum earnings guideline (C criteria), raising fundamental concerns.
11/15/2016 12:51:48 PM - G - Rebounding today after a damaging loss on the prior session violated its 50 DMA line raising concerns and triggering a technical sell signal. A rebound above its 50 DMA line ($262) is needed for its outlook to improve. Reported earnings +16% on +8% sales revenues for the Sep '16 quarter, below the +25% minimum earnings guideline (C criteria), raising fundamental concerns.
11/14/2016 1:15:47 PM - G - Technically, it violated its 50 DMA line with a volume-driven loss today raising concerns and its color code was changed to green. Reported earnings +16% on +8% sales revenues for the Sep '16 quarter, below the +25% minimum earnings guideline (C criteria), raising fundamental concerns.
11/14/2016 10:44:16 AM - G - Undercutting its 50 DMA line today raising concerns and its color code is changed to green. Reported earnings +16% on +8% sales revenues for the Sep '16 quarter, below the +25% minimum earnings guideline (C criteria), raising concerns.
11/11/2016 4:44:14 PM - Y - Today's gain above its pivot point was backed by +75% above average volume clinching a technical buy signal. Endured distributional pressure after its gain on 11/08/16 with +39% above average volume conviction. Previously noted - "Gains above a stock's pivot point must be backed by at least +40% above average volume to trigger a proper new (or add-on) technical buy signal."
11/7/2016 5:47:43 PM - Y - Posted a gain today with +39% above average volume conviction. Previously noted - "Gains above a stock's pivot point must be backed by at least +40% above average volume to trigger a proper new (or add-on) technical buy signal. Rebounded above its 50 DMA line with volume-driven gains after issuing a Special Dividend effective 10/20/16."
10/31/2016 5:48:12 PM - Y - Wedged to new highs with recent gains lacking great volume conviction. Gains above a stock's pivot point must be backed by at least +40% above average volume to trigger a proper new (or add-on) technical buy signal. Rebounded above its 50 DMA line with volume-driven gains after issuing a Special Dividend effective 10/20/16.
10/25/2016 4:53:32 PM - Y - Color code is change to yellow and a new pivot point is cited based on its 9/07/16 high plus 10 cents. Subsequent gains above the pivot point backed by at least +40% above average volume may trigger a new (or add-on) technical buy signal. Posted a gain on above average volume today for a best-ever close. Rebounded above its 50 DMA line with volume-driven gains after issuing a Special Dividend effective 10/20/16.
10/20/2016 5:36:53 PM - G - Rebounded near its 50 DMA line with today's volume-driven gain while issuing a Special Dividend. See the latest FSU analysis for additional details and an annotated graph.
10/19/2016 5:17:53 PM - G - Still sputtering below its 50 DMA line ($284.84). A rebound above that important short-term average is needed for its outlook improve. See the latest FSU analysis for additional details and a new annotated graph.
10/17/2016 4:59:03 PM - G - Still sputtering below its 50 DMA line ($284.88). A rebound above that important short-term average is needed for its outlook improve.
10/12/2016 5:07:57 PM - G - Halted its slide with a small gain today. Violations of its 50 DMA line and prior low ($278.52 on 9/20/16) raised concerns and triggered worrisome technical sell signals. Only a prompt rebound would help its outlook improve.
10/7/2016 12:32:36 PM - G - Damaging losses today are further undercutting the 50 DMA line ($284) after a noted "negative reversal" on 10/04/16 erased gains challenging its prior high. A violation of the recent low ($278.52 on 9/20/16) would raise greater concerns and trigger a worrisome technical sell signal.
10/5/2016 12:40:32 PM - G - There was a "negative reversal" on the prior session after early gains challenging its prior high. More damaging losses undercutting the 50 DMA line ($284.68) or recent low ($278.52) would raise concerns and trigger technical sell signals.
10/4/2016 1:06:50 PM - G - It has not formed a sound base and reversed into the red after early gains, slumping near its 50 DMA line ($284.59). Subsequent losses undercutting the 50 DMA line or recent low ($278.52) would raise concerns and trigger technical sell signals.
9/30/2016 5:32:11 PM - G - Quietly consolidating above its 50 DMA line ($284), extended from any sound base. Subsequent losses undercutting the 50 DMA line or recent low ($278.52) would raise greater concerns
9/26/2016 5:42:56 PM - G - Rallied further above its 50 DMA line ($282) toward prior highs with today's volume-driven gain. Subsequent losses undercutting the 50 DMA line or recent low ($278.52) would raise greater concerns
9/21/2016 6:47:22 PM - G - Found support today near its 50 DMA line ($281). More damaging losses would raise greater concerns
9/16/2016 5:16:05 PM - G - Down today with twice average volume, slumping near its 50 DMA line ($280) defining important near-term support to watch.
9/13/2016 5:50:29 PM - G - Fell today with light volume, slumping near its 50 DMA line ($279) defining important near-term support to watch.
9/7/2016 6:05:15 PM - G - Wedged to new all-time highs with today's 4th consecutive gain backed by light volume. Its 50 DMA line and prior highs define important near-term support to watch on pullbacks. See the latest FSU analysis for more details and a new annotated graph.
9/6/2016 4:25:47 PM - G - Today's light volume gain led to a best-ever close. Volume has been drying up while hovering in a tight range. Its 50 DMA line and prior highs near $268 define important near-term support to watch on pullbacks.
8/29/2016 4:02:29 PM - G - Volume has been drying up while hovering in a tight range, and today's light volume gain led to a best-ever close. Its 50 DMA line and prior highs near $268 define important near-term support to watch on pullbacks.
8/22/2016 5:34:02 PM - G - Volume has been drying up while hovering in a tight range near all-time highs. Its 50 DMA line and prior highs near $268 define important near-term support to watch on pullbacks.
8/16/2016 7:40:00 PM - G - Volume has remained below average while recently hovering near all-time highs. Its 50 DMA line and prior highs near $268 define important near-term support to watch on pullbacks.
8/8/2016 5:40:21 PM - G - Touched a new high today but reversed into the red. Volume was below average while recently wedging into new all-time high territory. Its 50 DMA line and prior highs near $268 define important near-term support to watch on pullbacks.
8/1/2016 6:04:02 PM - G - Volume was below average while recently wedging into new all-time high territory. Its 50 DMA line ($264.91) defines important near-term support to watch on pullbacks.
7/27/2016 5:46:35 PM - G - Volume totals still have been cooling while wedging further into new all-time high territory. Its 50 DMA line ($263) defines important near-term support to watch on pullbacks. See the latest FSU analysis for more details and a new annotated graph.
7/25/2016 5:15:58 PM - G - Volume totals still have been cooling while stubbornly holding its ground near all-time highs. Its 50 DMA line ($261.91) defines important near-term support to watch on pullbacks.
7/18/2016 5:43:22 PM - G - Volume totals have been cooling while hovering near all-time highs. Recent lows and its 50 DMA line ($258) define important near-term support to watch on pullbacks.
7/12/2016 4:21:45 PM - G - Touched a new high with below average volume behind today's small gain. Recent lows and its 50 DMA line ($254.81) define important near-term support to watch on pullbacks.
7/8/2016 4:47:12 PM - G - Hit a new high with below average volume behind today's 3rd consecutive gain. Recent lows and its 50 DMA line ($253.21) define important near-term support to watch on pullbacks.
7/6/2016 5:11:24 PM - G - Recent lows and its 50 DMA line ($251.84) define important near-term support to watch on pullbacks. See the latest FSU analysis for more details and an annotated graph.
7/1/2016 4:39:21 PM - G - Recent lows and its 50 DMA line ($250.42) define near-term support to watch on pullbacks. See the latest FSU analysis for more details and a new annotated graph.
6/30/2016 5:42:58 PM - G - Color code is changed to green rebounding above its "max buy" level. Recent lows and its 50 DMA line ($249.73) define near-term support to watch on pullbacks.
6/27/2016 5:21:12 PM - Y - Color code is changed to yellow after retreating below its "max buy" level with a loss on light volume. Slumped toward its 50 DMA line ($247.73) defining near-term support above prior highs ($244). More damaging losses would raise concerns.
6/24/2016 6:05:41 PM - G - Slumped today with higher (near average) volume and ended near its "max buy" level and recent lows. Prior highs and its 50 DMA line define near-term support in the $242-244 area.
6/21/2016 4:50:23 PM - G - Color code is changed to green after trading back above its "max buy" level. Prior highs and its 50 DMA line define near-term support in the $242-244 area.
6/16/2016 12:36:49 PM - Y - Color code is changed to yellow after quietly retreating below its "max buy" level. Prior highs and its 50 DMA line define near-term support in the $242-244 area.
6/15/2016 4:45:07 PM - G - Still quietly consolidating near all-time highs. Disciplined investors avoid chasing extended stocks. Prior highs and its 50 DMA line define near-term support in the $242-244 area.
6/10/2016 5:14:11 PM - G - Ended near the session low while quietly consolidating near all-time highs. Disciplined investors avoid chasing extended stocks.
6/7/2016 5:09:53 PM - G - Holding its ground stubbornly near all-time highs. Disciplined investors avoid chasing extended stocks.
6/2/2016 12:39:56 PM - G - Perched at all-time highs following volume-driven gains and a rally well above its "max buy" level. Disciplined investors avoid chasing extended stocks. Bullish action has continued since highlighted in yellow in the 5/11/16 mid-day report (read here). See the latest FSU analysis for more details and a new annotated graph.
6/1/2016 12:45:35 PM - G - Surging further into new high territory with another volume-driven gain today following a gap up on the prior session. Rallying well above its "max buy" level. Disciplined investors avoid chasing extended stocks. Bullish action has continued since highlighted in yellow in the 5/11/16 mid-day report (read here).
5/31/2016 12:37:58 PM - G - Gapped up today and its color code is changed to green after rallying well above its "max buy" level. Disciplined investors avoid chasing extended stocks. Bullish action has continued since highlighted in yellow in the 5/11/16 mid-day report (read here).
5/26/2016 5:32:59 PM - Y - Perched near its "max buy" level, stubbornly holding its ground. Bullish action has continued since highlighted in yellow in the 5/11/16 mid-day report (read here).
5/24/2016 5:27:26 PM - Y - Rallied toward its "max buy" level with today's volume-driven gain. Volume totals had been cooling while stubbornly holding its ground since highlighted in yellow with pivot point based on its 8/18/15 high plus 10 cents in the 5/11/16 mid-day report (read here).
5/23/2016 5:14:44 PM - Y - Volume totals have still been cooling while stubbornly holding its ground since highlighted in yellow with pivot point based on its 8/18/15 high plus 10 cents in the 5/11/16 mid-day report (read here).
5/18/2016 5:20:31 PM - Y - Volume totals have cooled while still stubbornly holding its ground since highlighted in yellow with pivot point based on its 8/18/15 high plus 10 cents in the 5/11/16 mid-day report (read here).
5/13/2016 5:25:13 PM - Y - Holding its ground while churning above average volume since highlighted in yellow with pivot point based on its 8/18/15 high plus 10 cents in the 5/11/16 mid-day report (read here). Gapped up on the prior session and hit a new high with a considerable volume-driven gain triggering a technical buy signal. Reported earnings +36% on +29% sales for the Mar '16 quarter, marking its 3rd consecutive quarterly comparison with earnings above the +25% minimum earning guideline (C criteria). Annual earnings history has remained strong. See the latest FSU analysis for additional details and a new annotated graph.
5/11/2016 6:13:42 PM - Y - Highlighted in yellow with pivot point based on its 8/18/15 high plus 10 cents in today's mid-day report (read here). Gapped up on the prior session and hit a new high with a considerable volume-driven gain triggering a technical buy signal. Reported earnings +36% on +29% sales for the Mar '16 quarter, marking its 3rd consecutive quarterly comparison with earnings above the +25% minimum earning guideline (C criteria). Annual earnings history has remained strong. See the latest FSU analysis for additional details and a new annotated graph.
5/11/2016 12:31:04 PM - Y - Color code is changed to yellow with pivot point based on its 8/18/15 high plus 10 cents. Gapped up on the prior session and hit a new high with a considerable volume-driven gain triggering a technical buy signal. Reported earnings +36% on +29% sales for the Mar '16 quarter, marking its 3rd consecutive quarterly comparison with earnings above the +25% minimum earning guideline (C criteria). Annual earnings history has remained strong.
1/15/2016 12:28:51 PM - Slumped below its 50 and 200 DMA lines with losses testing the October lows. Its rebound fell short of prior highs and then it sputtered after last noted with caution in the 11/13/16 mid-day report - "Faces resistance due to overhead supply up through the $244 area. Reported earnings +28% on +26% sales for the Sep '15 quarter but fundamental concerns remain. Prior quarterly comparisons were below the +25% minimum earning guideline (C criteria). Made gradual progress since dropped from the Featured Stocks list on 11/16/12."
11/13/2015 1:09:38 PM - Gapped up on the prior session, rallying back above its 50 and 200 DMA lines. Faces resistance due to overhead supply up through the $244 area. Reported earnings +28% on +26% sales for the Sep '15 quarter but fundamental concerns remain. Prior quarterly comparisons were below the +25% minimum earning guideline (C criteria). Made gradual progress since dropped from the Featured Stocks list on 11/16/12.
8/4/2015 12:56:13 PM - Perched near its 52-week high, finding prompt support and tallying several volume-driven gains after recently violating its 50 DMA line and undercutting prior lows in the $221 area. Reported earnings +12% on +13% sales for the Jun '15 quarter and fundamental concerns remain. Prior mid-day reports cautioned members - "Prior quarterly comparisons were below the +25% minimum earning guideline (C criteria). Made gradual progress since dropped from the Featured Stocks list on 11/16/12."
7/28/2015 1:24:10 PM - Retreated from its 52-week high with a streak of volume-driven losses violating its 50 DMA line and undercutting prior lows in the $221 area. Noted with caution in prior mid-day reports - "Reported earnings +13% on +5% sales for the Mar '15 quarter and fundamental concerns remain. Prior quarterly comparisons were below the +25% minimum earning guideline (C criteria). Made gradual progress since dropped from the Featured Stocks list on 11/16/12."
7/27/2015 12:56:16 PM - Retreating from its 52-week high with today's 5th consecutive loss backed by above average volume, slumping further below its 50 DMA line and undercutting prior lows in the $221 area. Reported earnings +13% on +5% sales for the Mar '15 quarter and fundamental concerns remain. No resistance remains due to overhead supply. Noted with caution in prior mid-day reports - "Prior quarterly comparisons were below the +25% minimum earning guideline (C criteria). Made gradual progress since dropped from the Featured Stocks list on 11/16/12."
7/22/2015 1:12:12 PM - Retreating from its 52-week high and slumping back below its 50 DMA line with today's 2nd consecutive volume-driven loss. Reported earnings +13% on +5% sales for the Mar '15 quarter and fundamental concerns remain. No resistance remains due to overhead supply. Noted with caution in prior mid-day reports - "Prior quarterly comparisons were below the +25% minimum earning guideline (C criteria). Made gradual progress since dropped from the Featured Stocks list on 11/16/12."
7/15/2015 1:07:38 PM - Reversed into the red after touching a new high today. Recently found support near its 50 DMA line and rallied with volume-driven gains. Reported earnings +13% on +5% sales for the Mar '15 quarter and fundamental concerns remain. No resistance remains due to overhead supply. Noted with caution in prior mid-day reports - "Prior quarterly comparisons were below the +25% minimum earning guideline (C criteria). Made gradual progress since dropped from the Featured Stocks list on 11/16/12."
5/5/2015 1:08:02 PM - Gapped down today, slumping back below its 50 DMA line with a volume-driven loss. Reported earnings +13% on +5% sales for the Mar '15 quarter. No resistance remains due to overhead supply. Noted with caution in prior mid-day reports - "Prior quarterly comparisons were below the +25% minimum earning guideline (C criteria). Made gradual progress since dropped from the Featured Stocks list on 11/16/12."
2/23/2015 12:50:01 PM - Gapped up today hitting another new 52-week high. Reported earnings +8% on +11% sales for the Dec '14 quarter. No resistance remains due to overhead supply since noted with caution in the 1/05/15 mid-day report - Reported earnings +26% on +19% sales revenues for the Sep '14 quarter, but prior quarterly comparisons were below the +25% minimum earning guideline (C criteria). Made gradual progress since dropped from the Featured Stocks list on 11/16/12."
1/27/2015 12:47:51 PM - Gapped down today, retreating from its 52-week high following its Dec '14 quarterly earnings report. No resistance was remaining due to overhead supply when last noted with caution in the 1/05/15 mid-day report - Reported earnings +26% on +19% sales revenues for the Sep '14 quarter, but prior quarterly comparisons were below the +25% minimum earning guideline (C criteria). Made gradual progress since dropped from the Featured Stocks list on 11/16/12."
1/5/2015 1:16:35 PM - Hovering near its 52-week high with no resistance remaining due to overhead supply. Prior mid-day reports cautioned members - Reported earnings +26% on +19% sales revenues for the Sep '14 quarter, but prior quarterly comparisons were below the +25% minimum earning guideline (C criteria). Made gradual progress since dropped from the Featured Stocks list on 11/16/12."
12/18/2014 12:32:33 PM - Challenged its 52-week high with today's early gain. Encountered distributional pressure in recent weeks while retreating only slightly from its 52-week high. Prior mid-day reports cautioned members - "Stubbornly holding its ground following a volume-driven gain on 11/13/14. Reported earnings +26% on +19% sales revenues for the Sep '14 quarter, but prior quarterly comparisons were below the +25% minimum earning guideline (C criteria). Made gradual progress since dropped from the Featured Stocks list on 11/16/12."
12/17/2014 1:11:30 PM - Encountering distributional pressure in recent weeks while retreating only slightly from its 52-week high. The 11/28/14 mid-day report last noted - "Stubbornly holding its ground following a volume-driven gain on 11/13/14. Reported earnings +26% on +19% sales revenues for the Sep '14 quarter, but prior quarterly comparisons were below the +25% minimum earning guideline (C criteria). Made gradual progress since dropped from the Featured Stocks list on 11/16/12."
11/28/2014 11:30:33 AM - Hitting another new 52-week high today. Prior mid-day reports cautioned members - "Stubbornly holding its ground following a volume-driven gain on 11/13/14. Reported earnings +26% on +19% sales revenues for the Sep '14 quarter, but prior quarterly comparisons were below the +25% minimum earning guideline (C criteria). Made gradual progress since dropped from the Featured Stocks list on 11/16/12."
11/20/2014 12:50:48 PM - Perched at its 52-week high today and making its 2nd consecutive mid-day report appearance, stubbornly holding its ground following a volume-driven gain on 11/13/14. Reported earnings +26% on +19% sales revenues for the Sep '14 quarter, but prior quarterly comparisons were below the +25% minimum earning guideline (C criteria). Made gradual progress since dropped from the Featured Stocks list on 11/16/12.
11/19/2014 12:47:36 PM - Perched at its 52-week high today, stubbornly holding its ground following a volume-driven gain on 11/13/14. Reported earnings +26% on +19% sales revenues for the Sep '14 quarter, but prior quarterly comparisons were below the +25% minimum earning guideline (C criteria). Made gradual progress since dropped from the Featured Stocks list on 11/16/12.
6/10/2014 12:34:54 PM - Perched at its 52-week high today following 2 consecutive volume-driven gains. Last noted with caution in the 6/05/14 mid-day report - "Fundamentals are not a match with the +25% minimum earnings guideline (C criteria). Due to fundamental and technical weakness it was dropped from the Featured Stocks list on 11/16/12 as it managed a positive reversal after testing its 200 DMA line. Reported earnings +19% on +35% sales revenues for the Sep '12 quarter, below the +25% minimum earning guideline (C criteria), raising concerns."
6/5/2014 12:58:02 PM - Reversed into the red after hitting a new 52-week high today following a streak of 7 consecutive gains. Fundamentals are not a match with the +25% minimum earnings guideline (C criteria). Prior mid-day reports cautioned members - "Due to fundamental and technical weakness it was dropped from the Featured Stocks list on 11/16/12 as it managed a positive reversal after testing its 200 DMA line. Reported earnings +19% on +35% sales revenues for the Sep '12 quarter, below the +25% minimum earning guideline (C criteria), raising concerns."
5/13/2014 12:59:44 PM - Challenging its 52-week high with a considerable gain today. Fundamentals are not a match with the +25% minimum earning guideline (C criteria). Last noted in the 6/25/13 mid-day report with caution - "Due to fundamental and technical weakness it was dropped from the Featured Stocks list on 11/16/12 as it managed a positive reversal after testing its 200 DMA line. Reported earnings +19% on +35% sales revenues for the Sep '12 quarter, below the +25% minimum earning guideline (C criteria), raising concerns."
6/25/2013 12:44:13 PM - Churning above average volume for the past week after breaking out with a gap up gain on 6/18/13. Fundamentals are not a match with the +25% minimum earning guideline (C criteria). Last noted in the 12/13/12 mid-day report with caution - "Due to fundamental and technical weakness it was dropped from the Featured Stocks list on 11/16/12 as it managed a positive reversal after testing its 200 DMA line. Reported earnings +19% on +35% sales revenues for the Sep '12 quarter, below the +25% minimum earning guideline (C criteria), raising concerns."
12/13/2012 12:35:20 PM - Down again today with above average volume, slumping further below its 50 DMA line. The 12/07/12 mid-day report noted - "Due to fundamental and technical weakness it was dropped from the Featured Stocks list on 11/16/12 as it managed a positive reversal after testing its 200 DMA line. Reported earnings +19% on +35% sales revenues for the Sep '12 quarter, below the +25% minimum earning guideline (C criteria), raising concerns."
12/7/2012 1:02:56 PM - Down today with above average volume, slumping below its 50 DMA line. Due to fundamental and technical weakness it was dropped from the Featured Stocks list on 11/16/12 as it managed a positive reversal after testing its 200 DMA line. Reported earnings +19% on +35% sales revenues for the Sep '12 quarter, below the +25% minimum earning guideline (C criteria), raising concerns.
11/16/2012 4:27:52 PM - Reported earnings +19% on +35% sales revenues for the Sep '12 quarter, below the +25% minimuim earning guideline (C criteria), raising concerns. Managed a positive reversal after testing its 200 DMA line, finishing -8.3% off its 52-week high today. Due to fundamental and technical weakness it will be dropped from the Featured Stocks list tonight.
11/15/2012 12:26:08 PM - G - Up from earlier lows after a damaging gap down and large loss with heavy volume. Its 50 DMA line violation and weak finish which triggered a technical sell signal on the prior session. Its 200 DMA line ($117.14) defines the next chart support level.
11/15/2012 10:10:55 AM - G - Gapped down today for another large loss following its 50 DMA line violation and weak finish which triggered a technical sell signal on the prior session. Its 200 DMA line ($117.14) defines the next chart support level.
11/14/2012 4:19:44 PM - G - Volume increased to near average while a large loss today led to a violation and close below its 50 DMA line triggering a technical sell signal. Only a prompt rebound above that short-term average would help its outlook.
11/12/2012 3:55:54 PM - G - Volume totals have been below average for the past week and cooling while consolidating near its high following a special dividend on 10/23/12 when it briefly undercut its 50 DMA line.
11/6/2012 4:28:00 PM - G - Hit a new high (following a 10/23/12 special dividend) with today's gain on light volume. When noted on 10/23/12 it undercut its 50 DMA line, yet it promptly rebounded back above that important short-term average.
11/1/2012 6:16:31 PM - G - Posted a gain today with below average volume. When noted on 10/23/12 it undercut its 50 DMA line following a special dividend, yet it promptly rebounded back above that important short-term average.
10/31/2012 5:17:08 PM - G - Pulled back today and finished near the session low with above average volume behind its loss. When last noted on 10/23/12 it undercut its 50 DMA line following a special dividend, yet it promptly rebounded back above that important short-term average.
10/23/2012 6:30:51 PM - G - Gapped down today and undercut its 50 DMA line following a special dividend, yet it promptly rebounded back above that important short-term average. See latest FSU analysis for more details and a new annotated graph.
10/23/2012 1:15:04 PM - G - Gapped down today and undercut its 50 DMA line following a special dividend, yet it has promptly rebounded back above that important short-term average.
10/19/2012 4:44:04 PM - G - Traded above average volume behind a 3rd consecutive loss today. Its 50 DMA line defines near-term support to watch above recent lows in the $138 area where violations may trigger technical sell signals.
10/18/2012 4:49:35 PM - G - Churned above average volume for a 3rd session in a row today without making meaningful price progress. Its 50 DMA line defines near-term support to watch above recent lows in the $138 area where violations may trigger technical sell signals.
10/16/2012 1:07:16 PM - G - Gain today on quiet volume has it potentially poised for its best-ever close, extended from its prior base. Its 50 DMA line and prior lows define near-term support to watch in the $138 area where violations may trigger technical sell signals.
10/12/2012 4:06:51 PM - G - Gain today on average volume for its second-best close ever, extended from its prior base. Its 50 DMA line and prior lows define near-term support to watch in the $138 area where violations may trigger technical sell signals.
10/10/2012 1:34:12 PM - G - Quietly consolidating still above its "max buy" level. Its 50 DMA line and prior lows define near-term support to watch in the $138 area where violations may trigger technical sell signals.
10/4/2012 7:24:04 PM - G - Rallied further above its "max buy" level to another new 52-week high with above average volume behind today's 3rd consecutive gain. Its 50 DMA line and prior highs define near-term support to watch in the $135-136 area on pullbacks.
10/3/2012 1:21:08 PM - G - Color code is changed to green after rising back above its "max buy" level with today's 2nd consecutive gain. Its 50 DMA line and prior highs define near-term support to watch in the $135-136 area on pullbacks.
9/27/2012 12:58:09 PM - Y - Consolidating below its "max buy" level with volume running at an above average pace behind today's 2nd consecutive loss. Its 50 DMA line and prior highs define near-term support to watch on pullbacks.
9/26/2012 12:26:53 PM - Y - Pulling back today and its color code is changed to yellow after retreating below its "max buy" level. Its 50 DMA line defines support to watch on pullbacks.
9/25/2012 12:17:05 PM - G - Trading up today with volume running at an above average pace, getting extended from its prior base. Its 50 DMA line defines support to watch on pullbacks.
9/21/2012 6:06:15 PM - G - Color code is changed to green again after rallying back above its "max buy" level. Its 50 DMA line defines support to watch on pullbacks.
9/20/2012 6:40:43 PM - Y - Color code is changed to yellow after retreating below "max buy" level with losses on light volume. See latest FSU analysis for more details and a new annotated graph.
9/19/2012 6:22:24 PM - G - Holding its ground near its all-time high. Prior highs along with its 50 DMA line define near-term chart support to watch on pullbacks.
9/12/2012 4:56:19 PM - G - Hovering near its all-time high recently with volume totals cooling. Prior high near $136 defines near-term chart support to watch on pullbacks.
9/7/2012 4:14:46 PM - G - Finished above its "max buy" level and near the session high with a gain today on near average volume, and its color code is changed to green. Prior high near $136 defines near-term chart support to watch on pullbacks.
9/6/2012 5:15:25 PM - Y - Gain today on near average volume for a best-ever close. Prior high near $136 defines near-term chart support to watch on pullbacks.
9/4/2012 4:27:37 PM - Y - Hovering near its 52-week high. Prior high near $136 defines near-term chart support. Disciplined investors always limit losses if ever any stock falls -7% from their purchase price.
8/27/2012 12:45:26 PM - Y - Hit a new 52-week high today and challenged its "max buy" level, however it is now trading well off its earlier highs. Disciplined investors do not chase extended stocks and they always limit losses if ever any stock falls -7% from their purchase price.
8/23/2012 2:49:14 PM - Y - Holding its ground today perched just above its pivot point and only -1.9% off its 52-week high. Volume totals have cooled since its gain on 8/17/12 triggered a technical buy signal. Disciplined investors limit losses if ever any stock falls -7% from their purchase price.
8/17/2012 4:40:59 PM - Y - Today's 7th consecutive gain helped it hit a new 52-week high and trade above the new pivot point cited based on its 7/02/12 high plus 10 cents. The considerable gain backed by +86% above average volume clinched a new (or add-on) technical buy signal. See the latest FSU analysis for more details and a new annotated graph.
8/17/2012 12:35:42 PM - Y - Today's 7th consecutive gain helped it hit a new 52-week high and trade above the new pivot point cited based on its 7/02/12 high plus 10 cents. A strong finish above its point point with a gain backed by at least +40% above average volume may clinch a new (or add-on) technical buy signal.
8/16/2012 3:56:24 PM - Y - Color code is changed to yellow with new pivot point cited based on its 7/02/12 high plus 10 cents. Subsequent volume-driven gains above its point point may trigger a new (or add-on) technical buy signal. Today's 6th consecutive gain has it rallying within close striking distance of its best-ever close.
8/14/2012 6:03:36 PM - G - Inching above its 50 DMA line with light volume behind today's 4th consecutive gain. Recent lows in the $117-118 are define near-term support above its 200 DMA line.
8/7/2012 10:56:59 AM - G - Reported earnings +55% on +42% sales revenues for the quarter ended June 30, 2012 versus the year ago period. Gapped up today and traded above its 50 DMA line. Recent lows in the $117-118 are define near-term support above its 200 DMA line.
8/3/2012 12:59:18 PM - G - Small gap up and gain today on light volume. A rebound above its 50 DMA line is needed for its technical stance and outlook to improve. Meanwhile, recent lows in the $117-118 are define near-term support above its 200 DMA line.
8/1/2012 11:42:52 AM - G - Still holding its ground since a damaging loss on 7/24/12 with heavy volume violated its 50 DMA line triggering a technical sell signal. A rebound above its 50 DMA line is needed for its technical stance and outlook to improve. Meanwhile, recent lows in the $117-118 are define near-term support above its 200 DMA line.
7/25/2012 5:51:08 PM - G - Held its ground today following a damaging loss on 7/24/12 with heavy volume that violated its 50 DMA line triggering a technical sell signal.
7/24/2012 3:43:40 PM - G - Color code is changed to green while a damaging loss today with heavy volume violated its 50 DMA line triggering a technical sell signal.
7/23/2012 6:51:33 PM - Y - Still finding support above its 50 DMA line after a recent breakout attempt lacked volume conviction. A damaging violation of that short-term average would raise concerns and trigger a technical sell signal.
7/18/2012 6:16:34 PM - Y - Found support at its 50 DMA line after a recent breakout attempt lacked volume conviction. See the latest FSU analysis for more details and a new annotated graph.
7/13/2012 3:21:10 PM - Y - Halted its slide today at its 50 DMA line which defines important support to watch. The 6/29/12 gain above its pivot point was backed by only +32% above average volume, below the minimum threshold need to trigger a proper new (or add-on) technical buy signal.
7/10/2012 4:59:03 PM - Y - Reversed early gains today and closed near the session low with a loss on light volume. It has held its ground since recently noted when its 6/29/12 gain above its pivot point was backed by only +32% above average volume, below the minimum threshold need to trigger a proper new (or add-on) technical buy signal. Its 50 DMA line defines important support to watch.
7/5/2012 1:08:51 PM - Y - Holding its ground since last noted when its 6/29/12 gain above its pivot point was backed by only +32% above average volume, below the minimum threshold need to trigger a proper new (or add-on) technical buy signal. Its 50 DMA line defines important support to watch.
6/29/2012 6:14:41 PM - Y - Today's gain above its pivot point was backed by only +32% above average volume, below the minimum threshold need to trigger a proper new (or add-on) technical buy signal. Its 50 DMA line defines important support to watch.
6/25/2012 1:08:40 PM - Y - Today's 3rd consecutive loss has it pulling back near its 50 DMA line. It is still perched within -5.7% of its all-time high. Subsequent volume-driven gains above the pivot point may trigger a new (or add-on) technical buy signal. Its prior low ($118.43 on 5/18/12) defines the next important near-term chart support level to watch below its 50 DMA line.
6/20/2012 1:22:21 PM - Y - Today's 3rd consecutive gain has it poised for a best ever close and perched within close striking distance of its all-time high. Color code was changed to yellow with new pivot point cited. Subsequent volume-driven gains above the pivot point may trigger a new (or add-on) technical buy signal. Its prior low ($118.43 on 5/18/12) defines the next important near-term chart support level to watch.
6/18/2012 5:04:06 PM - Y - Consolidating above important support at its 50 DMA line while perched within close striking distance of its all-time high. Color code is changed to yellow with new pivot point cited. Subsequent volume-driven gains above the pivot point may trigger a new (or add-on) technical buy signal. Its prior low ($118.43 on 5/18/12) defines the next important near-term chart support level to watch. See the latest FSU analysis for more details and a new annotated graph.
6/13/2012 6:20:07 PM - G - Quietly consolidating above important support at its 50 DMA line while perched within close striking distance of its all-time high. Its prior low ($118.43 on 5/18/12) defines the next important near-term chart support level to watch.
6/6/2012 6:00:26 PM - G - Considerable gain today on near average volume, rallying from important support at its 50 DMA line. Its prior low ($118.43 on 5/18/12) defines the next important near-term chart support level to watch.
6/4/2012 1:21:13 PM - G - Slumping today near important support at its 50 DMA line. Its prior low ($118.43 on 5/18/12) defines the next important near-term chart support level to watch.
5/30/2012 2:07:49 PM - G - Pulling back on lighter volume today following a gain on the prior session backed by above average volume. Recently found prompt support at its 50 DMA line and near prior highs.
5/29/2012 4:53:09 PM - G - Gain today was backed by above average volume. Recently found prompt support at its 50 DMA line and near prior highs.
5/23/2012 6:41:55 PM - G - Held its ground today after 2 solid gains backed by above average volume, a sign of prompt support at its 50 DMA line and near prior highs. Poor market conditions (M criteria) argue against making any new buying efforts until a new confirmed rally by at least one of the major averages with a solid follow-through day. See the latest FSU analysis for more details and a new annotated graph.
5/23/2012 4:55:30 PM - G - Held its ground today after 2 solid gains backed by above average volume, a sign of prompt support at its 50 DMA line and near prior highs. Poor market conditions (M criteria) argue against making any new buying efforts until a new confirmed rally by at least one of the major averages with a solid follow-through day. See the latest FSU analysis for more details and a new annotated graph.
5/22/2012 4:27:33 PM - G - Two solid gains backed by above average volume were a sign of prompt support at its 50 DMA line and near prior highs which also define important chart support. Poor market conditions (M criteria) argue against making any new buying efforts until a new confirmed rally by at least one of the major averages with a solid follow-through day.
5/21/2012 4:44:57 PM - G - Today's solid gain backed by above average volume was a sign of prompt support at its 50 DMA line and near prior highs which also define important chart support. Poor market conditions (M criteria) argue against making any new buying efforts until a new confirmed rally by at least one of the major averages with a solid follow-through day.
5/17/2012 5:41:34 PM - G - Today's loss with above average volume has it testing support at its 50 DMA line and near prior highs which also define important chart support. Poor market conditions (M criteria) argue against making any new buying efforts until a new confirmed rally by at least one of the major averages with a solid follow-through day.
5/15/2012 8:29:39 PM - G - Consolidating since hitting a new all-time high with a volume-driven gain on 5/08/12. It has quietly pulled back below its "max buy" level, however poor market conditions (M criteria) argue against making any new buying efforts until a new confirmed rally by at least one of the major averages with a solid follow-through day. Prior highs in the $118-121 area define chart support to watch on pullbacks.
5/8/2012 12:31:04 PM - G - Reversed into the red after hitting a new all-time high with today's earlier gains. Reported earnings +72% on +39% sales revenues for the quarter ended March 31, 2012 versus the year ago period. Extended from its prior base and above its "max buy" level. Prior highs in the $118-121 area define chart support to watch on pullbacks.
5/7/2012 12:59:04 PM - G - Hovering near its all-time high, extended from its prior base and above its "max buy" level. Prior highs in the $118-121 area define initial chart support to watch on pullbacks.
5/1/2012 6:52:02 PM - G - Color code is changed to green after rallying beyond its "max buy" level with above average volume behind its 4th gain in the span of 5 sessions. Prior highs in the $118-121 area define initial chart support to watch on pullbacks.
4/25/2012 1:29:42 PM - Y - Small gap up today, hitting new 52-week and all-time highs and approaching the previously cited "max buy" level. Solid gain on 4/20/12 with +75% above average volume met the guideline for a proper technical buy signal. The encouraging sign of fresh institutional buying demand may signal the beginning of a meaningful leg up, but keep in mind 3 out of 4 stocks follow the direction of the major averages (M criteria) and the market has recently been pulling back under distributional pressure. Prior highs in the $118-121 area define initial chart support to watch on pullbacks.
4/23/2012 2:49:55 PM - Y - Pulling back today. On the prior session it hit new 52-week and all-time highs with +75% above average volume, meeting the guideline for a proper technical buy signal. The encouraging sign of fresh institutional buying demand may signal the beginning of a meaningful leg up, but keep in mind 3 out of 4 stocks follow the direction of the major averages (M criteria) and the market has recently been pulling back under distributional pressure. Subsequent deterioration below its 50 DMA line or prior lows ($110.60 on 3/20/12) would trigger more worrisome technical sell signals.
4/20/2012 1:47:09 PM - Y - Gapped up today hitting new 52-week and all-time highs with volume running at an above average pace. The volume-driven gain (not yet the +40% above average volume needed to meet the minimum guideline for a proper technical buy signal) is an encouraging sign of fresh institutional buying demand that may signal the beginning of a meaningful leg up. Subsequent deterioration below its 50 DMA line or prior lows ($110.60 on 3/20/12) would trigger more worrisome technical sell signals.
4/17/2012 5:56:43 PM - Y - Rising from its 50 DMA line and it finished today at a best-ever close but its gain came with below average volume. Volume-driven gains for a new high close would be an encouraging sign of fresh institutional buying demand that could lead to a meaningful advance. Meanwhile, deterioration below prior lows ($110.60 on 3/20/12) would trigger a more worrisome technical sell signal.
4/12/2012 3:34:03 PM - Y - Gains came with light volume as it rebounded above its 50 DMA line helping its outlook improve, and the color code is changed to yellow again. Volume-driven gains for a new high close would be an encouraging sign of fresh institutional buying demand that could lead to a meaningful advance. Meanwhile, deterioration below prior lows ($110.60 on 3/20/12) would trigger a more worrisome technical sell signal.
4/10/2012 1:11:24 PM - G - Slumping further below its latest pivot point cited, not having triggered a new buy signal. Color code is changed to green as concerns are raised while violating its 50 DMA line today. Only a prompt rebound would help its outlook improve, meanwhile, further deterioration below prior lows ($110.60 on 3/20/12) may trigger a more worrisome technical sell signal.
4/5/2012 3:46:16 PM - Y - Churning above average volume today without meaningful price progress, it remains below its latest pivot point cited, not having triggered a new buy signal. Its 50 DMA line defines important chart support to watch, and a violation of that important short-term average would trigger a technical sell signal.
3/30/2012 4:35:12 PM - Y - Up today on light volume after enduring mild distributional pressure this week. It remains below its latest pivot point cited, not having triggered a new buy signal. Its 50 DMA line defines important chart support to watch, and a violation of that important short-term average would trigger a technical sell signal. See the latest FSU analysis for more details and a new annotated graph.
3/26/2012 10:40:05 PM - Y - Up today on near average volume, yet it remains below its latest pivot point after encountering distributional pressure. Its recent low ($111.03 on 3/06/12) and its 50 DMA line define important chart support to watch above prior highs in the $102 area.
3/19/2012 1:28:05 PM - Y - Sputtering since its 3/06/12 gap down, and it remains below its latest pivot point after encountering distributional pressure. Its recent low ($111.03 on 3/06/12) and its 50 DMA line define important chart support to watch above prior highs in the $102 area.
3/12/2012 6:18:17 PM - Y - Holding its ground since its 3/06/12 gap down, sputtering below its latest pivot point after encountering distributional pressure. Its 50 DMA line defines important chart support to watch above prior highs in the $102 area.
3/6/2012 11:12:18 AM - Y - Gapped down today, encountering more distributional pressure. Its 50 DMA line defines important chart support to watch above prior highs in the $102 area.
3/2/2012 1:12:13 PM - Y - A volume-driven gain for a strong close above it pivot point did not confirm a new (or-add on) technical buy signal. Instead, it is encountering distributional pressure after the previously noted advanced "3-weeks tight" base pattern. Prior highs near $102 define the initial support level to watch above its 50 DMA line.
2/29/2012 12:41:45 PM - Y - It formed an advanced "3-weeks tight" base pattern and its color code is changed to yellow with a new pivot point cited based on its 2/13/12 high plus 10 cents. A volume-driven gain for a strong close above it pivot point may confirm a new (or-add on) technical buy signal. Prior highs near $102 define the initial support level to watch above its 50 DMA line.
2/24/2012 12:57:45 PM - G - Still hovering near its all-time high, stubbornly holding its ground, on the cusp of completing an advanced "3-weeks tight" base pattern. Prior highs near $102 define the initial support level to watch above its 50 DMA line.
2/21/2012 1:40:29 PM - G - Still hovering near its all-time high, stubbornly holding its ground, extended from its prior base after a spurt of volume-driven gains. Prior highs near $102 define the initial support level to watch above its 50 DMA line.
2/14/2012 6:32:48 PM - G - Hovering near its all-time high, extended from its prior base after a spurt of volume-driven gains. Prior highs near $102 define the initial support level to watch above its 50 DMA line.
2/10/2012 6:02:59 PM - G - Extended from its prior base after a spurt of volume-driven gains into new high territory. Prior highs near $102 define the initial support level to watch above its 50 DMA line. See the latest FSU analysis for more details and a new annotated graph.
2/8/2012 1:11:58 PM - G - Color code is changed to green while trading up further above its "max buy" level today after a considerable volume-driven gain into new high territory. No overhead supply remains to act as resistance. Prior highs near $102 define the initial support level to watch above its 50 DMA line.
2/7/2012 12:50:54 PM - Y - Considerable volume-driven gain today for a new all-time high. No overhead supply remains to act as resistance. Prior highs near $102 define the initial support level to watch above its 50 DMA line.
2/6/2012 4:32:07 PM - Y - Reversed into the red today after reaching another new all-time high. No overhead supply remains to act as resistance. Prior highs near $102 define the initial support level to watch above its 50 DMA line.
2/3/2012 6:48:43 PM - Y - Up today with lighter volume for another new all-time high. It has rallied near its "max buy" level after volume-driven gains this week triggered a technical buy signal. No overhead supply remains to act as resistance. Prior highs near $102 define the initial support level to watch above its 50 DMA line.
2/2/2012 2:48:01 PM - Y - Quietly holding its ground today near its all-time high and "max buy" level after volume-driven gains this week triggered a technical buy signal. No overhead supply remains to act as resistance. Prior highs near $102 define the initial support level to watch above its 50 DMA line.
2/1/2012 3:32:15 PM - Y - Gapped up today, rallying near its "max buy" level after triggering a technical buy signal with its considerable gain backed by more than 2 times average volume noted on the prior session. No overhead supply remains to act as resistance. Prior highs near $102 define the initial support level to watch above its 50 DMA line.
1/31/2012 4:02:22 PM - Y - Rallied above its pivot point for a solid gain today backed by sufficient volume to trigger a technical buy signal. No overhead supply remains to act as resistance. Recent lows in the $92 area define the next important support level to watch if it slumps below its 50 DMA line.
1/27/2012 4:53:23 PM - Y - Held its ground since its 1/23/12 gain with above average volume while challenging its 52-week high and approaching its pivot point. No overhead supply remains to act as resistance Recent lows in the $92 area define the next important support level to watch if it slumps below its 50 DMA line.
1/23/2012 12:25:20 PM - Y - Announced plans to acquire AmSafe Global Holdings Inc for a total purchase price of approximately $750 million in cash. Spiked higher today with above average volume behind its gain while challenging its 52-week high and approaching its pivot point. No overhead supply remains to act as resistance Recent lows in the $92 area define the next important support level to watch if it slumps below its 50 DMA line.
1/19/2012 5:37:14 PM - Y - Small gain today with average volume. No overhead supply remains to act as resistance and subsequent volume-driven gains for new highs may help it clear a base-on-base type pattern. Recent lows in the $92 area define the next important support level to watch if it slumps below its 50 DMA line.
1/13/2012 4:57:58 PM - Y - No overhead supply remains to act as resistance and volume totals have been cooling while holding its ground. Volume driven gains for new highs may help it clear a base-on-base type pattern. Recent lows in the $90 area define the next nearby support level to watch above its 200 DMA line.
1/10/2012 5:49:48 PM - Y - Gain today on light volume for its best-ever close. No overhead supply remains to act as resistance. Color code was changed to yellow with new pivot point cited based on its 52-week high plus 10 cents. Volume driven gains for new highs may help it clear a base-on-base type pattern. Recent lows in the $90 area define the next nearby support level to watch above its 200 DMA line.
1/10/2012 2:47:44 PM - Y - Today's gap up gain has it poised for a best ever close with no overhead supply remaining to act as resistance. Color code is changed to yellow with new pivot point cited based on its 52-week high plus 10 cents. Volume driven gains for new highs may help it clear a base-on-base type pattern. Recent lows in the $90 area define the next nearby support level to watch above its 200 DMA line.
1/5/2012 4:47:05 PM - G - Promptly rebounded above its 50 DMA line today with a solid gain on higher volume, and its finish near the session high was an encouraging sign of support. Its prior loss on more than 2 times average volume triggered a technical sell signal. Recent lows in the $90 area define the next nearby support level to watch. See latest FSU analysis for more details and a new annotated graph.
1/4/2012 7:59:58 PM - G - Down further today on lighter volume after its prior loss on more than 2 times average volume triggered a technical sell signal. See latest FSU analysis for more details and a new annotated graph.
1/3/2012 8:08:22 PM - G - Erased early gains today and violated its 50 DMA line, closing near the session low. Its loss on more than 2 times average volume triggered a technical sell signal, and the color code is changed to green after the worrisome sign of distributional pressure.
12/28/2011 5:03:33 PM - Y - Finished near the session low today with a considerable loss on higher (yet still below average) volume. Its 50 DMA line defines near-term support above recent lows where subsequent violations would trigger technical sell signals.
12/27/2011 1:09:37 PM - Y - Volume totals have been cooling while holding its ground perched within striking distance of a best-ever close. Its 50 DMA line defines near-term support above recent lows where subsequent violations would trigger technical sell signals.
12/20/2011 2:26:25 PM - Y - Small gap up gain today on lighter volume while perched within striking distance of a best-ever close. Its 50 DMA line defines near-term support above recent lows where subsequent violations would trigger technical sell signals.
12/15/2011 5:52:56 PM - Y - Small gain today on lighter volume halted a streak of 3 consecutive losses. Its 50 DMA line defines near-term support above recent lows where subsequent violations would trigger technical sell signals.
12/9/2011 3:44:06 PM - Y - Up today on light volume, trading within close striking distance of its best-ever close. A subsequent slump below the recent low and its 50 DMA line would trigger technical sell signals. See the latest FSU analysis for more details and a new annotated graph.
12/6/2011 5:32:15 PM - Y - Small loss today on light volume. It stayed well above its 50 DMA line during its recent consolidation. A subsequent slump below the recent low and its 50 DMA line would trigger technical sell signals. See the latest FSU analysis for more details and a new annotated graph.
11/30/2011 11:57:21 AM - Y - Gapped up today, and it stayed well above its 50 DMA line during its recent consolidation. A subsequent slump below the recent low and its 50 DMA line would trigger technical sell signals.
11/28/2011 8:42:14 PM - Y - Posted a solid gain today with above average volume. On 11/17/11 it marked its top with a negative reversal for a loss on heavy volume. Its 50 DMA line defines near-term support to watch.
11/25/2011 3:37:13 PM - Y - Held its ground today with a small gain on light volume. After hitting a new 52-week high on 11/17/11 it marked its top with a negative reversal for a loss on heavy volume. Its 50 DMA line defines near-term support to watch.
11/18/2011 5:48:01 PM - Y - Held its ground today following a negative reversal on the prior session after hitting a new 52-week high. A volume-driven gain on 11/08/11 helped it break out from a 19-week base. Reported earnings +42% on +54% sales revenues for the quarter ended September 30, 2011.
11/17/2011 1:04:29 PM - Y - Negatively reversed after hitting a new 52-week high today. A volume-driven gain on 11/08/11 helped it break out from a 19-week base. Reported earnings +42% on +54% sales revenus for the quarter ended September 30, 2011.
11/16/2011 6:03:45 PM - Y - Still hovering near its 52-week high today, holding its ground above its pivot point but below its "max buy" level. A volume-driven gain on 11/08/11 helped it break out from a 19-week base. Due to report earnings on Thursday, November 17th for the quarter ended September 30, 2011.
11/11/2011 4:35:05 PM - Y - Hovering near its 52-week high today. A volume-driven gain on 11/08/11 helped it break out from a 19-week base. Due to report earnings on Thursday, November 17th for the quarter ended September 30, 2011. See the latest FSU analysis for more details and a new annotated graph.
11/9/2011 10:38:31 PM - Y - Hit a new 52-week high on the prior session with a volume-driven gain helping it break out from a 19-week base. While consolidating today above prior highs it was featured in yellow (read here) with pivot point based on its 7/07/11 high plus 10 cents. Reported earnings +38% on +52% sales revenues for the quarter ended June 30, 2011 versus the year ago period. Prior earnings comparisons were right at the +25% guideline and it has maintained a strong annual earnings history (A criteria). Due to report earnings for the September period soon. See the latest FSU analysis for more details and a new annotated graph.
11/9/2011 1:26:12 PM - Y - Hit a new 52-week high on the prior session with a volume-driven gain helping it break out from a 19-week base, and it is consolidating today above prior highs. Color code is changed to yellow with pivot point based on its 7/07/11 high plus 10 cents. Reported earnings +38% on +52% sales revenues for the quarter ended June 30, 2011 versus the year ago period. Prior earnings comparisons were right at the +25% guideline and it has maintained a strong annual earnings history (A criteria). Due to report earnings for the September period soon. In recent years it has rebounded and rallied to new highs following a deep consolidation after it was dropped from the Featured Stocks list 1/17/08.
8/24/2011 1:09:05 PM - Remains below its 50 DMA line after damaging losses with above average volume. Reported earnings +38% on +52% sales revenues for the quarter ended June 30, 2011 versus the year ago period. Prior comparisons were just below the +25% guideline following a streak of weak or negative comparisons. In recent years it has rebounded and rallied to new highs following a deep consolidation after it was dropped from the Featured Stocks list 1/17/08.
8/22/2011 12:37:38 PM - Gapped up today, but its remains below its 50 and 200 DMA lines after 2 damaging losses with above average volume. It was noted in the 7/01/11 mid-day report when hitting new 52-week and all-time highs with multiple gains backed by above average volume above prior resistance in the $85 area - "No resistance remaining due to overhead supply. Recent earnings increases have been just below the +25% guideline in quarterly comparisons through March '11 while sales revenues increases showed acceleration following a streak of weak or negative comparisons. In recent years it has rebounded and rallied to new highs following a deep consolidation after it was dropped from the Featured Stocks list 1/17/08."
8/16/2011 1:11:24 PM - Rebounded above its 50 and 200 DMA lines after damaging distributional pressure in recent weeks briefly undercut its 200 DMA line and prior chart lows. Last noted in the 7/01/11 mid-day report when hitting new 52-week and all-time highs with multiple gains backed by above average volume above prior resistance in the $85 area - "No resistance remaining due to overhead supply. Recent earnings increases have been just below the +25% guideline in quarterly comparisons through March '11 while sales revenues increases showed acceleration following a streak of weak or negative comparisons. In recent years it has rebounded and rallied to new highs following a deep consolidation after it was dropped from the Featured Stocks list 1/17/08."
7/1/2011 1:19:01 PM - Hitting new 52-week and all-time highs this week with multiple gains backed by above average volume in recent weeks helping it rally above prior resistance in the $85 area. Prior mid-day reports noted - "No resistance remaining due to overhead supply. Recent earnings increases have been just below the +25% guideline in quarterly comparisons through March '11 while sales revenues increases showed acceleration following a streak of weak or negative comparisons. In recent years it has rebounded and rallied to new highs following a deep consolidation after it was dropped from the Featured Stocks list 1/17/08."
6/23/2011 12:42:26 PM - Pulling back today after touching another new 52-week and all-time high on the prior session and then reversing, following a streak of 4 consecutive small gains backed by above average volume. Prior mid-day reports noted - "No resistance remaining due to overhead supply. Recent earnings increases have been just below the +25% guideline in quarterly comparisons through March '11 while sales revenues increases showed acceleration following a streak of weak or negative comparisons. In recent years it has rebounded and rallied to new highs following a deep consolidation after it was dropped from the Featured Stocks list 1/17/08."
6/22/2011 1:19:23 PM - Hitting yet another new 52-week and all-time high today with its 5th consecutive small gain backed by above average volume. The 6/20/11 mid-day report noted - "No resistance remaining due to overhead supply. Recent earnings increases have been just below the +25% guideline in quarterly comparisons through March '11 while sales revenues increases showed acceleration following a streak of weak or negative comparisons. In recent years it has rebounded and rallied to new highs following a deep consolidation after it was dropped from the Featured Stocks list 1/17/08."
6/20/2011 1:03:00 PM - Hit a new 52-week and all-time high today with no resistance remaining due to overhead supply. Recent earnings increases have been just below the +25% guideline in quarterly comparisons through March '11 while sales revenues increases showed acceleration following a streak of weak or negative comparisons. In recent years it has rebounded and rallied to new highs following a deep consolidation after it was dropped from the Featured Stocks list 1/17/08.
6/16/2011 12:34:17 PM - Consolidating back and forth near its 50 DMA line since last noted in the 5/19/11 mid-day report- "Perched within close striking distance of its all-time high with no resistance due to overhead supply. Recent quarterly comparisons show sales and earnings increases with acceleration following a streak of weak or negative comparisons. In recent years it has rebounded and rallied to new highs following a deep consolidation after it was dropped from the Featured Stocks list 1/17/08."
5/19/2011 1:13:53 PM - Noted repeatedly in recent mid-day reports - "Perched within close striking distance of its all-time high with no resistance due to overhead supply. Recent quarterly comparisons show sales and earnings increases with acceleration following a streak of weak or negative comparisons. In recent years it has rebounded and rallied to new highs following a deep consolidation after it was dropped from the Featured Stocks list 1/17/08."
5/11/2011 1:30:34 PM - Still holding its ground and churning above average volume without making meaningful price progress. It was noted in 2 mid-day reports last week - "Perched within close striking distance of its all-time high with no resistance due to overhead supply. Recent quarterly comparisons show sales and earnings increases with acceleration following a streak of weak or negative comparisons. In recent years it has rebounded and rallied to new highs following a deep consolidation after it was dropped from the Featured Stocks list 1/17/08."
5/10/2011 1:04:23 PM - Holding its ground and churning above average volume since it was noted in 2 mid-day reports last week - "Perched within close striking distance of its all-time high with no resistance due to overhead supply. Recent quarterly comparisons show sales and earnings increases with acceleration following a streak of weak or negative comparisons. In recent years it has rebounded and rallied to new highs following a deep consolidation after it was dropped from the Featured Stocks list 1/17/08."
5/3/2011 1:34:39 PM - The 5/02/11 mid-day report noted - "Perched within close striking distance of its all-time high with no resistance due to overhead supply. Recent quarterly comparisons show sales and earnings increases with acceleration following a streak of weak or negative comparisons. In recent years it has rebounded and rallied to new highs following a deep consolidation after it was dropped from the Featured Stocks list 1/17/08."
5/2/2011 1:23:21 PM - Perched within close striking distance of its all-time high with no resistance due to overhead supply. Recent quarterly comparisons show sales and earnings increases with acceleration following a streak of weak or negative comparisons. In recent years it has rebounded and rallied to new highs following a deep consolidation after it was dropped from the Featured Stocks list 1/17/08.
2/7/2011 1:42:30 PM - Considerable gain after gapping up today for a new all-time high. Rising after clearing all resistance due to overhead supply, it was last noted in the 1/11/11 mid-day report - "Its FY '10 earnings showed a downturn, a flaw with respect to the A criteria, while the 2 latest quarters ended June and Sept '09 showed sales and earnings increases below the minimum guidelines. Based on weak technical action TDG was dropped from the Featured Stocks list 1/17/08."
1/11/2011 1:57:15 PM - Perched near all-time high territory since rising clear of all resistance due to overhead supply. Prior mid-day reports noted - "Its FY '10 earnings showed a downturn, a flaw with respect to the A criteria, while the 2 latest quarters ended June and Sept '09 showed sales and earnings increases below the minimum guidelines. Based on weak technical action TDG was dropped from the Featured Stocks list 1/17/08."
1/5/2011 2:22:33 PM - Still steadily advancing into new all-time high territory since rising clear of all resistance due to overhead supply. The 12/13/10 mid-day report noted - "Its FY '10 earnings showed a downturn, a flaw with respect to the A criteria, while the 2 latest quarters ended June and Sept '09 showed sales and earnings increases below the minimum guidelines. Based on weak technical action TDG was dropped from the Featured Stocks list 1/17/08."
12/13/2010 1:21:29 PM - It has steadily been advancing into new all-time high territory in recent months since rising clear of all resistance due to overhead supply. Its FY '10 earnings showed a downturn, a flaw with respect to the A criteria, while the 2 latest quarters ended June and Sept '09 showed sales and earnings increases below the minimum guidelines. Based on weak technical action TDG was dropped from the Featured Stocks list 1/17/08.
1/22/2010 1:47:48 PM - It has steadily been advancing since breaking out in early-August 2009 and has wedged into new all-time high territory in recent weeks, rising clear of all resistance due to overhead supply. Its FY '10 earnings showed a downturn, a flaw with respect to the A criteria, while the 2 latest quarters ended June and Sept '09 showed sales and earnings increases below the minimum guidelines. Based on weak technical action TDG was dropped from the Featured Stocks list 1/17/08.
1/18/2008 - Loss on above average volume yesterday, falling under its 200 DMA line. Concerns were raised by the recent violation of support at its 50 DMA line and breach of prior chart highs in the $47-48 area. Based on the weak technical action it was dropped from the Featured Stocks list 1/17/08. Noted on 12/13/07 as a small gap down and close under its October high closes technically negated its recent breakout. After sinking below its 50 DMA line on 12/14/07 it has encountered resistance at that important short term average and failed on each attempt to rally and close above it. On 11/19/07 a considerable gain on very heavy volume helped it clear its latest base. The Featured Stock Update section in the 10/05/07 CANSLIM.net After Market Update provided analysis and a new annotated graph (read here).
1/17/2008 5:46:36 PM - G - Loss on above average volume today, falling under its 200 DMA line. Concerns were raised by the recent violation of support at its 50 DMA line and breach of prior chart highs in the $47-48 area. Based on the weak technical action it will be dropped from the Featured Stocks list tonight. Noted on 12/13/07 as a small gap down and close under its October high closes technically negated its recent breakout. After sinking below its 50 DMA line on 12/14/07 it has encountered resistance at that important short term average and failed on each attempt to rally and close above it. On 11/19/07 a considerable gain on very heavy volume helped it clear its latest base. The Featured Stock Update section in the 10/05/07 CANSLIM.net After Market Update provided analysis and a new annotated graph (read here).
1/15/2008 5:36:24 PM - G - Halted its recent slide right at its 200 DMA line. Concerns were raised by the recent violation of support at its 50 DMA line and breach of prior chart highs in the $47-48 area. Noted on 12/13/07 as a small gap down and close under its October high closes technically negated its recent breakout. After sinking below its 50 DMA line on 12/14/07 it has encountered resistance at that important short term average and failed on each attempt to rally and close above it. On 11/19/07 a considerable gain on very heavy volume helped it clear its latest base. The Featured Stock Update section in the 10/05/07 CANSLIM.net After Market Update provided analysis and a new annotated graph (read here).
1/14/2008 5:23:13 PM - G - Positive reversal today for a tiny gain on average volume after sinking below its October low and 200 DMA line intra-day. After sinking below its 50 DMA line on 12/14/07 it has encountered resistance at that important short term average and failed on each attempt to rally and close above it. High ranked company in the Aerospace/Defense Equipment Group which is now ranked 56th on the Industry Group Rankings (1-197). Concerns were raised by the recent violation of support at its 50 DMA line and breach of prior chart highs in the $47-48 area. Noted on 12/13/07 as a small gap down and close under its October high closes technically negated its recent breakout. On 11/19/07 a considerable gain on very heavy volume helped it clear its latest base. The Featured Stock Update section in the 10/05/07 CANSLIM.net After Market Update provided analysis and a new annotated graph (read here).
1/9/2008 7:44:14 PM - G - Third consecutive loss on above average volume, sinking below its December low and testing its 200 DMA line. After sinking below its 50 DMA line on 12/14/07 it encountered resistance at that important short term average and failed to rally above it. High ranked company in the Aerospace/Defense Equipment Group which is now ranked 55th on the Industry Group Rankings (1-197). Concerns were raised by the recent violation of support at its 50 DMA line and breach of prior chart highs in the $47-48 area. Noted on 12/13/07 as a small gap down and close under its October high closes technically negated its recent breakout. On 11/19/07 a considerable gain on very heavy volume helped it clear its latest base. The Featured Stock Update section in the 10/05/07 CANSLIM.net After Market Update provided analysis and a new annotated graph (read here).
1/8/2008 1:59:47 PM - G - Second consecutive loss on above average volume, sinking below its December low, raising more concerns. After sinking below its 50 DMA line on 12/14/07 it encountered resistance at that important short term average and failed to rally above it. High ranked company in the Aerospace/Defense Equipment Group which is now ranked 49th on the Industry Group Rankings (1-197), satisfying the L criteria. Concerns were raised by the recent violation of support at its 50 DMA line and breach of prior chart highs in the $47-48 area. Noted on 12/13/07 as a small gap down and close under its October high closes technically negated its recent breakout. On 11/19/07 a considerable gain on very heavy volume helped it clear its latest base. The Featured Stock Update section in the 10/05/07 CANSLIM.net After Market Update provided analysis and a new annotated graph (read here).
1/3/2008 5:58:44 PM - G - Traded above its 50 DMA line intra-day, but it encountered resistance there again and closed in the lower half of its intra-day range. High ranked company in the Aerospace/Defense Equipment Group which is ranked 35th on the Industry Group Rankings (1-197), satisfying the L criteria. Concerns were raised by the recent violation of support at its 50 DMA line and breach of prior chart highs in the $47-48 area. Noted on 12/13/07 as a small gap down and close under its October high closes technically negated its recent breakout. On 11/19/07 a considerable gain on very heavy volume helped it clear its latest base. The Featured Stock Update section in the 10/05/07 CANSLIM.net After Market Update provided analysis and a new annotated graph (read here).
1/2/2008 7:23:13 PM - G - High ranked company in the Aerospace/Defense Equipment Group which is ranked 28th on the Industry Group Rankings (1-197), satisfying the L criteria. Encountering resistance under its 50 DMA line. Concerns were raised by the recent violation of support at its 50 DMA line and breach of prior chart highs in the $47-48 area. Noted on 12/13/07 as a small gap down and close under its October high closes technically negated its recent breakout. On 11/19/07 a considerable gain on very heavy volume helped it clear its latest base. The Featured Stock Update section in the 10/05/07 CANSLIM.net After Market Update provided analysis and a new annotated graph (read here).
1/1/2008 - High ranked company in the Aerospace/Defense Equipment Group which is ranked 28th on the Industry Group Rankings (1-197), satisfying the L criteria. Encountering resistance under its 50 DMA line. Concerns were raised by the recent violation of support at its 50 DMA line and breach of prior chart highs in the $47-48 area. Noted on 12/13/07 as a small gap down and close under its October high closes technically negated its recent breakout. On 11/19/07 a considerable gain on very heavy volume helped it clear its latest base. The Featured Stock Update section in the 10/05/07 CANSLIM.net After Market Update provided analysis and a new annotated graph (read here).
12/31/2007 7:33:20 PM - G - Encountering resistance and trading under its 50 DMA line. Concerns were raised by the recent violation of support at its 50 DMA line and breach of prior chart highs in the $47-48 area. Noted on 12/13/07 as a small gap down and close under its October high closes technically negated its recent breakout. On 11/19/07 a considerable gain on very heavy volume helped it clear its latest base. The Featured Stock Update section in the 10/05/07 CANSLIM.net After Market Update provided analysis and a new annotated graph (read here).
12/27/2007 5:48:36 PM - G -ĀEncountering resistanceĀunderĀits 50 DMA line.ĀConcerns were raised by the recent violation of support at its 50 DMA lineĀandĀbreach of prior chart highs in the $47-48 area.ĀĀNoted on 12/13/07 asĀa small gap down and close under its October high closes technically negated its recent breakout. On 11/19/07 a considerable gain on very heavy volume helped it clear its latest base.Ā The Featured Stock Update section in the 10/05/07 CANSLIM.net After Market Update providedĀanalysis and a new annotated graph (read here).
12/24/2007 - G -ĀSmall gain to close just above its 50 DMA line.ĀConcerns were raised by the recent violation of support at its 50 DMA lineĀandĀbreach of prior chart highs in the $47-48 area.ĀĀNoted on 12/13/07 asĀa small gap down and close under its October high closes technically negated its recent breakout. On 11/19/07 a considerable gain on very heavy volume helped it clear its latest base.Ā The Featured Stock Update section in the 10/05/07 CANSLIM.net After Market Update providedĀanalysis and a new annotated graph (read here).
12/21/2007 6:13:44 PM - G -ĀSmall gap up gain on better volume after sixĀconsecutive losses.ĀConcerns were raised by the recent violation of support at its 50 DMA lineĀandĀbreach of prior chart hights in the $47-48 area.ĀĀNoted on 12/13/07 asĀa small gap down and close under its October high closes technically negated its recent breakout. On 11/19/07 a considerable gain on very heavy volume helped it clear its latest base.Ā The Featured Stock Update section in the 10/05/07 CANSLIM.net After Market Update providedĀanalysis and a new annotated graph (read here).
12/20/2007 6:04:46 PM - G -ĀSixthĀconsecutive loss.ĀConcerns were raised by the recent violation of support at its 50 DMA lineĀandĀbreach of prior chart hights in the $47-48 area.ĀĀNoted on 12/13/07 asĀa small gap down and close under its October high closes technically negated its recent breakout. On 11/19/07 a considerable gain on very heavy volume helped it clear its latest base.Ā The Featured Stock Update section in the 10/05/07 CANSLIM.net After Market Update providedĀanalysis and a new annotated graph (read here).
12/18/2007 7:20:30 PM - G -ĀThirdĀconsecutive loss on above average without considerable price declines,Ābut concerns were raised by the recent violation of support at its 50 DMA lineĀandĀbreach of prior chart hights in the $47-48 area.ĀĀNoted on 12/13/07 asĀa small gap down and close under its October high closes technically negated its recent breakout. On 11/19/07 a considerable gain on very heavy volume helped it clear its latest base.Ā The Featured Stock Update section in the 10/05/07 CANSLIM.net After Market Update providedĀanalysis and a new annotated graph (read here). The 9/26/07 CANSLIM.net Stock Bulletin provided a detailed look at this high-ranked leader along with an annotated graph (read here). Featured in yellow in the 9/24/07 CANSLIM.net Mid-Day BreakOuts Report (read here) as gains with volume 4 times its average daily total lifted this Aerospace/Defense Equipment firm to challenge its prior chart highs. Previously noted the accelerating sales revenues growth, strong quarterly earnings comparisons (the C criteria), and increasing institutional interest (the I criteria) in this issue.
12/17/2007 5:44:58 PM - G -ĀSecond consecutive loss on above average volume ledĀto a deeper violation of support at its 50 DMA lineĀtoday as it also sank further underĀprior chart hights in the $47-48 area.ĀĀNoted on 12/13/07 asĀa small gap down and close under its October high closes technically negated its recent breakout. On 11/19/07 a considerable gain on very heavy volume helped it clear its latest base.Ā The Featured Stock Update section in the 10/05/07 CANSLIM.net After Market Update providedĀanalysis and a new annotated graph (read here). The 9/26/07 CANSLIM.net Stock Bulletin provided a detailed look at this high-ranked leader along with an annotated graph (read here). Featured in yellow in the 9/24/07 CANSLIM.net Mid-Day BreakOuts Report (read here) as gains with volume 4 times its average daily total lifted this Aerospace/Defense Equipment firm to challenge its prior chart highs. Previously noted the accelerating sales revenues growth, strong quarterly earnings comparisons (the C criteria), and increasing institutional interest (the I criteria) in this issue.
12/14/2007 7:30:32 PM - G -ĀLoss on above average volume ledĀto a violation of support at its 50 DMA lineĀas it sank further underĀprior chart hights in the $47-48 area.ĀĀNoted on 12/13/07 asĀa small gap down and close under its October high closes technically negated its recent breakout. On 11/19/07 a considerable gain on very heavy volume helped it clear its latest base.Ā The Featured Stock Update section in the 10/05/07 CANSLIM.net After Market Update providedĀanalysis and a new annotated graph (read here). The 9/26/07 CANSLIM.net Stock Bulletin provided a detailed look at this high-ranked leader along with an annotated graph (read here). Featured in yellow in the 9/24/07 CANSLIM.net Mid-Day BreakOuts Report (read here) as gains with volume 4 times its average daily total lifted this Aerospace/Defense Equipment firm to challenge its prior chart highs. Previously noted the accelerating sales revenues growth, strong quarterly earnings comparisons (the C criteria), and increasing institutional interest (the I criteria) in this issue.
12/13/2007 6:37:16 PM - G -ĀSmall gap down and closed under its October high closes, technically negating its recent breakout. Testing support at its 50 DMA line and prior chart highs in the $47-48 area. On 11/19/07 a considerable gain on very heavy volume helped it clear its latest base.Ā The Featured Stock Update section in the 10/05/07 CANSLIM.net After Market Update providedĀanalysis and a new annotated graph (read here). The 9/26/07 CANSLIM.net Stock Bulletin provided a detailed look at this high-ranked leader along with an annotated graph (read here). Featured in yellow in the 9/24/07 CANSLIM.net Mid-Day BreakOuts Report (read here) as gains with volume 4 times its average daily total lifted this Aerospace/Defense Equipment firm to challenge its prior chart highs. Previously noted the accelerating sales revenues growth, strong quarterly earnings comparisons (the C criteria), and increasing institutional interest (the I criteria) in this issue.
12/12/2007 6:38:57 PM - G -ĀHeld its ground after its 12/11/07 loss on very heavy volume, falling toward support at its 50 DMA line and prior chart highs in the $47-48 area. On 11/19/07 a considerable gain on very heavy volume helped it clear its latest base.Ā The Featured Stock Update section in the 10/05/07 CANSLIM.net After Market Update providedĀanalysis and a new annotated graph (read here). The 9/26/07 CANSLIM.net Stock Bulletin provided a detailed look at this high-ranked leader along with an annotated graph (read here). Featured in yellow in the 9/24/07 CANSLIM.net Mid-Day BreakOuts Report (read here) as gains with volume 4 times its average daily total lifted this Aerospace/Defense Equipment firm to challenge its prior chart highs. Previously noted the accelerating sales revenues growth, strong quarterly earnings comparisons (the C criteria), and increasing institutional interest (the I criteria) in this issue.
12/11/2007 5:52:26 PM - G -ĀLoss on very heavy volume, falling toward support at its 50 DMA line and prior chart highs in the $47-48 area. On 11/19/07 a considerable gain on very heavy volume helped it clear its latest base.Ā The Featured Stock Update section in the 10/05/07 CANSLIM.net After Market Update providedĀanalysis and a new annotated graph (read here). The 9/26/07 CANSLIM.net Stock Bulletin provided a detailed look at this high-ranked leader along with an annotated graph (read here). Featured in yellow in the 9/24/07 CANSLIM.net Mid-Day BreakOuts Report (read here) as gains with volume 4 times its average daily total lifted this Aerospace/Defense Equipment firm to challenge its prior chart highs. Previously noted the accelerating sales revenues growth, strong quarterly earnings comparisons (the C criteria), and increasing institutional interest (the I criteria) in this issue.
12/5/2007 7:30:59 PM - G -ĀTrading just above support at its prior chart highs and above its nearby 50 DMA line. On 11/19/07 a considerable gain on very heavy volume helped it clear its latest base.Ā The Featured Stock Update section in the 10/05/07 CANSLIM.net After Market Update providedĀanalysis and a new annotated graph (read here). The 9/26/07 CANSLIM.net Stock Bulletin provided a detailed look at this high-ranked leader along with an annotated graph (read here). Featured in yellow in the 9/24/07 CANSLIM.net Mid-Day BreakOuts Report (read here) as gains with volume 4 times its average daily total lifted this Aerospace/Defense Equipment firm to challenge its prior chart highs. Previously noted the accelerating sales revenues growth, strong quarterly earnings comparisons (the C criteria), and increasing institutional interest (the I criteria) in this issue.
12/3/2007 7:41:42 PM - G -ĀPositively reversed after early losses led to an intra-day violation of its 50 DMA line. On 11/19/07 a considerable gain on very heavy volume helped it clear its latest base. Deterioration under its latest chart lows would trigger sell signals and raise more serious concerns. The Featured Stock Update section in the 10/05/07 CANSLIM.net After Market Update provided fresh analysis and a new annotated graph (read here). The 9/26/07 CANSLIM.net Stock Bulletin provided a detailed look at this high-ranked leader along with an annotated graph (read here). Featured in yellow in the 9/24/07 CANSLIM.net Mid-Day BreakOuts Report (read here) as gains with volume 4 times its average daily total lifted this Aerospace/Defense Equipment firm to challenge its prior chart highs. Previously noted the accelerating sales revenues growth, strong quarterly earnings comparisons (the C criteria), and increasing institutional interest (the I criteria) in this issue.
11/30/2007 7:13:09 PM - G -ĀFell back towardĀprior chart highs in the $47-48 area. On 11/19/07 a considerable gain on very heavy volume helped it clear its latest base. Recently found support near its 50 DMA line while trading in a tight range for several weeks near its pivot point and max buy level. Deterioration under its latest chart lows would trigger sell signals and raise more serious concerns. The Featured Stock Update section in the 10/05/07 CANSLIM.net After Market Update provided fresh analysis and a new annotated graph (read here). The 9/26/07 CANSLIM.net Stock Bulletin provided a detailed look at this high-ranked leader along with an annotated graph (read here). Featured in yellow in the 9/24/07 CANSLIM.net Mid-Day BreakOuts Report (read here) as gains with volume 4 times its average daily total lifted this Aerospace/Defense Equipment firm to challenge its prior chart highs. Previously noted the accelerating sales revenues growth, strong quarterly earnings comparisons (the C criteria), and increasing institutional interest (the I criteria) in this issue.
11/28/2007 6:31:31 PM - G -ĀBounced nearĀprior chart highs in the $47-48 area. On 11/19/07 a considerable gain on very heavy volume helped it clear its latest base. Recently found support near its 50 DMA line while trading in a tight range for several weeks near its pivot point and max buy level. Although it may be breaking out from another sound base, its color code is green as it has risen beyond the previously cited max buy level. Market conditions (the M criteria) argue against making any new buys without a follow-through day. Deterioration under its latest chart lows would trigger sell signals and raise more serious concerns. The Featured Stock Update section in the 10/05/07 CANSLIM.net After Market Update provided fresh analysis and a new annotated graph (read here). The 9/26/07 CANSLIM.net Stock Bulletin provided a detailed look at this high-ranked leader along with an annotated graph (read here). Featured in yellow in the 9/24/07 CANSLIM.net Mid-Day BreakOuts Report (read here) as gains with volume 4 times its average daily total lifted this Aerospace/Defense Equipment firm to challenge its prior chart highs. Previously noted the accelerating sales revenues growth, strong quarterly earnings comparisons (the C criteria), and increasing institutional interest (the I criteria) in this issue.
11/27/2007 7:12:03 PM - G - Loss on above average volume, pulling back toward prior chart highs in the $47-48 area. On 11/19/07 a considerable gain on very heavy volume helped it clear its latest base. Recently found support near its 50 DMA line while trading in a tight range for several weeks near its pivot point and max buy level. Although it may be breaking out from another sound base, its color code isgreen as it has risen beyond the previously cited max buy level. Market conditions (the M criteria) argue against making any new buys without a follow-through day. Deterioration under its latest chart lows would trigger sell signals and raise more serious concerns. The Featured Stock Update section in the 10/05/07 CANSLIM.net After Market Update provided fresh analysis and a new annotated graph (read here). The 9/26/07 CANSLIM.net Stock Bulletin provided a detailed look at this high-ranked leader along with an annotated graph (read here). Featured in yellow in the 9/24/07 CANSLIM.net Mid-Day BreakOuts Report (read here) as gains with volume 4 times its average daily total lifted this Aerospace/Defense Equipment firm to challenge its prior chart highs. Previously noted the accelerating sales revenues growth, strong quarterly earnings comparisons (the C criteria), and increasing institutional interest (the I criteria) in this issue.
11/27/2007 12:08:56 PM - G - Pulled back toward prior chart highs in the $47-48 area. ĀOn 11/19/07 a considerable gain on very heavy volume helped it clear its latest base. Recently found support near its 50 DMA line while trading in a tight range for several weeks near its pivot point and max buy level. Although it may be breaking out from another sound base, its color code isĀgreen as it has risen beyond the previously cited max buy level. Market conditions (the M criteria) argue against making any new buys without a follow-through day. Deterioration under its latest chart lows would trigger sell signals and raise more serious concerns. The Featured Stock Update section in the 10/05/07 CANSLIM.net After Market Update provided fresh analysis and a new annotated graph (read here). The 9/26/07 CANSLIM.net Stock Bulletin provided a detailed look at this high-ranked leader along with an annotated graph (read here). Featured in yellow in the 9/24/07 CANSLIM.net Mid-Day BreakOuts Report (read here) as gains with volume 4 times its average daily total lifted this Aerospace/Defense Equipment firm to challenge its prior chart highs. Previously noted the accelerating sales revenues growth, strong quarterly earnings comparisons (the C criteria), and increasing institutional interest (the I criteria) in this issue.
11/26/2007 - G - Gain on light volume for new all-time highs. On 11/19/07 a considerable gain on very heavy volume helped it clear its latest base. Recently found support near its 50 DMA line while trading in a tight range for several weeks near its pivot point and max buy level. Although it may be breaking out from another sound base, its color code is changed to green as it has risen beyond the previously cited max buy level. Market conditions (the M criteria) argue against making any new buys without a follow-through day. Deterioration under its latest chart lows would trigger sell signals and raise more serious concerns. The Featured Stock Update section in the 10/05/07 CANSLIM.net After Market Update provided fresh analysis and a new annotated graph (read here). The 9/26/07 CANSLIM.net Stock Bulletin provided a detailed look at this high-ranked leader along with an annotated graph (read here). Featured in yellow in the 9/24/07 CANSLIM.net Mid-Day BreakOuts Report (read here) as gains with volume 4 times its average daily total lifted this Aerospace/Defense Equipment firm to challenge its prior chart highs. Previously noted the accelerating sales revenues growth, strong quarterly earnings comparisons (the C criteria), and increasing institutional interest (the I criteria) in this issue.
11/23/2007 3:24:46 PM - G - Gain on lightĀvolume for itsĀbest close ever. Hit new all-time highs on 11/19/07 with a considerable gain on very heavy volume. Recently found support near its 50 DMA line while trading in a tight range for several weeks near its pivot point and max buy level. Although it may be breaking out from another sound base, its color code is changed to green as it has risen beyond the previously cited max buy level. Market conditions (the M criteria) argue against making any new buys without a follow-through day. Deteriration under its latest chart lows would trigger sell signals and raise more serious concerns. The Featured Stock Update section in the 10/05/07 CANSLIM.net After Market Update provided fresh analysis and a new annotated graph (read here). The 9/26/07 CANSLIM.net Stock Bulletin provided a detailed look at this high-ranked leader along with an annotated graph (read here). Featured in yellow in the 9/24/07 CANSLIM.net Mid-Day BreakOuts Report (read here) as gains with volume 4 times its average daily total lifted this Aerospace/Defense Equipment firm to challenge its prior chart highs. Previously noted the accelerating sales revenues growth, strong quarterly earnings comparisons (the C criteria), and increasing institutional interest (the I criteria) in this issue.
11/21/2007 6:48:22 PM - G - Gain on above average volume for its second best close ever. Hit new all-time highs on 11/19/07Āwith aĀconsiderable gain on very heavy volume. Recently found support near its 50 DMA line while trading in a tight range for several weeks near its pivot point and max buy level. Although it may be breaking out from another sound base, its color code is changed to green as it has risen beyond the previously cited max buy level. Market conditions (the M criteria) argue against making any new buys without a follow-through day. Deteriration under its latest chart lows would trigger sell signals and raise more serious concerns. The Featured Stock Update section in the 10/05/07 CANSLIM.net After Market Update provided fresh analysis and a new annotated graph (read here). The 9/26/07 CANSLIM.net Stock Bulletin provided a detailed look at this high-ranked leader along with an annotated graph (read here). Featured in yellow in the 9/24/07 CANSLIM.net Mid-Day BreakOuts Report (read here) as gains with volume 4 times its average daily total lifted this Aerospace/Defense Equipment firm to challenge its prior chart highs. Previously noted the accelerating sales revenues growth, strong quarterly earnings comparisons (the C criteria), and increasing institutional interest (the I criteria) in this issue.
11/20/2007 6:17:30 PM - G - Gapped down immediately after rallying toĀnew all-time highs on 11/19/07 for a considerable gain on very heavy volume. Recently found support near its 50 DMA line while trading in a tight range for several weeks near its pivot point and max buy level. Although it may be breaking out from another sound base, its color code is changed to green as it has risen beyond the previously cited max buy level. Market conditions (the M criteria) argue against making any new buys without a follow-through day. Deteriration under its latest chart lows would trigger sell signals and raise more serious concerns. The Featured Stock Update section in the 10/05/07 CANSLIM.net After Market Update provided fresh analysis and a new annotated graph (read here). The 9/26/07 CANSLIM.net Stock Bulletin provided a detailed look at this high-ranked leader along with an annotated graph (read here). Featured in yellow in the 9/24/07 CANSLIM.net Mid-Day BreakOuts Report (read here) as gains with volume 4 times its average daily total lifted this Aerospace/Defense Equipment firm to challenge its prior chart highs. Previously noted the accelerating sales revenues growth, strong quarterly earnings comparisons (the C criteria), and increasing institutional interest (the I criteria) in this issue.
11/19/2007 6:35:35 PM - G - Hit new highs today with a copnsiderable gain on very heavy volume, despite the broader market's negative bias. Recently found support near its 50 DMA line while trading in a tight range for several weeks near its pivot point and max buy level. Although it may be breaking out from another sound base, its color code is changed to green as it has risen beyond the previously cited max buy level. Market conditions (the M criteria) argue against making any new buys without a follow-through day. Deteriration under its latest chart lows would trigger sell signals and raise more serious concerns. The Featured Stock Update section in the 10/05/07 CANSLIM.net After Market Update provided fresh analysis and a new annotated graph (read here). The 9/26/07 CANSLIM.net Stock Bulletin provided a detailed look at this high-ranked leader along with an annotated graph (read here). Featured in yellow in the 9/24/07 CANSLIM.net Mid-Day BreakOuts Report (read here) as gains with volume 4 times its average daily total lifted this Aerospace/Defense Equipment firm to challenge its prior chart highs. Previously noted the accelerating sales revenues growth, strong quarterly earnings comparisons (the C criteria), and increasing institutional interest (the I criteria) in this issue.
11/19/2007 - G - Hit new highs today with a gain on very heavy volume, despite the broader market's negative bias. Recently found support near its 50 DMA line while trading in a tight range for several weeks near its pivot point and max buy level. Although it may be breaking out from another sound base, its color code is changed to green as it has risen beyond the previously cited max buy level. Market conditions (the M criteria) argue against making any new buys without a follow-through day. Deteriration under its latest chart lows would trigger sell signals and raise more serious concerns. The Featured Stock Update section in the 10/05/07 CANSLIM.net After Market Update provided fresh analysis and a new annotated graph (read here). The 9/26/07 CANSLIM.net Stock Bulletin provided a detailed look at this high-ranked leader along with an annotated graph (read here). Featured in yellow in the 9/24/07 CANSLIM.net Mid-Day BreakOuts Report (read here) as gains with volume 4 times its average daily total lifted this Aerospace/Defense Equipment firm to challenge its prior chart highs. Previously noted the accelerating sales revenues growth, strong quarterly earnings comparisons (the C criteria), and increasing institutional interest (the I criteria) in this issue.
11/16/2007 - Y - Gain on above average volume after finding support near its 50 DMA line. Recently trading in a tight range near its pivot point and max buy level. Deterioration under its latest chart lows would trigger sell signals and raise more serious concerns. The Featured Stock Update section in the 10/05/07 CANSLIM.net After Market Update provided fresh analysis and a new annotated graph (read here). The 9/26/07 CANSLIM.net Stock Bulletin provided a detailed look at this high-ranked leader along with an annotated graph (read here). Featured in yellow in the 9/24/07 CANSLIM.net Mid-Day BreakOuts Report (read here) as gains with volume 4 times its average daily total lifted this Aerospace/Defense Equipment firm to challenge its prior chart highs. Previously noted the accelerating sales revenues growth, strong quarterly earnings comparisons (the C criteria), and increasing institutional interest (the I criteria) in this issue.
11/16/2007 2:55:20 PM - Y - Gain on above average volume after finding support near its 50 DMA line, recently trading in a tight range near its pivot point and max buy level. Deterioration under its latest chart lows would trigger sell signals and raise more serious concerns. The Featured Stock Update section in the 10/05/07 CANSLIM.net After Market Update provided fresh analysis and a new annotated graph (read here). The 9/26/07 CANSLIM.net Stock Bulletin provided a detailed look at this high-ranked leader along with an annotated graph (read here). Featured in yellow in the 9/24/07 CANSLIM.net Mid-Day BreakOuts Report (read here) as gains with volume 4 times its average daily total lifted this Aerospace/Defense Equipment firm to challenge its prior chart highs. Previously noted the accelerating sales revenues growth, strong quarterly earnings comparisons (the C criteria), and increasing institutional interest (the I criteria) in this issue.
11/15/2007 - Y - Hovering just above its 50 DMA line in a relatively tight range for the past several weeks. Deterioration under its latest chart lows would trigger sell signals and raise more serious concerns. The Featured Stock Update section in the 10/05/07 CANSLIM.net After Market Update provided fresh analysis and a new annotated graph (read here). The 9/26/07 CANSLIM.net Stock Bulletin provided a detailed look at this high-ranked leader along with an annotated graph (read here). Featured in yellow in the 9/24/07 CANSLIM.net Mid-Day BreakOuts Report (read here) as gains with volume 4 times its average daily total lifted this Aerospace/Defense Equipment firm to challenge its prior chart highs. Previously noted the accelerating sales revenues growth, strong quarterly earnings comparisons (the C criteria), and increasing institutional interest (the I criteria) in this issue.
11/13/2007 6:19:25 PM - Y - Promptly repaired Friday's violation of its 50 DMA line. Deterioration under its latest chart lows would trigger sell signals and raise more serious concerns. The Featured Stock Update section in the 10/05/07 CANSLIM.net After Market Update provided fresh analysis and a new annotated graph (read here). The 9/26/07 CANSLIM.net Stock Bulletin provided a detailed look at this high-ranked leader along with an annotated graph (read here). Featured in yellow in the 9/24/07 CANSLIM.net Mid-Day BreakOuts Report (read here) as gains with volume 4 times its average daily total lifted this Aerospace/Defense Equipment firm to challenge its prior chart highs. Previously noted the accelerating sales revenues growth, strong quarterly earnings comparisons (the C criteria), and increasing institutional interest (the I criteria) in this issue.
11/12/2007 - Y - Gain on heavier volume, promptly repairing Friday's violation of its 50 DMA line. Deterioration under its latest chart lows would trigger sell signals and raise more serious concerns. The Featured Stock Update section in the 10/05/07 CANSLIM.net After Market Update provided fresh analysis and a new annotated graph (read here). The 9/26/07 CANSLIM.net Stock Bulletin provided a detailed look at this high-ranked leader along with an annotated graph (read here). Featured in yellow in the 9/24/07 CANSLIM.net Mid-Day BreakOuts Report (read here) as gains with volume 4 times its average daily total lifted this Aerospace/Defense Equipment firm to challenge its prior chart highs. Previously noted the accelerating sales revenues growth, strong quarterly earnings comparisons (the C criteria), and increasing institutional interest (the I criteria) in this issue.
11/9/2007 - Y - Loss on light volume led to a violation of its 50 DMA line, and deterioration under its July chart highs in the $43 area raises concerns by negating its latest breakout. The Featured Stock Update section in the 10/05/07 CANSLIM.net After Market Update provided fresh analysis and a new annotated graph (read here). The 9/26/07 CANSLIM.net Stock Bulletin provided a detailed look at this high-ranked leader along with an annotated graph (read here). Featured in yellow in the 9/24/07 CANSLIM.net Mid-Day BreakOuts Report (read here) as gains with volume 4 times its average daily total lifted this Aerospace/Defense Equipment firm to challenge its prior chart highs. Previously noted the accelerating sales revenues growth, strong quarterly earnings comparisons (the C criteria), and increasing institutional interest (the I criteria) in this issue.
11/6/2007 8:16:04 PM - Y - Recently finding support above its 50 DMA line, and its positive reversal on 10/22/07 was somewhat encouraging. Recent closes under its July chart highs in the $43 area raised concerns by negating its latest breakout. The Featured Stock Update section in the 10/05/07 CANSLIM.net After Market Update provided fresh analysis and a new annotated graph (read here). The 9/26/07 CANSLIM.net Stock Bulletin provided a detailed look at this high-ranked leader along with an annotated graph (read here). Featured in yellow in the 9/24/07 CANSLIM.net Mid-Day BreakOuts Report (read here) as gains with volume 4 times its average daily total lifted this Aerospace/Defense Equipment firm to challenge its prior chart highs. Previously noted the accelerating sales revenues growth, strong quarterly earnings comparisons (the C criteria), and increasing institutional interest (the I criteria) in this issue.
11/2/2007 7:09:30 PM - Y - Recently found support at its 50 DMA line, and its positive reversal on 10/22/07 was encouraging. Recent closes under its July chart highs in the $43 area raised concerns by negating its latest breakout. The Featured Stock Update section in the 10/05/07 CANSLIM.net After Market Update provided fresh analysis and a new annotated graph (read here). The 9/26/07 CANSLIM.net Stock Bulletin provided a detailed look at this high-ranked leader along with an annotated graph (read here). Featured in yellow in the 9/24/07 CANSLIM.net Mid-Day BreakOuts Report (read here) as gains with volume 4 times its average daily total lifted this Aerospace/Defense Equipment firm to challenge its prior chart highs. Previously noted the accelerating sales revenues growth, strong quarterly earnings comparisons (the C criteria), and increasing institutional interest (the I criteria) in this issue.
10/30/2007 - Y - Recently found support at its 50 DMA line. Positive reversal on 10/22/07 was encouraging after briefly violating its 50 DMA line intra-day. Recent closes under its July chart highs in the $43 area raised concerns by negating its latest breakout. The Featured Stock Update section in the 10/05/07 CANSLIM.net After Market Update provided fresh analysis and a new annotated graph (read here). The 9/26/07 CANSLIM.net Stock Bulletin provided a detailed look at this high-ranked leader along with an annotated graph (read here). Featured in yellow in the 9/24/07 CANSLIM.net Mid-Day BreakOuts Report (read here) as gains with volume 4 times its average daily total lifted this Aerospace/Defense Equipment firm to challenge its prior chart highs. Previously noted the accelerating sales revenues growth, strong quarterly earnings comparisons (the C criteria), and increasing institutional interest (the I criteria) in this issue.
10/29/2007 7:03:38 PM - Y - Rallied up from support at its 50 DMA line with a gain on higher volume. Positive reversal on 10/22/07 was encouraging after briefly violating its 50 DMA line intra-day. Recent closes under its July chart highs in the $43 area raised concerns by negating its latest breakout. The Featured Stock Update section in the 10/05/07 CANSLIM.net After Market Update provided fresh analysis and a new annotated graph (read here). The 9/26/07 CANSLIM.net Stock Bulletin provided a detailed look at this high-ranked leader along with an annotated graph (read here). Featured in yellow in the 9/24/07 CANSLIM.net Mid-Day BreakOuts Report (read here) as gains with volume 4 times its average daily total lifted this Aerospace/Defense Equipment firm to challenge its prior chart highs. Previously noted the accelerating sales revenues growth, strong quarterly earnings comparisons (the C criteria), and increasing institutional interest (the I criteria) in this issue.
10/29/2007 - Y - Rallied up from support at its 50 DMA line with a gain on higher volume. Positive reversal on 10/22/07 was encouraging after briefly violating its 50 DMA line intra-day. Recent closes under its July chart highs in the $43 area raised concerns by negating its latest breakout. The Featured Stock Update section in the 10/05/07 CANSLIM.net After Market Update provided fresh analysis and a new annotated graph (read here). The 9/26/07 CANSLIM.net Stock Bulletin provided a detailed look at this high-ranked leader along with an annotated graph (read here). Featured in yellow in the 9/24/07 CANSLIM.net Mid-Day BreakOuts Report (read here) as gains with volume 4 times its average daily total lifted this Aerospace/Defense Equipment firm to challenge its prior chart highs. Previously noted the accelerating sales revenues growth, strong quarterly earnings comparisons (the C criteria), and increasing institutional interest (the I criteria) in this issue.
10/25/2007 6:39:34 PM - Y - Testing support at its 50 DMA line. Positive reversal on 10/22/07 after briefly violating its 50 DMA line intra-day. Last week's close under its July chart highs in the $43 area raised concerns by negating its latest breakout. The Featured Stock Update section in the 10/05/07 CANSLIM.net After Market Update provided fresh analysis and a new annotated graph (read here). The 9/26/07 CANSLIM.net Stock Bulletin provided a detailed look at this high-ranked leader along with an annotated graph (read here). Featured in yellow in the 9/24/07 CANSLIM.net Mid-Day BreakOuts Report (read here) as gains with volume 4 times its average daily total lifted this Aerospace/Defense Equipment firm to challenge its prior chart highs. Previously noted the accelerating sales revenues growth, strong quarterly earnings comparisons (the C criteria), and increasing institutional interest (the I criteria) in this issue.
10/24/2007 - Y - Found supporrt at its 50 DMA line again. Positive reversal on 10/22/07 after briefly violating its 50 DMA line intra-day. Last week's close under its July chart highs in the $43 area raised concerns by negating its latest breakout. The Featured Stock Update section in the 10/05/07 CANSLIM.net After Market Update provided fresh analysis and a new annotated graph (read here). The 9/26/07 CANSLIM.net Stock Bulletin provided a detailed look at this high-ranked leader along with an annotated graph (read here). Featured in yellow in the 9/24/07 CANSLIM.net Mid-Day BreakOuts Report (read here) as gains with volume 4 times its average daily total lifted this Aerospace/Defense Equipment firm to challenge its prior chart highs. Previously noted the accelerating sales revenues growth, strong quarterly earnings comparisons (the C criteria), and increasing institutional interest (the I criteria) in this issue.
10/23/2007 7:40:39 PM - Y - Sank toward its 50 DMA line again. Positive reversal on 10/22/07 after briefly violating its 50 DMA line intra-day. Last week's close under its July chart highs in the $43 area raised concerns by negating its latest breakout. The Featured Stock Update section in the 10/05/07 CANSLIM.net After Market Update provided fresh analysis and a new annotated graph (read here). The 9/26/07 CANSLIM.net Stock Bulletin provided a detailed look at this high-ranked leader along with an annotated graph (read here). Featured in yellow in the 9/24/07 CANSLIM.net Mid-Day BreakOuts Report (read here) as gains with volume 4 times its average daily total lifted this Aerospace/Defense Equipment firm to challenge its prior chart highs. Previously noted the accelerating sales revenues growth, strong quarterly earnings comparisons (the C criteria), and increasing institutional interest (the I criteria) in this issue.
10/22/2007 - Y - Positive reversal after briefly violating its 50 DMA line intra-day. Last week's close under its July chart highs in the $43 area raised concerns by negating its latest breakout. The Featured Stock Update section in the 10/05/07 CANSLIM.net After Market Update provided fresh analysis and a new annotated graph (read here). The 9/26/07 CANSLIM.net Stock Bulletin provided a detailed look at this high-ranked leader along with an annotated graph (read here). Featured in yellow in the 9/24/07 CANSLIM.net Mid-Day BreakOuts Report (read here) as gains with volume 4 times its average daily total lifted this Aerospace/Defense Equipment firm to challenge its prior chart highs. Previously noted the accelerating sales revenues growth, strong quarterly earnings comparisons (the C criteria), and increasing institutional interest (the I criteria) in this issue.
10/19/2007 - Y - Pulled back on average volume to a close under its July chart highs in the $43 area, raising concerns by negating its latest breakout. The Featured Stock Update section in the 10/05/07 CANSLIM.net After Market Update provided fresh analysis and a new annotated graph (read here). The 9/26/07 CANSLIM.net Stock Bulletin provided a detailed look at this high-ranked leader along with an annotated graph (read here). Featured in yellow in the 9/24/07 CANSLIM.net Mid-Day BreakOuts Report (read here) as gains with volume 4 times its average daily total lifted this Aerospace/Defense Equipment firm to challenge its prior chart highs. Previously noted the accelerating sales revenues growth, strong quarterly earnings comparisons (the C criteria), and increasing institutional interest (the I criteria) in this issue.
10/16/2007 - Y - Finding support near prior chart highs in the $43 area after rising earlier from a ''3-weeks tight'' type pattern. The Featured Stock Update section in the 10/05/07 CANSLIM.net After Market Update provided fresh analysis and a new annotated graph (read here). The 9/26/07 CANSLIM.net Stock Bulletin provided a detailed look at this high-ranked leader along with an annotated graph (read here). Featured in yellow in the 9/24/07 CANSLIM.net Mid-Day BreakOuts Report (read here) as gains with volume 4 times its average daily total lifted this Aerospace/Defense Equipment firm to challenge its prior chart highs. Previously noted the accelerating sales revenues growth, strong quarterly earnings comparisons (the C criteria), and increasing institutional interest (the I criteria) in this issue.
10/15/2007 - Y - Small loss on light volume. Finding prompt support near $43 after rising earlier from a ''3-weeks tight'' type pattern. The Featured Stock Update section in the 10/05/07 CANSLIM.net After Market Update provided fresh analysis and a new annotated graph (read here). The 9/26/07 CANSLIM.net Stock Bulletin provided a detailed look at this high-ranked leader along with an annotated graph (read here). Featured in yellow in the 9/24/07 CANSLIM.net Mid-Day BreakOuts Report (read here) as gains with volume 4 times its average daily total lifted this Aerospace/Defense Equipment firm to challenge its prior chart highs. Previously noted the accelerating sales revenues growth, strong quarterly earnings comparisons (the C criteria), and increasing institutional interest (the I criteria) in this issue.
10/12/2007 - Y - Recovered from early lows for a positive reversal, finding prompt support near $43 after rising earlier from a ''3-weeks tight'' type pattern. The Featured Stock Update section in the 10/05/07 CANSLIM.net After Market Update provided fresh analysis and a new annotated graph (read here). Tested chart support near prior highs in the $43-44 area, then closed last week higher. The 9/26/07 CANSLIM.net Stock Bulletin provided a detailed look at this high-ranked leader along with an annotated graph (read here). Featured in yellow in the 9/24/07 CANSLIM.net Mid-Day BreakOuts Report (read here) as gains with volume 4 times its average daily total lifted this Aerospace/Defense Equipment firm to challenge its prior chart highs. Previously noted the accelerating sales revenues growth, strong quarterly earnings comparisons (the C criteria), and increasing institutional interest (the I criteria) in this issue.
10/11/2007 6:40:28 PM - Y - Negative reversal today on high volume raises concerns as distributional action pressures it back to test chart suport near $43 after rising earlier from a ''3-weeks tight'' type pattern. The Featured Stock Update section in the 10/05/07 CANSLIM.net After Market Update provided fresh analysis and a new annotated graph (read here). Tested chart support near prior highs in the $43-44 area, then closed last week higher. The 9/26/07 CANSLIM.net Stock Bulletin provided a detailed look at this high-ranked leader along with an annotated graph (read here). Featured in yellow in the 9/24/07 CANSLIM.net Mid-Day BreakOuts Report (read here) as gains with volume 4 times its average daily total lifted this Aerospace/Defense Equipment firm to challenge its prior chart highs. Previously noted the accelerating sales revenues growth, strong quarterly earnings comparisons (the C criteria), and increasing institutional interest (the I criteria) in this issue.
10/11/2007 - Y - Negative reversal today on high volume raises concerns as distributional action pressures it back to test chart suport near $43 after rising earlier from a ''3-weeks tight'' type pattern. The Featured Stock Update section in the 10/05/07 CANSLIM.net After Market Update provided fresh analysis and a new annotated graph (read here). Tested chart support near prior highs in the $43-44 area, then closed last week higher. The 9/26/07 CANSLIM.net Stock Bulletin provided a detailed look at this high-ranked leader along with an annotated graph (read here). Featured in yellow in the 9/24/07 CANSLIM.net Mid-Day BreakOuts Report (read here) as gains with volume 4 times its average daily total lifted this Aerospace/Defense Equipment firm to challenge its prior chart highs. Previously noted the accelerating sales revenues growth, strong quarterly earnings comparisons (the C criteria), and increasing institutional interest (the I criteria) in this issue.
10/11/2007 - Y - Gapped up and hit new all-time highs with volume running at an above average pace as it rises from a ''3-weeks tight'' type pattern. The Featured Stock Update section in the 10/05/07 CANSLIM.net After Market Update provided fresh analysis and a new annotated graph (read here). Tested chart support near prior highs in the $43-44 area, then closed last week higher. The 9/26/07 CANSLIM.net Stock Bulletin provided a detailed look at this high-ranked leader along with an annotated graph (read here). Featured in yellow in the 9/24/07 CANSLIM.net Mid-Day BreakOuts Report (read here) as gains with volume 4 times its average daily total lifted this Aerospace/Defense Equipment firm to challenge its prior chart highs. Previously noted the accelerating sales revenues growth, strong quarterly earnings comparisons (the C criteria), and increasing institutional interest (the I criteria) in this issue.
10/10/2007 8:52:04 PM - Y - Perched near all-time highs forming a ''3-weeks tight'' type pattern. The Featured Stock Update section in the 10/05/07 CANSLIM.net After Market Update provided fresh analysis and a new annotated graph (read here). Tested chart support near prior highs in the $43-44 area, then closed last week higher. The 9/26/07 CANSLIM.net Stock Bulletin provided a detailed look at this high-ranked leader along with an annotated graph (read here). Featured in yellow in the 9/24/07 CANSLIM.net Mid-Day BreakOuts Report (read here) as gains with volume 4 times its average daily total lifted this Aerospace/Defense Equipment firm to challenge its prior chart highs. Previously noted the accelerating sales revenues growth, strong quarterly earnings comparisons (the C criteria), and increasing institutional interest (the I criteria) in this issue.
10/9/2007 8:43:55 PM - Y - Perched near all-time highs with nobody rushing to the exits. The Featured Stock Update section in the 10/05/07 CANSLIM.net After Market Update provided fresh analysis and a new annotated graph (read here). Tested chart support near prior highs in the $43-44 area, then closed last week higher. The 9/26/07 CANSLIM.net Stock Bulletin provided a detailed look at this high-ranked leader along with an annotated graph (read here). Featured in yellow in the 9/24/07 CANSLIM.net Mid-Day BreakOuts Report (read here) as gains with volume 4 times its average daily total lifted this Aerospace/Defense Equipment firm to challenge its prior chart highs. Previously noted the accelerating sales revenues growth, strong quarterly earnings comparisons (the C criteria), and increasing institutional interest (the I criteria) in this issue.
10/8/2007 - Y - Small gain on light volume. The Featured Stock Update section in the 10/05/07CANSLIM.net After Market Update provided fresh analysis and a new annotated graph (read here). Tested chart support near prior highs in the $43-44 area, then closed last week higher. The 9/26/07 CANSLIM.net Stock Bulletin provided a detailed look at this high-ranked leader along with an annotated graph (read here). Featured in yellow in the 9/24/07 CANSLIM.net Mid-Day BreakOuts Report (read here) as gains with volume 4 times its average daily total lifted this Aerospace/Defense Equipment firm to challenge its prior chart highs. Previously noted the accelerating sales revenues growth, strong quarterly earnings comparisons (the C criteria), and increasing institutional interest (the I criteria) in this issue.
10/5/2007 7:43:24 PM - Y - See the Featured Stock Update section of the latest CANSLIM.net After Market Updatefor current analysis and a new annotated graph (read here). Tested chart support near prior highs in the $43-44 area, then closed the week higher. The 9/26/07 CANSLIM.net Stock Bulletin provided a detailed look at this high-ranked leader along with an annotated graph (read here). Featured in yellow in the 9/24/07 CANSLIM.net Mid-Day BreakOuts Report (read here) as gains with volume 4 times its average daily total lifted this Aerospace/Defense Equipment firm to challenge its prior chart highs. Previously noted the accelerating sales revenues growth, strong quarterly earnings comparisons (the C criteria), and increasing institutional interest (the I criteria) in this issue.
10/4/2007 - Y - Retracing with a loss on slightly below average volume toward chart support near prior highs in the $43-44 area. The 9/26/07 CANSLIM.net Stock Bulletin provided a detailed look at this high-ranked leader along with an annotated graph (read here). Featured in yellow in the 9/24/07 CANSLIM.net Mid-Day BreakOuts Report (read here) as gains with volume 4 times its average daily total lifted this Aerospace/Defense Equipment firm to challenge its prior chart highs. Previously noted the accelerating sales revenues growth, strong quarterly earnings comparisons (the C criteria), and increasing institutional interest (the I criteria) in this issue.
10/1/2007 - Y - Holding its recent breakout gains well, with chart support to now be expected near prior highs in the $43-44 area. The 9/26/07 CANSLIM.net Stock Bulletin provided a detailed look at this high-ranked leader along with an annotated graph (read here). Featured in yellow in the 9/24/07 CANSLIM.net Mid-Day BreakOuts Report (read here) as gains with volume 4 times its average daily total lifted this Aerospace/Defense Equipment firm to challenge its prior chart highs. Previously noted the accelerating sales revenues growth, strong quarterly earnings comparisons (the C criteria), and increasing institutional interest (the I criteria) in this issue.
9/28/2007 - Y - Pulling back after a recent string of 7 straight up sessions. The 9/26/07 CANSLIM.net Stock Bulletin provided a detailed look at this high-ranked leader along with an annotated graph (read here). Featured in yellow in the 9/24/07 CANSLIM.net Mid-Day BreakOuts Report (read here) as gains with volume 4 times its average daily total lifted this Aerospace/Defense Equipment firm to challenge its prior chart highs in the $43-44 area. Accelerating sales revenues growth, strong quarterly earnings comparisons (the C criteria), and increasing institutional interest for this issue.
9/27/2007 - Y - Basically held its ground after 7 straight up sessions. See yesterday's (9/26/07) Stock Bulletin on this high-ranked leader for additional details and an annotated graph (read here). Featured in yellow in the 9/24/07 CANSLIM.net Mid-Day BreakOuts Report (read here) as Monday's gain with volume 4 times its average daily total lifted this high-ranked Aerospace/Defense Equipment leader to challenge its prior chart highs in the $43-44 area. Accelerating sales revenues growth, strong quarterly earnings comparisons (the C criteria), and increasing institutional interest for this issue.
9/26/2007 - Y - Up on more than twice average volume, above its max buy price. See today's (9/26/07) Stock Bulletin on this high-ranked leader for additional details and an annotated graph (read here). Featured in yellow in the 9/24/07 CANSLIM.net Mid-Day BreakOuts Report (read here) as Monday's gain with volume 4 times its average daily total lifted this high-ranked Aerospace/Defense Equipment leader to challenge its prior chart highs in the $43-44 area. Accelerating sales revenues growth, strong quarterly earnings comparisons (the C criteria), and increasing institutional interest for this issue.
9/26/2007 - Y - Up considerably with volume nearly 3 times its average, already near its max buy price. See the Stock Bulletin on this high-ranked leader for additional details and an annotated graph (read here). Featured in yellow in the 9/24/07 CANSLIM.net Mid-Day BreakOuts Report (read here) as Monday's gain with volume 4 times its average daily total lifted this high-ranked Aerospace/Defense Equipment leader to challenge its prior chart highs in the $43-44 area. Accelerating sales revenues growth, strong quarterly earnings comparisons (the C criteria), and increasing institutional interest for this issue.
9/25/2007 - Y - Up considerably with volume nearly 3 times its average, already near its max buy price. Featured in yellow in the 9/24/07CANSLIM.net Mid-Day BreakOuts Report (read here) as Monday's gain with volume 4 times its average daily total lifted this high-ranked Aerospace/Defense Equipment leader to challenge its prior chart highs in the $43-44 area. Accelerating sales revenues growth, strong quarterly earnings comparisons (the C criteria), and increasing institutional interest for this issue.
9/25/2007 - Y - Up considerably with volume heavy, already near its max buy price. Featured in yellow in the 9/24/07ĀCANSLIM.net Mid-Day BreakOuts Report (read here) asĀMonday's gain with volume 4 times its average daily total lifted this high-ranked Aerospace/Defense Equipment leader to challenge its prior chart highs in the $43-44 area. Accelerating sales revenues growth, strong quarterly earnings comparisons (the C criteria), and increasing institutional interest fot this issue.
9/24/2007 - Y - Gain with volume 4 times its average daily total lifted this high-ranked Aerospace/Defense Equipment leader to challenge its prior chart highs in the $43-44 area. Accelerating sales revenues growth, strong quarterly earnings comparisons (the C criteria), and increasing institutional interest fot this issue. Featured in yellow in today's CANSLIM.net Mid-Day BreakOuts Report (read here).
9/24/2007 5:14:38 PM - Y - High-ranked Aerospace/Defense Equipment leader nearly challenging its prior chart highs in the $43-44 area. Accelerating sales revenues growth, strong quarterly earnings comparisons (the C criteria), and increasing institutional interest.