8/8/2024 7:10:49 PM - Challenged its 52-week high with today's volume-driven gain. Quarterly earnings increases through Jun '24 were not strong and steady above the +25% minimum guideline (C criteria).
1/29/2016 1:26:41 PM - Holding its ground in a tight range since gapping up 10/21/15 for a new 52-week high on M&A news. Prior mid-day reports cautioned - "Fundamental concerns remain. Went through a deep consolidation below its 200 DMA line since last noted with caution in the 11/13/14 mid-day report -'Faces resistance due to additional overhead supply up through the $60 level. Quarterly earnings increases through Sep '14 were below the +25% minimum guideline (C criteria). It was dropped from the Featured Stocks list on 10/19/12.'"
1/28/2016 1:04:06 PM - Holding its ground in a tight range since gapping up 10/21/15 for a new 52-week high on M&A news. Prior mid-day reports cautioned - "Fundamental concerns remain. Went through a deep consolidation below its 200 DMA line since last noted with caution in the 11/13/14 mid-day report -'Faces resistance due to additional overhead supply up through the $60 level. Quarterly earnings increases through Sep '14 were below the +25% minimum guideline (C criteria). It was dropped from the Featured Stocks list on 10/19/12.'"
1/21/2016 1:36:17 PM - Held its ground in a tight range after gapping up 10/21/15 hitting a new 52-week high on M&A news. Prior mid-day reports cautioned - "Fundamental concerns remain. Went through a deep consolidation below its 200 DMA line since last noted with caution in the 11/13/14 mid-day report -'Faces resistance due to additional overhead supply up through the $60 level. Quarterly earnings increases through Sep '14 were below the +25% minimum guideline (C criteria). It was dropped from the Featured Stocks list on 10/19/12.'"
1/20/2016 12:49:30 PM - Held its ground in a tight range after gapping up 10/21/15 hitting a new 52-week high on M&A news. Prior mid-day reports cautioned - "Fundamental concerns remain. Went through a deep consolidation below its 200 DMA line since last noted with caution in the 11/13/14 mid-day report -'Faces resistance due to additional overhead supply up through the $60 level. Quarterly earnings increases through Sep '14 were below the +25% minimum guideline (C criteria). It was dropped from the Featured Stocks list on 10/19/12.'"
1/14/2016 12:31:49 PM - Held its ground in a tight range after gapping up 10/21/15 hitting a new 52-week high on M&A news. Prior mid-day reports cautioned - "Fundamental concerns remain. Went through a deep consolidation below its 200 DMA line since last noted with caution in the 11/13/14 mid-day report -'Faces resistance due to additional overhead supply up through the $60 level. Quarterly earnings increases through Sep '14 were below the +25% minimum guideline (C criteria). It was dropped from the Featured Stocks list on 10/19/12.'"
1/12/2016 1:00:34 PM - Gapped up 10/21/15 hitting a new 52-week high on M&A news. The 10/19/15 mid-day report noted - "Fundamental concerns remain. Went through a deep consolidation below its 200 DMA line since last noted with caution in the 11/13/14 mid-day report -'Faces resistance due to additional overhead supply up through the $60 level. Quarterly earnings increases through Sep '14 were below the +25% minimum guideline (C criteria). It was dropped from the Featured Stocks list on 10/19/12.'"
10/22/2015 1:09:38 PM - Gapped up 10/21/15 hitting a new 52-week high on M&A news. The 10/19/15 mid-day report noted - "Fundamental concerns remain. Went through a deep consolidation below its 200 DMA line since last noted with caution in the 11/13/14 mid-day report -'Faces resistance due to additional overhead supply up through the $60 level. Quarterly earnings increases through Sep '14 were below the +25% minimum guideline (C criteria). It was dropped from the Featured Stocks list on 10/19/12.'"
10/21/2015 1:20:00 PM - Gapped up today hitting a new 52-week high on M&A news. The 10/19/15 mid-day report noted - "Fundamental concerns remain. Went through a deep consolidation below its 200 DMA line since last noted with caution in the 11/13/14 mid-day report -'Faces resistance due to additional overhead supply up through the $60 level. Quarterly earnings increases through Sep '14 were below the +25% minimum guideline (C criteria). It was dropped from the Featured Stocks list on 10/19/12.'"
10/19/2015 1:06:26 PM - Fundamental concerns remain. Went through a deep consolidation below its 200 DMA line since last noted with caution in the 11/13/14 mid-day report -"Faces resistance due to additional overhead supply up through the $60 level. Quarterly earnings increases through Sep '14 were below the +25% minimum guideline (C criteria). It was dropped from the Featured Stocks list on 10/19/12."
11/13/2014 12:45:57 PM - Tallying more volume-driven gains this week. Held its ground following a gap up on 10/29/14 hitting a new 52-week high. Prior mid-day reports cautioned members -"Faces resistance due to additional overhead supply up through the $60 level. Quarterly earnings increases through Sep '14 were below the +25% minimum guideline (C criteria). It was dropped from the Featured Stocks list on 10/19/12."
11/3/2014 12:40:56 PM - Gapped up on 10/29/14 hitting a new 52-week high, but it faces resistance due to additional overhead supply up through the $60 level. Quarterly earnings increases through Sep '14 were below the +25% minimum guideline (C criteria). It was dropped from the Featured Stocks list on 10/19/12.
10/30/2014 1:42:51 PM - Quarterly earnings increases through Sep '14 were below the +25% minimum guideline (C criteria). Gapped up on the prior session hitting a new 52-week high, but it faces resistance due to additional overhead supply. It was dropped from the Featured Stocks list on 10/19/12.
10/19/2012 4:42:35 PM - Slumped further below its 50 DMA line today, failing to rebound after damaging distributional losses. based on weak action it will be dropped from the Featured Stocks list tonight. Due to report earnings on Thursday, October 25th. Prior highs in the $48 area define the next chart support level.
10/18/2012 4:47:11 PM - G - Slumped on higher (and above average) volume to 12-week lows today after recent gains lacked volume conviction. Due to report earnings on Thursday, October 25th. Caution is advised unless strength returns and it rises back above its 50 DMA line promptly. Prior highs in the $48 area define the next chart support level.
10/17/2012 3:22:34 PM - G - Slumping to 12-week lows today after recent gains lacked volume conviction. Due to report earnings on Thursday, October 25th. Caution is advised unless strength returns and it rises back above its 50 DMA line promptly. Prior highs in the $48 area define the next chart support level.
10/16/2012 1:05:48 PM - G - Recent weakness raised serious concerns. Halted its slide but failed to rebound. Caution is advised unless strength returns and it rises back above its 50 DMA line promptly. Prior highs in the $48 area define the next chart support level.
10/10/2012 1:42:30 PM - G - Today's loss undercut the 9/26/12 low ($53.78) raising more serious concerns. A secondary buy point was explained in the latest FSU analysis along with a new annotated graph, but caution is advised unless strength returns and it rises back above its 50 DMA line promptly. Prior highs in the $48 area define the next chart support level.
10/9/2012 2:05:22 PM - G - Color code is changed to green while slumping under its 50 DMA line on below average volume for a 3rd consecutive loss, raising concerns. A subsequent violation of the 9/26/12 low ($53.78) could raise more serious concerns and trigger technical sell signals. A secondary buy point was explained in the latest FSU analysis along with a new annotated graph, but caution is advised unless strength returns and it rises back above its 50 DMA line promptly.
10/3/2012 6:24:50 PM - Y - Color code is changed to yellow based on the secondary buy point explained in the latest FSU analysis along with a new annotated graph. A subsequent violation of the 9/26/12 low ($53.78) would raise more serious concerns and trigger technical sell signals.
10/3/2012 1:19:19 PM - G - Sputtering near its 50 DMA line today with light volume behind its latest gains. A subsequent violation of the 9/26/12 low ($53.78) would raise more serious concerns.
10/1/2012 6:59:04 PM - G - Slumped under its 50 DMA line today with a loss on near average volume. A subsequent violation of the 9/26/12 low ($53.78) would raise more serious concerns.
9/27/2012 3:50:03 PM - G - Gain today has it showing resilience near its 50 DMA line following a damaging loss. A subsequent violation of the prior session's low ($53.78) would raise more serious concerns.
9/26/2012 11:48:16 AM - G - Violated its 50 DMA line with a damaging loss today with higher volume raising concerns. Only a prompt rebound above that important short-term average would help its outlook.
9/19/2012 6:21:05 PM - G - Volume totals have been cooling while still holding its ground near its all-time high. Its 50 DMA line defines important chart support to watch on pullbacks.
9/12/2012 4:55:05 PM - G - Volume totals have been cooling while holding its ground near its all-time high. Its 50 DMA line defines important chart support to watch on pullbacks.
9/6/2012 5:14:05 PM - G - Volume was below average today while hitting another new all-time high. Its 50 DMA line and prior highs coincide in the $48 area defining important chart support to watch on pullbacks.
9/4/2012 12:37:08 PM - G - Volume is running at an above average pace today while hitting a new all-time high. Its 50 DMA line and prior highs coincide in the $48 area defining important chart support to watch on pullbacks.
8/29/2012 6:51:18 PM - G - Volume totals have been cooling in recent weeks while still holding its ground stubbornly near its all-time high. Its 50 DMA line and prior highs coincide in the $48 area defining important chart support to watch on pullbacks. See latest FSU analysis for more details and a new annotated graph.
8/27/2012 3:25:21 PM - G - Volume totals have been cooling in recent weeks while still holding its ground stubbornly near its all-time high. Prior highs in the $48 area define initial support to watch on pullbacks.
8/20/2012 4:20:00 PM - G - Volume totals have been cooling in recent weeks while still hovering near its all-time high. Prior highs in the $48 area define initial support to watch on pullbacks.
8/15/2012 4:02:37 PM - G - Volume totals have been cooling in recent weeks while holding its ground stubbornly near its all-time high. Prior highs in the $48 area define initial support to watch on pullbacks.
8/10/2012 4:35:28 PM - G - Pulling back from its all-time high today with a 3rd consecutive loss on light volume. Prior highs in the $48 area define initial support to watch on pullbacks.
8/6/2012 5:30:45 PM - G - Hit a new all-time high today with a 3rd consecutive gain on light volume. Prior highs in the $48 area define initial support to watch on pullbacks.
8/1/2012 6:17:48 PM - G - Hovering near its all-time high. Prior highs in the $48 area define initial support to watch on pullbacks.
7/30/2012 6:18:32 PM - G - Paused today following 3 consecutive volume-driven gains for new all-time highs. Prior highs in the $48 area define initial support to watch on pullbacks. See the latest FSU analysis for more details and a new annotated graph.
7/26/2012 12:40:54 PM - G - Gapped up today and rallied beyond its "max buy" level with above average volume behind its 2nd consecutive gain, and its color code was changed to green after quickly getting extended. Reported earnings +50% on +40% sales revenues for the quarter ended June 30, 2012 versus the year ago period. Gapped up on the prior session and spiked to a new 52-week high, finishing strong with a considerable gain backed by 4 times average volume. It was rallying above its 50 DMA line and on the rise when highlighted in yellow in 7/25/12 mid-day report (read here) with new pivot point cited based on its 6/19/12 high while rallying from a "double bottom" base pattern and noted - "It has shown resilience since dropped on 7/09/12 from the Featured Stocks list. A strong finish above its pivot point may clinch a technical buy signal, however the M criteria now argues against any new buying efforts until the major averages confirm a new rally with another follow-through day."
7/26/2012 11:40:42 AM - G - Gapped up today and rallied beyond its "max buy" level, and its color code is changed to green after quickly getting extended. Reported earnings +50% on +40% sales revenues for the quarter ended June 30, 2012 versus the year ago period. Gapped up on the prior session and spiked to a new 52-week high, finishing strong with a considerable gain backed by 4 times average volume. It was rallying above its 50 DMA line and on the rise when highlighted in yellow in 7/25/12 mid-day report (read here) with new pivot point cited based on its 6/19/12 high while rallying from a "double bottom" base pattern and noted - "It has shown resilience since dropped on 7/09/12 from the Featured Stocks list. A strong finish above its pivot point may clinch a technical buy signal, however the M criteria now argues against any new buying efforts until the major averages confirm a new rally with another follow-through day."
7/25/2012 5:50:15 PM - Y - Reported earnings +50% on +40% sales revenues for the quarter ended June 30, 2012 versus the year ago period. Gapped up today, spiked to a new 52-week high and finished strong with a considerable gain backed by 4 times average volume. It was rallying above its 50 DMA line and on the rise when highlighted in yellow in today's mid-day report (read here) with new pivot point cited based on its 6/19/12 high while rallying from a "double bottom" base pattern and noted - "It has shown resilience since dropped on 7/09/12 from the Featured Stocks list. A strong finish above its pivot point may clinch a technical buy signal, however the M criteria now argues against any new buying efforts until the major averages confirm a new rally with another follow-through day."
7/25/2012 1:02:45 PM - Y - Reported earnings +50% on +40% sales revenues for the quarter ended June 30, 2012 versus the year ago period. Gapped up today, spiking to a new 52-week high quickly after rallying above its 50 DMA line helped its technical stance improve. Color code is changed to yellow with new pivot point cited based on its 6/19/12 high while rallying from a "double bottom" base pattern. It has shown resilience since dropped on 7/09/12 from the Featured Stocks list. A strong finish above its pivot point may clinch a technical buy signal, however the M criteria now argues against any new buying efforts until the major averages confirm a new rally with another follow-through day.
7/9/2012 11:24:55 AM - Gapped down today for another damaging loss following an analyst downgrade, violating the previously noted 6/04/11 low ($41.24) and triggering a more worrisome technical sell signal. Faces resistance due to overhead supply up through the $48 level, and it will be dropped from the Featured Stocks list tonight.
7/6/2012 6:19:06 PM - G - Damaging loss today on near average volume led to a close well below its 50 DMA line. Gains above that short-term average are needed to help its technical stance. The previously noted 6/04/11 low ($41.24) defines important support to watch.
7/3/2012 1:56:11 PM - G - Today's 3rd consecutive gain on lighter volume lifted it to its 50 DMA line. Gains above that short-term average would help its technical stance. The previously noted 6/04/11 low ($41.24) defines important support to watch.
6/29/2012 6:10:40 PM - G - Gapped up today yet it remains below its 50 DMA line. A rebound above that short-term average would help its technical stance. The previously noted 6/04/11 low ($41.24) defines important support to watch.
6/28/2012 5:51:41 PM - G - Gapped down today and slumped further below its 50 DMA line with a loss on higher (near average) volume raising concerns while bearing down on the previously noted 6/04/11 low ($41.24) which defines important support to watch.
6/25/2012 1:04:29 PM - G - Today's loss has it slumping under its 50 DMA line raising concerns, and its color code is changed to green. The 6/04/11 low ($41.24) defines important support to watch on pullbacks.
6/22/2012 5:25:21 PM - Y - Posted a gain today with more than 5 times average volume, rallying from support at its 50 DMA line. A valid secondary buy point exists up to +5% above the recent high. The 6/04/11 low ($41.24) defines important support to watch on pullbacks.
6/21/2012 10:16:14 AM - Y - Consolidating above its 50 DMA line. A valid secondary buy point exists up to +5% above the recent high. The 6/04/11 low ($41.24) defines important support to watch on pullbacks.
6/18/2012 5:10:37 PM - Y - Posted a 3rd consecutive gain today with ever increasing volume. Color code was changed to yellow while no new pivot point was cited, yet it was noted that a valid secondary buy point exists up to +5% above the recent high. Its 50 DMA line and the 6/04/11 low ($41.24) define important support top watch on pullbacks.
6/15/2012 8:25:22 PM - Y - Color code is changed to yellow while no new pivot point is cited, yet a valid secondary buy point exists up to +5% above the recent high. Consolidating above its 50 DMA line and prior highs defining important chart support. A damaging violation of that short-term average and the 6/04/11 low ($41.24) would trigger a more worrisome technical sell signals. See the latest FSU analysis for more details and a new annotated graph.
6/14/2012 6:52:41 PM - G - Consolidating just above its 50 DMA line today with a gain on below average volume. A damaging violation of that short-term average and the 6/04/11 low ($41.24) would trigger a more worrisome technical sell signals.
6/11/2012 4:50:47 PM - G - Slumped back toward its 50 DMA line and finished near the session low with a loss today on higher but below average volume. A damaging violation of that short-term average and the 6/04/11 low ($41.24) would trigger a more worrisome technical sell signals.
6/6/2012 6:07:53 PM - G - Posted a 2nd consecutive gain on lighter volume today after halting its 4-session slide at its 50 DMA line. A damaging violation of that short-term average and the prior session's low ($41.24) would trigger a more worrisome technical sell signal.
6/5/2012 5:12:00 PM - G - Small gain on light volume today halted its 4-session slide at its 50 DMA line. A damaging violation of that short-term average and the prior session's low ($41.24) would trigger a more worrisome technical sell signal.
6/1/2012 1:51:44 PM - G - Damaging loss today has undercut prior lows and has it slumping near its 50 DMA line defining important support. A violation of that short-term average may trigger a more worrisome technical sell signal.
5/30/2012 2:03:41 PM - G - Small gap down today from a best-ever close and new all-time high hit on the prior session. It did not form a sound new base of sufficient length.
5/29/2012 4:50:35 PM - G - Inched higher with light volume for another new all-time high today. It did not form a sound new base of sufficient length.
5/23/2012 4:26:37 PM - G - Rallied to a new all-time high today with a considerable gain on below average volume. It did not form a sound new base of sufficient length, and the market (M criteria) is currently in need of a follow-through day to confirm a new rally.
5/21/2012 7:08:21 PM - G - Finished near the session high today with a gain on light volume. Consolidating above prior highs since it was featured again on 4/26/12 following a considerable gap up gain on heavy volume. See latest FSU analysis for more details and a new annotated graph.
5/21/2012 4:43:17 PM - G - Finished near the session high today with a gain on light volume. Consolidating above prior highs since it was featured again on 4/26/12 following a considerable gap up gain on heavy volume
5/15/2012 12:45:23 PM - G - Rallying well above its "max buy" level with today's gain. It triggered a technical buy signal on 4/26/12 as it was featured in the mid-day report and noted - "Reported earnings +43% on +39% sales revenues for the quarter ended March 31, 2012 versus the year ago period. It held its ground stubbornly after violating its 50 DMA line when a damaging loss with above average volume triggered technical sell signals on 4/10/12 and it was dropped from the Featured Stocks list. Earnings below the +25% guideline for the Dec '11 quarter (+21%) had also raised fundamental concerns at that time, however the stock's resilience and impressive acceleration means that 3 of the past 4 quarterly comparisons are now above the minimum guideline concerning the C criteria. Its annual earnings (A criteria) history has been strong."
5/11/2012 1:26:12 PM - G - Consolidating near its "max buy" level this week. It triggered a technical buy signal on 4/26/12 as it was featured in the mid-day report and noted - "Reported earnings +43% on +39% sales revenues for the quarter ended March 31, 2012 versus the year ago period. It held its ground stubbornly after violating its 50 DMA line when a damaging loss with above average volume triggered technical sell signals on 4/10/12 and it was dropped from the Featured Stocks list. Earnings below the +25% guideline for the Dec '11 quarter (+21%) had also raised fundamental concerns at that time, however the stock's resilience and impressive acceleration means that 3 of the past 4 quarterly comparisons are now above the minimum guideline concerning the C criteria. Its annual earnings (A criteria) history has been strong."
5/7/2012 1:09:56 PM - G - Pulling back today after holding its ground last week. Quickly got extended from its prior base after it triggered a technical buy signal on 4/26/12 as it was featured in the mid-day report and noted - "Reported earnings +43% on +39% sales revenues for the quarter ended March 31, 2012 versus the year ago period. It held its ground stubbornly after violating its 50 DMA line when a damaging loss with above average volume triggered technical sell signals on 4/10/12 and it was dropped from the Featured Stocks list. Earnings below the +25% guideline for the Dec '11 quarter (+21%) had also raised fundamental concerns at that time, however the stock's resilience and impressive acceleration means that 3 of the past 4 quarterly comparisons are now above the minimum guideline concerning the C criteria. Its annual earnings (A criteria) history has been strong."
4/27/2012 6:58:59 PM - G - Color code is changed to green after getting more extended from its prior highs with today's 3rd consecutive volume-driven gain. The volume-driven gain to new highs triggered a new buy signal on 4/26/12 as it was featured in the mid-day report and noted - "Reported earnings +43% on +39% sales revenues for the quarter ended March 31, 2012 versus the year ago period. It held its ground stubbornly after violating its 50 DMA line when a damaging loss with above average volume triggered technical sell signals on 4/10/12 and it was dropped from the Featured Stocks list. Earnings below the +25% guideline for the Dec '11 quarter (+21%) had also raised fundamental concerns at that time, however the stock's resilience and impressive acceleration means that 3 of the past 4 quarterly comparisons are now above the minimum guideline concerning the C criteria. Its annual earnings (A criteria) history has been strong."
4/26/2012 1:19:45 PM - Y - Reported earnings +43% on +39% sales revenues for the quarter ended March 31, 2012 versus the year ago period. It held its ground stubbornly after violating its 50 DMA line when a damaging loss with above average volume triggered technical sell signals on 4/10/12 and it was dropped from the Featured Stocks list. Earnings below the +25% guideline for the Dec '11 quarter (+21%) had also raised fundamental concerns at that time, however the stock's resilience and impressive acceleration means that 3 of the past 4 quarterly comparisons are now above the minimum guideline concerning the C criteria. Its annual earnings (A criteria) history has been strong. Color code is changed to yellow with pivot point based on its 3/26/12 high plus 10 cents after a short flat base or "square box" base pattern. The volume-driven gain to new highs triggered a new buy signal.
4/10/2012 5:54:30 PM - Violated its 50 DMA line and sank to a close below a prior low ($35.72 on 3/06/12) as a damaging loss today with above average volume triggered technical sell signals. Earnings below the +25% guideline for the Dec '11 quarter raised fundamental concerns. A prompt rebound above the short-term average would help its outlook improve, however, based on its recent deterioration it is being dropped from the Featured Stocks list tonight.
4/5/2012 4:06:15 PM - G - Finished near the session high today, finding prompt support after slumping under its 50 DMA line and near its prior low ($35.72 on 3/06/12). Subsequent deterioration would raise greater concerns and trigger technical sell signals. Earnings below the +25% guideline for the Dec '11 quarter raised fundamental concerns.
4/4/2012 10:52:04 AM - G - Gapped down today, slumping toward its 50 DMA line. That important short-term average and its prior low ($35.72 on 3/06/12) define chart support where violations would raise concerns and trigger technical sell signals. Earnings below the +25% guideline for the Dec '11 quarter raised fundamental concerns.
3/28/2012 11:06:58 AM - G - Pulling back from its new all-time high hit with a volume-driven gain on Monday. It is extended from its last sound base pattern. Earnings below the +25% guideline for the Dec '11 quarter raised fundamental concerns, yet its bullish technical action has argued for disciplined investors to give it the benefit of the doubt until technical sell signals occur.
3/26/2012 1:15:00 PM - G - Gapped up for another new all-time high today, getting more extended from its last sound base pattern. Earnings below the +25% guideline for the Dec '11 quarter raised fundamental concerns, yet its bullish technical action has argued for disciplined investors to give it the benefit of the doubt until technical sell signals occur.
3/21/2012 12:11:27 PM - G - Touched a new all-time high today after a less than 4-week consolidation while remaining well above its 50 DMA line and prior chart highs defining support levels. Earnings below the +25% guideline for the Dec '11 quarter raised fundamental concerns. See the latest FSU analysis for more details and a new annotated graph.
3/16/2012 6:13:21 PM - G - Pulled back today with light volume, finishing -4.4% off its all-time high. Earnings below the +25% guideline for the Dec '11 quarter raised fundamental concerns. See the latest FSU analysis for more details and a new annotated graph.
3/15/2012 9:34:44 PM - G - Posted a gain today with very light volume. Earnings below the +25% guideline for the Dec '11 quarter raised fundamental concerns.
3/12/2012 6:15:03 PM - G - Posted a 4th consecutive small gain today. Earnings below the +25% guideline for the Dec '11 quarter raised fundamental concerns.
3/9/2012 8:47:24 PM - G - Posted a 3rd consecutive gain today with volume picking up. Earnings below the +25% guideline for the Dec '11 quarter raised fundamental concerns.
3/6/2012 11:07:14 AM - G - Small gap down today slumping back toward its "max buy" level after recently wedging higher without great volume conviction. Earnings below the +25% guideline for the Dec '11 quarter raised fundamental concerns.
3/1/2012 5:07:07 PM - G - Posted a solid gain today on higher volume following 4 consecutive small losses on light volume while retreating from its all-time high. It is extended from its latest base. Earnings below the +25% guideline for the Dec '11 quarter raised fundamental concerns.
2/29/2012 4:40:22 PM - G - Pulled back on below average volume today for a 4th consecutive small loss, retreating from its all-time high. It is extended from its latest base. Earnings below the +25% guideline for the Dec '11 quarter raised fundamental concerns.
2/23/2012 6:27:18 PM - G - Hit another new all-time high today with a gain on light volume, getting more extended from its latest base. Earnings below the +25% guideline for the Dec '11 quarter raised fundamental concerns.
2/21/2012 1:37:42 PM - G - Quietly touched a new all-time high today, and it is extended from its latest base. Reported earnings +21% on +34% sales revenues for the quarter ended December 31, 2011 versus the year ago period. Earnings below the +25% guideline raise fundamental concerns.
2/15/2012 3:15:16 PM - G - Pulling back from its all-time high with a loss on slightly higher volume today indicative of mild distributional pressure. It is extended from its latest base. Reported earnings +21% on +34% sales revenues for the quarter ended December 31, 2011 versus the year ago period. Earnings below the +25% guideline raise fundamental concerns.
2/14/2012 6:28:17 PM - G - Finished at a new high close with today's gain on lighter volume adding to its recent spurt, getting more extended from its latest base. Reported earnings +21% on +34% sales revenues for the quarter ended December 31, 2011 versus the year ago period. Earnings below the +25% guideline raise fundamental concerns.
2/9/2012 4:22:09 PM - G - Hit another new all-time high with today's volume-driven gain adding to its recent spurt, getting more extended from its latest base. No resistance remains due to overhead supply. Reported earnings +21% on +34% sales revenues for the quarter ended December 31, 2011 versus the year ago period. Earnings below the +25% guideline raise fundamental concerns.
2/8/2012 1:09:39 PM - G - Perched at its all-time high today, its color code is changed to green after getting extended from its latest base. No resistance remains due to overhead supply. Reported earnings +21% on +34% sales revenues for the quarter ended December 31, 2011 versus the year ago period. Earnings below the +25% guideline raise fundamental concerns.
2/7/2012 12:50:02 PM - Y - Gapped up today and hit another new high. Reported earnings +21% on +34% sales revenues for the quarter ended December 31, 2011 versus the year ago period. Earnings below the +25% guideline raise fundamental concerns. No resistance remains due to overhead supply.
2/6/2012 1:13:39 PM - Y - Gapped up today for another new high then reversed into the red. The prior session's gain with nearly 3 times average volume triggered a technical buy signal. No resistance remains due to overhead supply.
2/3/2012 6:45:01 PM - Y - Gapped up today and rallied with nearly 3 times average volume for a considerable gain above its pivot point after an 8-week consolidation, triggering a technical buy signal. No resistance remains due to overhead supply.
2/3/2012 2:07:42 PM - Y - Gapped up today, rallying with above average volume for a considerable gain and trading above its pivot point after an 8-week consolidation. No resistance remains due to overhead supply.
2/2/2012 2:59:38 PM - Y - Up again today rising near its pivot point without great volume conviction. Quietly wedging higher after an 8-week consolidation. No resistance remains due to overhead supply. Disciplined investors may watch for a convincing burst of institutional buying to confirm a new technical buy signal.
2/1/2012 3:15:39 PM - Y - Up today, quietly wedging higher after an 8-week consolidation, with little resistance remaining due to overhead supply. Disciplined investors may watch for a fresh burst of institutional buying to confirm a new technical buy signal. See the latest FSU analysis for more details and a new annotated weekly graph.
1/26/2012 5:16:08 PM - Y - Closed near the session low today, a sign it was encountering some resistance due to overhead supply. It is perched above its 50 DMA line and just -7.5% off its 52-week high after an 8-week consolidation. In the mid-day report earlier it was highlighted in yellow with a new pivot point cited based on its 52-week high plus 10 cents. It has shown resilience since dropped from the Featured Stocks list on 1/04/12. Disciplined investors may watch for a fresh burst of institutional buying to confirm a new technical buy signal. See the latest FSU analysis for more details and a new annotated weekly graph.
1/26/2012 1:00:04 PM - Y - Recently rebounded above its 50 DMA line and it is -6.2% off its 52-week high today after an 8-week consolidation. Color code is changed to yellow and a new pivot point is cited based on its 52-week high plus 10 cents. It has shown resilience since dropped from the Featured Stocks list on 1/04/12. Disciplined investors may watch for a fresh burst of institutional buying to confirm a new technical buy signal.
1/4/2012 3:57:47 PM - Rebounding into the upper half of its intra-day range now, but it is down with higher volume than the prior session total. It is still below its 50 DMA line, and based on weakness and distributional action it is -16% off its 52-week high. It will be dropped from the Featured Stocks list tonight. Prior highs in the $25-26 area and its 200 DMA line define the next important area of chart support.
12/30/2011 3:56:52 PM - G - Slumping further below its 50 DMA line today with another loss on light volume. A rebound above that important short-term average is needed for its outlook to improve. Prior highs in the $25-26 area and its 200 DMA line define the next important area of chart support.
12/27/2011 1:08:11 PM - G - Still lingering below its 50 DMA line after damaging losses triggered worrisome technical sell signals, and a rebound above that important short-term average is needed for its outlook to improve. Prior highs in the $25-26 area and its 200 DMA line define the next important area of chart support.
12/21/2011 11:17:57 AM - G - Considerable loss today has it trading below its 50 DMA line (now $29.04) raising some concerns. Subsequent deterioration below its 12/14/11 low ($28.50) may trigger a more worrisome technical sell signal leading to a deeper consolidation including a possible revisit to prior chart highs in the $25-26 area or its 200 DMA line.
12/20/2011 2:05:19 PM - G - Gapped up today for a gain on light volume. Halted its slide after slumping near its 50 DMA line, and that important short-term average was noted as initial support to watch above prior chart highs.
12/16/2011 4:40:55 PM - G - Halted its slide after slumping near its 50 DMA line this week. That important short-term average was noted as initial support to watch above prior chart highs.
12/14/2011 2:30:12 PM - G - Down today for a 3rd consecutive loss with volume running at an above average pace while trading near its 50 DMA line noted as initial support to watch above prior chart highs.
12/13/2011 6:56:19 PM - G - Pulled back today for a 2nd consecutive loss with near average volume. It is still extended from its prior base, and its 50 DMA line defines initial chart support to watch on pullbacks.
12/12/2011 12:46:39 PM - G - Pulling back today amid widespread market weakness, yet still perched within -5% of its all-time high. Extended from its prior base, its prior highs in the $25-26 area define initial chart support to watch on pullbacks.
12/9/2011 1:47:43 PM - G - Up today within close striking distance of a new all-time high. Extended from its prior base, its prior highs in the $25-26 area define initial chart support to watch on pullbacks.
12/7/2011 5:49:27 PM - G - Down today with below average volume, pulling back from its all-time high. Extended from its prior base, its prior highs in the $25-26 area define initial chart support to watch on pullbacks.
12/5/2011 5:02:28 PM - G - Gain today with below average volume, finishing at a best-ever close, getting extended from its prior base. Prior highs in the $25-26 area define initial chart support to watch on pullbacks.
11/30/2011 11:43:10 AM - G - Gapped up today for a considerable gain and a new all-time high, getting extended from its prior base. Prior highs in the $25-26 area define initial chart support to watch on pullbacks.
11/28/2011 7:57:25 PM - G - Small gap up today on near average volume. Recently holding its ground in a tight trading range near its all-time high. Prior highs in the $25-26 area define initial chart support to watch on pullbacks.
11/22/2011 5:41:42 PM - G - Holding its ground near its all-time high, extended from its previous base pattern. Prior highs in the $25-26 area define initial chart support to watch on pullbacks. See the latest FSU analysis for more details and a new annotated graph.
11/21/2011 1:19:55 PM - G - Managed a positive reversal after a small gap down today, and it is now perched only -2.4% off its all-time high. It is extended from its previous base pattern. Prior highs in the $25-26 area define initial chart support to watch on pullbacks.
11/18/2011 5:44:43 PM - G - Pulling back on near average volume today, finishing -5.6% off its all-time high. It is extended from its previous base pattern. Prior highs in the $25-26 area define initial chart support to watch on pullbacks.
11/17/2011 7:02:02 PM - G - Hovering near all-time highs today, holding its ground with volume quiet. It is extended from its previous base pattern. Prior highs in the $25-26 area define initial chart support to watch on pullbacks.
11/16/2011 6:02:16 PM - G - Up today with above average volume for a best-ever close. It is extended from its previous base pattern. Prior highs in the $25-26 area define initial chart support to watch on pullbacks.
11/11/2011 4:31:37 PM - G - Small gap up today for an 8th consecutive gain into new high territory. It is extended from its previous base pattern. Prior highs in the $25-26 area define initial chart support to watch on pullbacks.
11/10/2011 12:53:00 PM - G - On track today for a 7th consecutive small gain into new high territory. It is extended from its previous base pattern. Prior highs in the $25-26 area define initial chart support to watch on pullbacks.
11/9/2011 1:17:13 PM - G - On track today for a 6th consecutive small gain into new high territory. It is extended from its previous base pattern. Prior highs in the $25-26 area define initial chart support to watch on pullbacks.
11/4/2011 6:41:16 PM - G - Small gain on light volume today helped it rise to its best close ever. It is extended from its previous base pattern. Prior highs in the $25-26 area define initial chart support to watch on pullbacks.
11/3/2011 6:47:48 PM - G - Added to its spurt of volume-driven gains today, rallying to its second-best close ever. It is extended from its previous base pattern. Prior highs in the $25-26 area define initial chart support to watch on pullbacks.
11/2/2011 6:10:19 PM - G - Holding its ground near all-time highs, extended from its previous base pattern. Prior highs in the $25-26 area define initial chart support to watch on pullbacks.
11/1/2011 1:34:55 PM - G - Pulling back today following 3 consecutive volume-driven gains for new all-time highs. Prior highs in the $25-26 area define initial chart support to watch on pullbacks.
10/31/2011 6:33:02 PM - G - Up today for a 3rd consecutive volume-driven gain and another new all-time high. Prior highs in the $25-26 area define initial chart support to watch on pullbacks.
10/31/2011 1:02:51 PM - G - Up today for a 3rd consecutive volume-driven gain and another new all-time high. Color code was changed to green after quickly getting extended from its latest base. See the latest FSU analysis for more details and an annotated graph.
10/28/2011 6:49:04 PM - Y - Posted a second consecutive volume-driven gain today for a new all-time high. Color code is changed to green after quickly getting extended from its latest base. See the latest FSU analysis for more details and an annotated graph.
10/28/2011 1:42:07 PM - Y - Holding its ground today. Gapped up on 10/27/11 after reporting earnings +48% on +31% sales revenues for the quarter ended September 30, 2011 versus the year ago period. Color code was changed to yellow with new pivot point cited based on the 8/31/11 high, and its "breakaway gap" cleared a "double bottom" base formed since 7/21/11 when it was dropped from the Featured Stocks list. See the latest FSU analysis for more details and an annotated graph.
10/27/2011 1:42:34 PM - Y - Gapped up today after reporting earnings +48% on +31% sales revenues for the quarter ended September 30, 2011 versus the year ago period. Color code is changed to yellow with new pivot point cited based on the 8/31/11 high, and today's "breakaway gap" helped it technically break out from a "double bottom" base formed since 7/21/11 when it was dropped from the Featured Stocks list.
8/31/2011 1:03:33 PM - Approaching its 52-week high today while wedging higher this week without great volume conviction. Its deep 9-week consolidation included a brief dip below its 200 DMA line since last noted on 7/21/11 as it was dropped from the Featured Stocks list. Technically, the rebound above its 50 DMA line helps its outlook to improve, but it has not formed a sound base pattern.
7/21/2011 2:36:17 PM - Down today on above average volume for its 9th loss in the span of 10 sessions. Prior lows in the $22 area and its 200 DMA line may act as resistance, however due to its technical deterioration it will be dropped from the Featured Stocks list tonight. A rebound above its 50 DMA line is needed fro its outlook to improve.
7/20/2011 6:25:22 PM - G - After violating its 50 DMA line that short-term average acted as a resistance level. The loss today on near average volume led to its lowest close since 5/25/11.
7/19/2011 3:59:13 PM - G - Small gain today on light volume following a streak of 7 consecutive losses. After the recent violation of its 50 DMA line triggered a technical sell signal, that short-term average may now act as a resistance level
7/14/2011 3:40:11 PM - G - Color code is changed to green after a more damaging loss today with heavier volume, its 5th consecutive loss, leading to a violation of its 50 DMA line triggering a technical sell signal.
7/13/2011 8:59:28 PM - Y - Finished near the session low today with a 4th consecutive loss on near average volume. It closed below its old high closes prior to its latest breakout, raising concerns while testing support at its 50 DMA line. More damaging losses would raise concerns and trigger technical sell signals.
7/11/2011 5:05:52 PM - Y - Finished near the session high today with a small loss on below average volume, a sign of prompt support after a gap down and early weakness that tested near recent chart lows and its 50 DMA line. Its color code was changed to yellow after the quiet pullback without heavy volume. More damaging losses would raise concerns and trigger technical sell signals.
7/11/2011 10:54:05 AM - Y - Gapped down today, slumping under its pivot point and near recent lows and its 50 DMA line. Its color code is changed to yellow after the quiet pullback without heavy volume. However, more damaging losses would raise concerns and trigger technical sell signals.
7/7/2011 4:20:18 PM - G - Gapped up today and rallied to a best ever close with +47% above average volume behind its gain. Color code is changed to green. Prior resistance in the $24-25 area defines support.
7/1/2011 4:15:09 PM - Y - Quietly holding its ground between its pivot point and "max buy" level. Prior resistance in the $24-25 area defines support. A subsequent close under its old high close ($24.77 on 4/25/11) would raise concerns by negating its recent breakout.
6/28/2011 1:21:00 PM - Y - Rising back above its pivot point today with slightly higher volume behind its gain. Prior resistance in the $24-25 area defines support, and a subsequent close under its old high close ($24.77 on 4/25/11) would raise concerns by negating its recent breakout.
6/24/2011 3:39:09 PM - Y - Consolidating back under its pivot point today with a loss on light volume. Prior resistance in the $24-25 area defines support. A close under its old high close ($24.77 on 4/25/11) would raise concerns by negating its recent breakout.
6/22/2011 1:16:09 PM - Y - Consolidating above its pivot point today following a volume-driven gain on the prior session. Following its recent breakout there was a worrisome negative reversal on 6/15/11 with volume 4 times average after hitting a new 52-week high. Prior resistance in the $24-25 area acted as a support level.
6/21/2011 12:49:00 PM - Y - Small gap up gain today, rising further above its pivot point. Following its recent breakout there was a worrisome negative reversal on 6/15/11 with volume 4 times average after hitting a new 52-week high. Prior resistance in the $24-25 area acted as a support level.
6/20/2011 5:12:59 PM - Y - Small gain today with +18% above average volume, rising back above its pivot point. Following its recent breakout there was a worrisome negative reversal on 6/15/11 with volume 4 times average after hitting a new 52-week high. Prior resistance in the $24-25 area may now act as an initial support level. Previously noted - "Concerns remain until a follow-through day confirms the broader market (M criteria) is truly favorable."
6/17/2011 3:42:56 PM - Y - Quietly slumping under its pivot point today. Following its recent breakout there was a worrisome negative reversal on 6/15/11 with volume 4 times average after hitting a new 52-week high. Prior resistance in the $24-25 area may now act as an initial support level. Previously noted - "Concerns remain until a follow-through day confirms the broader market (M criteria) is truly favorable."
6/16/2011 12:29:33 PM - Y - Posting a small gain today following a worrisome negative reversal on 6/15/11 with volume 4 times average after hitting a new 52-week high. Prior resistance in the $24-25 area may now act as an initial support level. Previously noted - "Concerns remain until a follow-through day confirms the broader market (M criteria) is truly favorable."
6/15/2011 5:18:47 PM - Y - Hit another new high and traded above its max buy level today, but closed at the session low with a loss after a worrisome negative reversal with volume 4 times average. Technically, it had gapped up and rallied for a considerable gain with heavy volume above its pivot point on 6/14/11 and triggered a technical buy signal. Previously noted - "Concerns remain until a follow-through day confirms the broader market (M criteria) is truly favorable."
6/15/2011 12:07:12 PM - Y - Hit another new high today then reversed into the red. Technically, it gapped up and rallied for a considerable gain with heavy volume above its pivot point on the prior session. It triggered a technical buy signal and quickly spiked near its "max buy" level, however concerns remain until a follow-through day confirms the broader market (M criteria) is truly favorable.
6/14/2011 12:37:34 PM - Y - Gapped up today, posting a considerable gain with heavy volume above its pivot point for a new all-time high. It has quickly spiked near its "max buy" level. Concerns remain until a follow-through day confirms the broader market (M criteria) is favorable.
6/14/2011 11:58:40 AM - Y - Gapped up today for a considerable gain with heavy volume, trading above its pivot point to a new all-time high near its "max buy" level. No overhead supply remains to hinder its progress. Concerns remain until a follow-through day confirms the broader market (M criteria) is favorable.
6/13/2011 6:45:39 PM - Y - Gain today with higher volume leaves it perched just -2.0% off its all-time high. Minimal overhead supply remains to hinder its progress. To trigger a buy signal it needs a gain above its pivot point with sufficient volume and a follow-through day to confirm the broader market (M criteria) is favorable.
6/10/2011 5:30:18 PM - Y - Perched -4.3% off its all-time high after today's loss on average volume. Minimal overhead supply remains to hinder its progress. To trigger a buy signal it needs a gain above its pivot point with sufficient volume and a follow-through day to confirm the broader market (M criteria) is favorable.
6/8/2011 7:15:13 PM - Y - Perched -2.9% off its all-time high today, and no overhead supply remains to hinder its progress. Color code was changed to yellow when featured in the 6/07/11 mid-day report with an annotated daily graph after an orderly base with pivot point based upon its 52-week high plus 10 cents. To trigger a buy signal it needs a gain above its pivot point with sufficient volume and a follow-through day to confirm the broader market (M criteria) is favorable. See the latest FSU analysis for more details and a new annotated weekly graph.
6/8/2011 12:45:33 PM - Y - Perched -2.2% off its all-time high today, and no overhead supply remains to hinder its progress. Color code was changed to yellow after an orderly base with pivot point based upon its 52-week high plus 10 cents. To trigger a buy signal it needs a gain above its pivot point with sufficient volume and a follow-through day to confirm the broader market (M criteria) is favorable. Reported earnings +31% on +25% sales revenues for the quarter ended March 31, 2011 versus the year ago period. Prior quarterly comparisons showed sales and earnings near the investment system guidelines. It survived but failed to impress since it was dropped from the Featured Stocks list on 10/28/09.
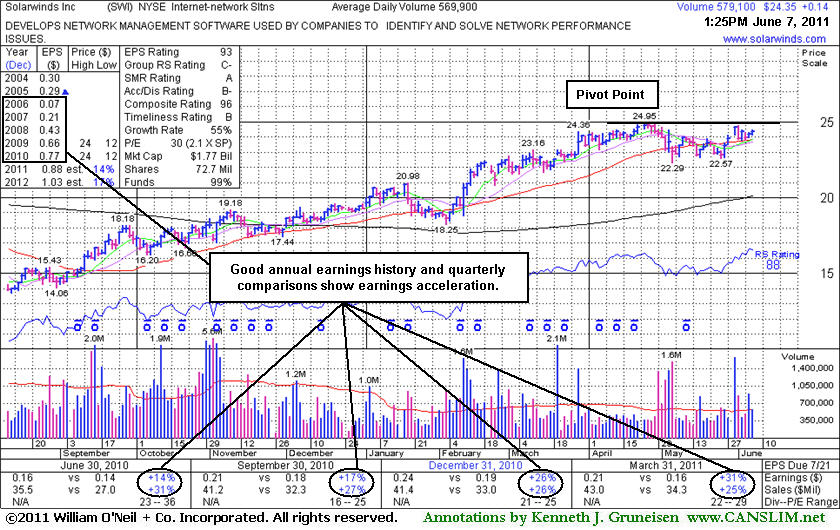
6/7/2011 - Y - Perched -2.8% off its all-time high today, and no overhead supply remains to hinder its progress. Color code is changed to yellow after an orderly base with pivot point based upon its 52-week high plus 10 cents. To trigger a buy signal it needs a gain above its pivot point with sufficient volume and a follow-through day to confirm the broader market (M criteria) is favorable. Reported earnings +31% on +25% sales revenues for the quarter ended March 31, 2011 versus the year ago period. Prior quarterly comparisons showed sales and earnings near the investment system guidelines. It survived but failed to impress since it was dropped from the Featured Stocks list on 10/28/09.
�
4/29/2011 2:09:19 PM - This week it quietly matched its all-time high, and no overhead supply remains to hinder its progress. It survived but failed to impress since it was dropped from the Featured Stocks list on 10/28/09. Recent quarterly comparisons showed sales and earnings near or below the investment system guidelines. Due to report earnings on Wednesday, May 4th.
10/28/2009 7:06:22 PM - G - Considerable loss today on light volume for its lowest close since July 22nd. Prior sell signals were noted, and based on weak action it is now -25% off its 52-week high. It will be dropped from the Featured Stocks list tonight. This high-ranked Computer Software - Enterprise firm was recently featured in the October 2009 issue of CANSLIM.net News (read here).
10/28/2009 3:13:25 PM - G - Down today for a considerable loss on rather light volume, nearing its August lows. Prior sell signals were noted, and based on weak action it is now -25% off its 52-week high. It will be dropped from the Featured Stocks list tonight. This high-ranked Computer Software - Enterprise firm was recently featured in the October 2009 issue of CANSLIM.net News (read here).
10/27/2009 6:37:42 PM - G - Holding its ground in the $19-20 area for the past 4 sessions with volume generally cooling off, yet it has failed to rebound following gaps down on 10/20 & 10/21 for considerable losses with heavy volume. It violated its 50 DMA line and recent chart lows in the $20.50 area, triggering technical sell signals. It would need to promptly repair its 50 DMA violation for its outlook to improve. This high-ranked Computer Software - Enterprise firm was featured in the October 2009 issue of CANSLIM.net News (read here).
10/26/2009 6:29:44 PM - G - Down today on above average volume after failing last week to rebound following gaps down on 10/20 & 10/21 for considerable losses with heavy volume. It violated its 50 DMA line and recent chart lows in the $20.50 area, triggering technical sell signals. It would need to promptly repair its 50 DMA violation for its outlook to improve. This high-ranked Computer Software - Enterprise firm was featured in the October 2009 issue of CANSLIM.net News (read here).
10/23/2009 5:20:46 PM - G - Halted its slide this week but failed to rebound after gaps down on 10/20 & 10/21 for considerable losses with heavy volume violated its 50 DMA line and recent chart lows in the $20.50 area, triggering technical sell signals. Its color code was changed to green based on the weakness, and it would need to promptly repair its 50 DMA violation for its outlook to improve. This high-ranked Computer Software - Enterprise firm was featured in the October 2009 issue of CANSLIM.net News (read here).
10/22/2009 4:47:53 PM - G - Halted its slide today after gaps down for losses on above average volume on the 2 prior sessions following its latest earnings report violated its 50 DMA line and recent chart lows in the $20.50 area, triggering technical sell signals. Its color code was changed to green based on the weakness, and it would need to promptly repair its 50 DMA violation for its outlook to improve. This high-ranked Computer Software - Enterprise firm was featured in the October 2009 issue of CANSLIM.net News (read here).
10/21/2009 7:03:06 PM - G - Gapped down for a second day in a row today and violated recent chart lows in the $20.50 area, raising more serious concerns and triggering a more definitive technical sell signal. Color code was changed to green based on the technical weakness, and it would need to promptly repair its 50 DMA violation for its outlook to improve. After reporting earnings on 10/20/09 it gapped down and violated its 50 DMA line with a considerable loss on nearly 4 times average volume. This high-ranked Computer Software - Enterprise firm was featured in the October 2009 issue of CANSLIM.net News (read here).
10/21/2009 12:39:40 PM - G - Gapped down for a second day in a row today and violated recent chart lows in the $20.50 area, raising more serious concerns triggering a more definitive technical sell signal. Color code is changed to green based on the technical weakness, and it would need to promptly repair its 50 DMA violation for its outlook to improve. After reporting earnings on 10/20/09 it gapped down and violated its 50 DMA line with a considerable loss on nearly 4 times average volume. This high-ranked Computer Software - Enterprise firm was featured in the October 2009 issue of CANSLIM.net News (read here).
10/20/2009 4:39:14 PM - Y - Gapped down today after reporting earnings and violated its 50 DMA line, raising concerns while closing near the session low with a considerable loss on nearly 4 times average volume. Failure to find prompt support near its short-term average and near recent chart lows in the $20.50 area would raise more serious concerns and further weakness could trigger a more definitive technical sell signal. This high-ranked Computer Software - Enterprise firm was featured in the October 2009 issue of CANSLIM.net News (read here).
10/20/2009 2:01:48 PM - Y - Gapped down today, pulling back near important support at its 50 DMA line again after reporting decent results for the quarter ended Sep 30, 2009. Volume and volatility are often greater around earnings announcements. A violation of the 50 DMA and recent chart lows in the $20.50 area would raise more serious concerns and trigger technical sell signals. This high-ranked Computer Software - Enterprise firm was featured in the October 2009 issue of CANSLIM.net News (read here).
10/19/2009 4:47:39 PM - Y - Positively reversed today after a pullback near its 50 DMA line, then this high-ranked Computer Software - Enterprise firm reported decent results for the quarter ended Sep 30, 2009 after the close. Volume and volatility are often greater around earnings announcements. SWI was featured in the October 2009 issue of CANSLIM.net News (read here).
10/19/2009 10:10:00 AM - Y - Due to report quarterly earnings after the close today. It encountered moderate distributional pressure last week and pulled back near its previously cited pivot point and important support at its 50 DMA line. It was featured in the October 2009 issue of CANSLIM.net News (read here).
10/16/2009 6:31:55 PM - Y - Today's loss on higher volume was another indication of distributional pressure after a negative reversal on 10/14/09 following a gap up. Color code was changed to yellow while consolidating near its previously cited pivot point. Important support to watch is at its 50 DMA line. It was featured in the October 2009 issue of CANSLIM.net News (read here).
10/15/2009 4:52:05 PM - Y - Pulled back further today on lighter volume after a negative reversal on 10/14/09 following a gap up. Color code is changed to yellow while consolidating near its previously cited pivot point. Important support to watch is at its 50 DMA line. It was featured in the October 2009 issue of CANSLIM.net News (read here).
10/14/2009 6:43:21 PM - G - Negatively reversed today after gapping up and having a chance at a new high close, but it closed near the session low after failing to attract strong buying demand. It has quietly rallied up from important support at its 50 DMA line after briefly and quietly consolidating under its last pivot point. It was featured in the October 2009 issue of CANSLIM.net News (read here).
10/13/2009 4:27:12 PM - G - Quietly held its ground today. It has quietly rallied up from important support at its 50 DMA line after briefly and quietly consolidating under its last pivot point. It was featured in the October 2009 issue of CANSLIM.net News (read here).
10/12/2009 5:11:05 PM - G - Gain on near average volume today, rising back above its previously cited "max buy" level, so its color code is changed to green. It has quietly rallied up from important support at its 50 DMA line after briefly and quietly consolidating under its last pivot point. It was featured in the October 2009 issue of CANSLIM.net News (read here).
10/9/2009 5:52:48 PM - Y - A gain for the week on light volume helped it rally up from important support at its 50 DMA line after briefly and quietly consolidating under its last pivot point. It was featured in the October 2009 issue of CANSLIM.net News (read here).
10/8/2009 5:50:35 PM - Y - Initially gapped up for a small gain today but negatively reversed for a loss on light volume. Now consolidating near its 8/04/09 high, the basis for its last pivot point, it tested support at its 50 DMA line recently and then rallied back with light volume gains. It was featured in the October 2009 issue of CANSLIM.net News (read here).
10/7/2009 6:04:41 PM - Y - Gains this week on light volume have it bouncing from support at its 50 DMA line and rallying back above its 8/04/09 high. It was featured in the October 2009 issue of CANSLIM.net News (read here).
10/6/2009 5:33:40 PM - Y - Gains on light volume have it bouncing from support at its 50 DMA line and rallying back above its 8/04/09 high. It was featured in the October 2009 issue of CANSLIM.net News (read here).
10/5/2009 5:11:31 PM - Y - Gain today on light volume followed 4 consecutive losses on light volume, bouncing right at support offered by its 50 DMA line, and closing back above its 8/04/09 high close. It was featured in the October 2009 issue of CANSLIM.net News (read here).
10/2/2009 5:10:15 PM - Y - Gapped down today for a 4th consecutive loss on light volume and closed under its 8/04/09 high close of $21.35, technically negating its latest breakout. It was featured in the October 2009 issue of CANSLIM.net News (read here).
10/1/2009 5:25:03 PM - Y - Today's third consecutive loss on light volume left it near its 8/04/09 high close of $21.35 , where a lower close would completely negate its latest breakout. It was featured today in the just-published October issue of CANSLIM.net News (read here).
10/1/2009 9:04:07 AM - Y - Featured in the October issue of CANSLIM.net News
9/18/2009 1:21:14 PM - Gains with above average volume this week helped it rally to new highs from a choppy 5-week base above its 50 DMA line. Up considerably from its $13 IPO on 5/20/09. It has earned high ranks based on its solid earnings history and great relative strength. Patience may allow shares to be accumulated on pullbacks toward prior chart highs without chasing the stock more than +5% above its $21.62 high from 8/04/09.
8/11/2009 1:46:40 PM - Up considerably from its $13 IPO on 5/20/09, there is no sound base. It has earned high ranks based on its solid earnings history and great relative strength.