2/2/2021 12:29:16 PM - Reversed into the red after early gains today hitting a new 52-week high following 2 consecutive volume-driven gains. Found prompt support near its 50 DMA line ($47.42). Reported strong Dec '20 quarterly results but fundamental concern remain. It was dropped from the Featured Stocks list on 12/16/14.
1/29/2021 12:46:54 PM - Hitting a new 52-week high. Found prompt support near its 50 DMA line. Reported strong Dec '20 quarterly results but fundamental concern remain. It was dropped from the Featured Stocks list on 12/16/14.
12/16/2014 5:53:28 PM - Sank further below its 50 DMA line with above average volume behind today's loss after triggering a technical sell signal on the prior session. Only a prompt rebound above its 50 DMA line would help its outlook improve. It will be dropped from the Featured Stocks list tonight.
12/15/2014 6:25:40 PM - G - Slumped well below its 50 DMA line with heavier volume today after triggering a technical sell signal on the prior session. Only a prompt rebound above its 50 DMA line would help its outlook improve.
12/12/2014 6:13:50 PM - G - Slumped on light volume to a close below its 50 DMA line triggering a technical sell signal and its color code is changed to green. Only a prompt rebound above its 50 DMA line would help its outlook improve.
12/10/2014 6:27:33 PM - Y - Endured more distributional pressure today slumping near its 50 DMA line ($95.41). Subsequent losses leading to a violation may trigger a technical sell signal. See the latest FSU analysis for more details and annotated graphs.
12/10/2014 1:26:13 PM - Y - Enduring more distributional pressure today. Managed a "positive reversal" on the prior session after testing support at its 50 DMA line ($95.41). Subsequent losses leading to a violation may trigger a technical sell signal. See the latest FSU analysis for more details and annotated graphs.
12/9/2014 7:14:38 PM - Y - Managed a "positive reversal" today after testing support at its 50 DMA line. See the latest FSU analysis for more details and new annotated graphs.
12/8/2014 6:27:25 PM - Y - Still holding its ground, however, after forming an advanced "3-weeks tight" base it has not produced the volume-driven gains for new highs needed to trigger a new (or add-on) technical buy signal. Prior highs coincide with its 50 DMA line defining important near-term support to watch on pullbacks.
12/2/2014 5:39:11 PM - Y - Fell for a 5th consecutive loss on even higher volume today, a sign of distributional pressure. After forming an advanced "3-weeks tight" base it has not produced the volume-driven gains for new highs needed to trigger a new (or add-on) technical buy signal. Prior highs coincide with its 50 DMA line defining important near-term support to watch on pullbacks.
12/1/2014 6:43:35 PM - Y - Fell for a 4th consecutive loss on higher volume today. After forming an advanced "3-weeks tight" base it has not produced the volume-driven gains for new highs needed to trigger a new (or add-on) technical buy signal. Prior highs coincide with its 50 DMA line defining important near-term support to watch on pullbacks.
11/25/2014 5:36:40 PM - Y - Hovering near its all-time high after forming an advanced "3-weeks tight" base. Volume-driven gains for new highs may trigger a new (or add-on) technical buy signal. Prior highs coincide with its 50 DMA line defining important near-term support to watch on pullbacks.
11/20/2014 4:44:18 PM - Y - Color code is changed to yellow after forming an advanced "3-weeks tight" base. Volume-driven gains for new highs may trigger a new (or add-on) technical buy signal. Prior highs coincide with its 50 DMA line defining important near-term support to watch on pullbacks. See the latest FSU analysis for more details and new annotated graphs.
11/13/2014 12:44:03 PM - G - Still stubbornly holding its ground near its 52-week high, possibly forming an advanced "3-weeks tight" base. Prior highs in the $88 area coincide with its 50 DMA line ($88.50) defining important near-term support to watch on pullbacks.
11/10/2014 5:52:07 PM - G - Stubbornly holding its ground near its 52-week high, extended from its prior base after volume-driven gains. Prior highs in the $88 area define important near-term support to watch above its 50 DMA line ($87.27).
11/4/2014 5:45:39 PM - G - Hovering near its 52-week high, extended from its prior base after volume-driven gains. Prior highs in the $88 area define important near-term support to watch above its 50 DMA line. See the latest FSU analysis for more details and new annotated graphs.
11/3/2014 6:18:36 PM - G - Hovering near its 52-week high, holding its ground after volume-driven gains. It is very extended beyond its "max buy" level. Prior highs in the $88 area define important near-term support to watch above its 50 DMA line.
10/29/2014 5:51:31 PM - G - Pulled back from its 52-week high today following 4 consecutive volume-driven gains. It is very extended beyond its "max buy" level. Prior highs in the $88 area define important near-term support to watch above its 50 DMA line.
10/28/2014 6:30:49 PM - G - Hit another new 52-week high with today's 4th consecutive volume-driven gain, getting more extended beyond its "max buy" level. Its 50 DMA line and prior highs in the $88 area define important near-term support to watch on pullbacks.
10/27/2014 1:01:08 PM - G - Hit another new 52-week high with today's 3rd consecutive volume-driven gain, getting extended beyond its "max buy" level. Its 50 DMA line defines important near-term support. Reported +180% earnings on +54% sales revenues for the Sep '14 quarter, showing impressive sales and earnings acceleration in recent quarterly comparisons.
10/24/2014 5:34:21 PM - G - Reported +180% earnings on +54% sales revenues for the Sep '14 quarter, showing impressive sales and earnings acceleration in recent quarterly comparisons. Spiked to a new 52-week high with today's considerable gap up gain backed by more than 4 times average volume clinching a convincing technical buy signal. Color code is changed to green after getting extended beyond its "max buy" level. Its 50 DMA line defines important near-term support.
10/24/2014 12:44:36 PM - Y - Reported +180% earnings on +54% sales revenues for the Sep '14 quarter, showing impressive sales and earnings acceleration in recent quarterly comparisons. Hit a new 52-week high with today's considerable gap up gain, rallying above its pivot point. Gains above a stock's pivot point must have at least +40% above average volume to clinch a convincing technical buy signal. Its 50 DMA line defines important near-term support.
10/24/2014 11:19:57 AM - Y - Reported +180% earnings on +54% sales revenues for the Sep '14 quarter, showing impressive sales and earnings acceleration in recent quarterly comparisons. Gapped up and hit a new 52-week high today, rallying above its pivot point. A volume-driven gain and strong finish may clinch a convincing technical buy signal. Its 50 DMA line defines important near-term support.
10/23/2014 6:01:13 PM - Y - Reported Sep '14 quarterly earnings after the close today. Approaching its 52-week high with recent gains lacking great volume conviction. Recent low ($72.13 on 10/15/14) defines important near-term support to watch below its 50 DMA line ($80.24).
10/21/2014 6:08:10 PM - Y - Consolidating above its 50 DMA line where it found prompt support. Recent low ($72.13 on 10/15/14) defines important near-term support to watch. Reporting Sep '14 quarterly earnings on Thursday.
10/20/2014 6:11:13 PM - Y - Consolidating near 50 DMA line. Poor market conditions (M criteria) have raised overriding concerns arguing against any new buying efforts until strength returns. Recent low ($72.13 on 10/15/14) defines important near-term support to watch. Reporting Sep '14 quarterly earnings on Thursday. See the latest FSU analysis for more details and new annotated graphs.
10/16/2014 6:24:19 PM - Y - Rebounded above its 50 DMA line with a 3rd consecutive gain and its color code is changed to yellow. Poor market conditions (M criteria) have raised overriding concerns arguing against any new buying efforts until strength returns. Recent low ($72.13 on 10/15/14) defines important near-term support to watch. Faces near term resistance due to overhead supply up through the $89 level.
10/13/2014 5:54:43 PM - G - Finished in the upper half of its intra-day range today but slumped below its 50 DMA line raising concerns and its color code is changed to green. Poor market conditions (M criteria) have raised overriding concerns arguing against any new buying efforts until strength returns. Faces near term resistance due to overhead supply up through the $89 level.
10/7/2014 6:36:18 PM - Y - Slumped near its 50 DMA line ($76.76) today while eroding market conditions (M criteria) raised greater concerns. It faces near term resistance due to overhead supply up through the $89 level.
10/1/2014 2:05:31 PM - Y - Still quietly consolidating, however eroding market conditions (M criteria) have raised concerns. Previously noted - "Volume-driven gains above the new pivot point cited may trigger a new (or add-on) technical buy signal. Its 50 DMA line and prior highs define important support to watch on pullbacks."
9/26/2014 6:55:39 PM - Y - Subsequent volume-driven gains above the new pivot point cited may trigger a new (or add-on) technical buy signal. Its 50 DMA line and prior highs define important support to watch on pullbacks. See the latest FSU analysis for more details and new annotated graphs.
9/26/2014 6:55:36 PM - Y - Subsequent volume-driven gains above the new pivot point cited may trigger a new (or add-on) technical buy signal. Its 50 DMA line and prior highs define important support to watch on pullbacks. See the latest FSU analysis for more details and new annotated graphs.
9/23/2014 12:30:32 PM - Y - Rebounded from today's early lows. Formed an advanced "3-weeks tight" base while holding its ground stubbornly. Subsequent volume-driven gains above the new pivot point cited may trigger a new (or add-on) technical buy signal. Prior highs in the $74-77 area define initial support to watch on pullbacks.
9/22/2014 5:41:57 PM - Y - Pulled back with above average volume today. Formed an advanced "3-weeks tight" base while holding its ground stubbornly. Subsequent volume-driven gains above the new pivot point cited may trigger a new (or add-on) technical buy signal. Prior highs in the $74-77 area define initial support to watch on pullbacks.
9/19/2014 1:24:40 PM - Y - Forming an advanced "3-weeks tight" base while holding its ground stubbornly. Subsequent volume-driven gains above the new pivot point cited may trigger a new (or add-on) technical buy signal. Prior highs in the $74-77 area define initial support to watch on pullbacks.
9/18/2014 1:02:38 PM - G - Possibly forming an advanced "3-weeks tight" base while holding its ground stubbornly after 6 consecutive weekly gains. Prior highs in the $74-77 area define initial support to watch on pullbacks.
9/15/2014 7:34:25 PM - G - Perched -6.6% off its 52-week high, consolidating after getting extended from its prior base. Prior highs in the $74-77 area define initial support to watch on pullbacks.
9/10/2014 4:40:39 PM - G - Perched at its 52-week high, extended from its prior base. Prior highs in the $74-77 area define initial support to watch on pullbacks. See the latest FSU analysis for more details and new annotated graphs.
9/9/2014 7:02:24 PM - G - Perched at its 52-week high, pausing today after 3 consecutive gains. Extended from its prior base. Prior highs near $74 define initial support to watch on pullbacks.
9/2/2014 6:20:21 PM - G - Spiked to another new 52-week high today but erased much of its gain and finished in the lower third of its intra-day range, a sign of distributional pressure. Volume was +72% above average behind the gain on the prior session, however it was getting extended from its prior base by the time volume-driven gain helped clinch a technical buy signal.
8/29/2014 2:54:35 PM - G - Hitting another new 52-week high with above average volume behind today's gain and its color code is changed to green after and rallying beyond its "max buy" level. Recent gain lacked significant volume, however, while gains should be backed by at least +40% above average volume to trigger a proper technical buy signal.
8/27/2014 12:38:44 PM - Y - Perched at its 52-week high and rallying further above its pivot point with today's 5th consecutive gain, however recent volume totals have been near average or below average. Gains should be backed by volume at least +40% above average to trigger a proper technical buy signal. Highlighted in yellow with pivot point based on its 6/06/14 high plus 10 cents in the 8/22/14 mid-day report (read here).
8/25/2014 3:24:59 PM - Y - Rallied above its pivot point but volume thus far is below average today. Gains should be backed by volume at least +40% above average to trigger a proper technical buy signal. Highlighted in yellow with pivot point based on its 6/06/14 high plus 10 cents in the 8/22/14 mid-day report (read here). See the latest FSU analysis for more details and annotated graphs.
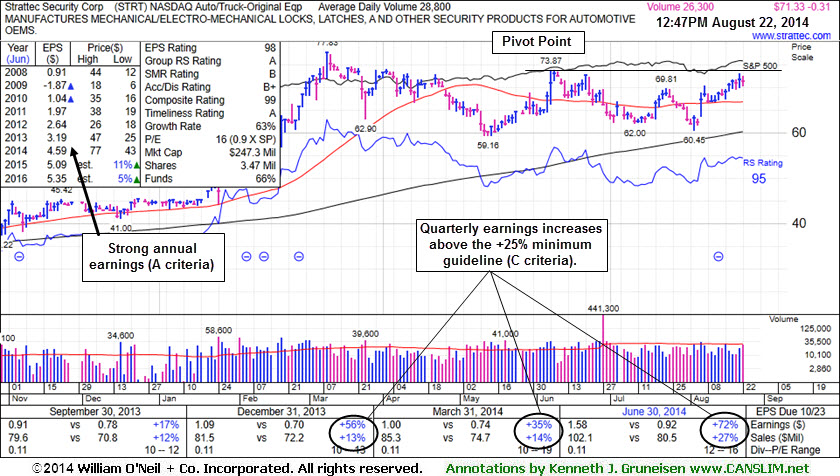
8/22/2014 5:53:35 PM - Y - Finished strong after highlighted in yellow with pivot point based on its 6/06/14 high plus 10 cents in the earlier mid-day report (read here). Disciplined investors may watch for subsequent volume-driven gains above the pivot to trigger a proper technical buy signal. Quarterly earnings increases through Jun '14 above the +25% minimum guideline satisfy the C criteria and its annual earnings (A criteria) history has been strong. Increasing ownership by top-rated funds (I criteria) is a reassuring sign. See the latest FSU analysis for more details and new annotated graphs.
8/22/2014 - Y - Color code is changed to yellow with pivot point based on its 6/06/14 high plus 10 cents. Disciplined investors may watch for subsequent volume-driven gains above the pivot to trigger a proper technical buy signal. Quarterly earnings increases through Jun '14 above the +25% minimum guideline satisfy the C criteria and its annual earnings (A criteria) history has been strong. Increasing ownership by top-rated funds (I criteria) is a reassuring sign.
6/18/2014 12:29:00 PM - Consolidating above its 50 DMA line and -11.6% off its 52-week high today. Last noted with caution in the 6/06/14 mid-day report - "Reported earnings +35% on +14% sales revenues for the Mar '14 quarter, a 2nd consecutive quarterly comparison above the +25% minimum earnings guideline (C criteria). Prior quarterly comparisons were sub par and fundamental concerns remain."
6/6/2014 1:03:51 PM - Rebounding from below its 50 DMA line toward its 52-week high with today's 4th consecutive volume-driven gain. Reported earnings +35% on +14% sales revenues for the Mar '14 quarter, a 2nd consecutive quarterly comparison above the +25% minimum earnings guideline (C criteria). Prior quarterly comparisons were sub par and fundamental concerns remain.
3/17/2014 12:21:00 PM - Retreating from its 52-week high with today's 5th consecutive loss. Prior mid-day reports repeatedly cautioned members - "Reported earnings +56% on +13% sales revenues for the Dec '13 quarter, above the +25% minimum earnings guideline (C criteria) but prior quarterly comparisons were sub par and fundamental concerns remain."
3/5/2014 12:45:17 PM - Retreating from its 52-week high today following 6 consecutive gains marked by volume. Prior mid-day reports repeatedly cautioned members - "Reported earnings +56% on +13% sales revenues for the Dec '13 quarter, above the +25% minimum earnings guideline (C criteria) but prior quarterly comparisons were sub par and fundamental concerns remain."
3/3/2014 1:01:14 PM - Perched at its 52-week high today following 4 consecutive gains on ever-increasing volume. Prior mid-day reports repeatedly cautioned members - "Reported earnings +56% on +13% sales revenues for the Dec '13 quarter, above the +25% minimum earnings guideline (C criteria) but prior quarterly comparisons were sub par and fundamental concerns remain."
2/28/2014 1:07:39 PM - Hitting another new 52-week high with today's 4th consecutive gain on ever-increasing volume. Prior mid-day reports repeatedly cautioned members - "Reported earnings +56% on +13% sales revenues for the Dec '13 quarter, above the +25% minimum earnings guideline (C criteria) but prior quarterly comparisons were sub par and fundamental concerns remain."
2/27/2014 12:55:54 PM - Hitting a new 52-week high with today's 3rd consecutive gain on ever-increasing volume. Prior mid-day reports repeatedly cautioned members - "Reported earnings +56% on +13% sales revenues for the Dec '13 quarter, above the +25% minimum earnings guideline (C criteria) but prior quarterly comparisons were sub par and fundamental concerns remain."
2/25/2014 12:25:07 PM - Hovering at its 52-week high following a spurt of volume-driven gains. Prior mid-day reports cautioned members - "Reported earnings +56% on +13% sales revenues for the Dec '13 quarter, above the +25% minimum earnings guideline (C criteria) but prior quarterly comparisons were sub par and fundamental concerns remain."
2/24/2014 12:33:03 PM - Hitting another new 52-week high with above average volume behind today's gain adding to a spurt of volume-driven gains. The 2/19/14 mid-day report cautioned members - "Reported earnings +56% on +13% sales revenues for the Dec '13 quarter, above the +25% minimum earnings guideline (C criteria) but prior quarterly comparisons were sub par and fundamental concerns remain."
2/19/2014 1:19:24 PM - Hitting a new 52-week high with above average volume behind today's 8th consecutive gain. Reported earnings +56% on +13% sales revenues for the Dec '13 quarter, above the +25% minimum earnings guideline (C criteria) but prior quarterly comparisons were sub par and fundamental concerns remain.